(DIYA) Bhumkar Chowk Call Girls Just Call 7001035870 [ Cash on Delivery ] Pun...
Q1 2009 Financial Report of Steel Dynamics Inc.
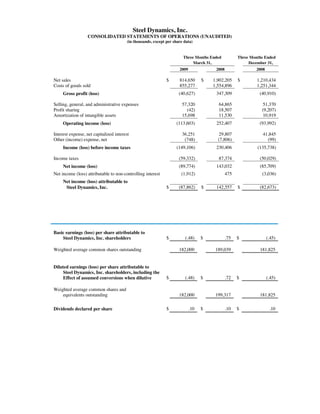
1. Steel Dynamics, Inc.
CONSOLIDATED STATEMENTS OF OPERATIONS (UNAUDITED)
(in thousands, except per share data)
Three Months Ended Three Months Ended
March 31, December 31,
2009 2008 2008
Net sales $ 814,650 $ 1,902,205 $ 1,210,434
Costs of goods sold 855,277 1,554,896 1,251,344
(40,627) 347,309 (40,910)
Gross profit (loss)
Selling, general, and administrative expenses 57,320 64,865 51,370
Profit sharing (42) 18,507 (9,207)
Amortization of intangible assets 15,698 11,530 10,919
(113,603) 252,407 (93,992)
Operating income (loss)
Interest expense, net capitalized interest 36,251 29,807 41,845
Other (income) expense, net (748) (7,806) (99)
(149,106) 230,406 (135,738)
Income (loss) before income taxes
Income taxes (59,332) 87,374 (50,029)
(89,774) 143,032 (85,709)
Net income (loss)
Net income (loss) attributable to non-controlling interest (1,912) 475 (3,036)
Net income (loss) attributable to
$ (87,862) $ 142,557 $ (82,673)
Steel Dynamics, Inc.
Basic earnings (loss) per share attributable to
$ (.48) $ .75 $ (.45)
Steel Dynamics, Inc. shareholders
Weighted average common shares outstanding 182,000 189,039 181,825
Diluted earnings (loss) per share attributable to
Steel Dynamics, Inc. shareholders, including the
$ (.48) $ .72 $ (.45)
Effect of assumed conversions when dilutive
Weighted average common shares and
equivalents outstanding 182,000 199,317 181,825
$ .10 $ .10 $ .10
Dividends declared per share
2. Steel Dynamics, Inc.
UNAUDITED SUPPLEMENTAL OPERATING INFORMATION
(dollars in thousands / volume data in actual net tons, except non-ferrous data)
Three Months Ended Three Months Ended
March 31, December 31,
2009 2008 2008
Steel Operations*
Shipments
Flat Roll Division 303,938 685,320 361,145
Structural and Rail Division 129,555 299,687 228,132
Engineered Bar Products Division 71,540 147,948 123,449
Roanoke Bar Division 76,610 151,368 94,374
Steel of West Virginia 43,124 75,724 45,788
The Techs 118,359 262,011 89,551
Combined 743,126 1,622,058 942,439
Intra-company (52,012) (130,685) (51,803)
External 691,114 1,491,373 890,636
Production (excluding The Techs) 697,806 1,372,364 760,307
Net sales
Combined $ 535,184 $ 1,268,389 $ 860,242
Intra-company (30,142) (85,060) (38,189)
External $ 505,042 $ 1,183,329 $ 822,053
Operating income (loss) before amortization of intangibles $ (65,486) $ 240,342 $ 3,164
Amortization of intangibles (3,428) (5,785) (3,428)
Operating income (loss) $ (68,914) $ 234,557 $ (264)
Metals Recycling and Ferrous Resources**
Ferrous metals shipments
Combined 729,869 1,391,382 897,922
Intra-company (246,728) (463,893) (438,532)
External 483,141 927,489 459,390
Non-ferrous metals shipments (thousands of pounds) 190,394 238,788 177,246
Iron Dynamics shipments
Liquid pig iron 41,226 45,443 21,171
Hot briquetted iron 20,326 19,741 27,005
Other 674 2,809 3,834
Intra-company 62,226 67,993 52,010
Net sales
Combined $ 296,408 $ 803,765 $ 388,858
Intra-company (58,702) (197,005) (123,080)
External $ 237,706 $ 606,760 $ 265,778
Operating income (loss) before amortization of intangibles $ (12,422) $ 52,778 $ (118,603)
Amortization of intangibles (12,044) (5,602) (7,214)
Operating income (loss) $ (24,466) $ 47,176 $ (125,817)
Steel Fabrication***
Shipments
Combined 45,278 68,606 63,783
Intra-company (15) (273) (101)
External 45,263 68,333 63,682
Net sales
Combined $ 60,807 $ 78,522 $ 93,195
Intra-company (22) (66) (221)
External $ 60,785 $ 78,456 $ 92,974
Operating income before amortization of intangibles $ 3,167 $ 3,727 $ 5,368
Amortization of intangibles (167) (83) (217)
Operating income $ 3,000 $ 3,644 $ 5,151
* Steel Operations include the company's five steelmaking divisions and The Techs three galvanizing plants.
** Metals Recycling and Ferrous Resources Operations include OmniSource and Recycle South metals recycling operations,
as well as Iron Dynamics' (IDI) pig iron substitute production facility (all IDI shipments are consumed internally).
Operating income (loss) also includes the expenses associated with the construction and start up of the company's Mesabi
Nugget facilities.
*** Steel Fabrication Operations include the company's joist and deck fabrication operations.
3. Steel Dynamics, Inc.
CONSOLIDATED BALANCE SHEETS
(in thousands)
March 31, December 31,
2009 2008
(unaudited)
Assets
Current assets
Cash and equivalents $ 16,067 $ 16,233
Accounts receivable, net 361,839 502,932
Inventories, net 833,074 1,023,235
Deferred income taxes 26,631 23,562
Tax refunds receivable 93,475 86,321
Other current assets 35,725 57,632
1,366,811 1,709,915
Total current assets
2,108,657 2,072,857
Property, plant and equipment, net
16,217 18,515
Restricted cash
551,489 614,786
Intangible assets, net
812,161 770,438
Goodwill
70,744 67,066
Other assets
$ 4,926,079 $ 5,253,577
Total assets
Liabilities and Stockholders’ Equity
Current liabilities
Accounts payable $ 243,914 $ 263,393
Income taxes payable - 4,107
Accrued expenses 189,230 209,697
Accrued profit sharing 56 62,561
Senior secured revolving credit facility, matures 2012 231,000 366,000
Other current maturities of long-term debt 65,450 65,223
729,650 970,981
Total current liabilities
Long-term debt
Senior secured term A loan 487,700 503,800
7 3/8% senior notes, due 2012 700,000 700,000
6 ¾% senior notes, due 2015 500,000 500,000
7 ¾% senior notes, due 2016 500,000 500,000
Other long-term debt 30,314 15,361
2,218,014 2,219,161
Total long-term debt
373,712 365,496
Deferred income taxes
65,759 65,626
Other liabilities
Commitments and contingencies
Stockholders’ equity
Common stock 545 545
Treasury stock, at cost (734,083) (737,319)
Additional paid-in capital 544,971 541,686
Other accumulated comprehensive loss (1,073) (1,411)
Retained earnings 1,714,310 1,820,385
Total Steel Dynamics, Inc. stockholders’ equity 1,524,670 1,623,886
Non-controlling interest 14,274 8,427
1,538,944 1,632,313
Total stockholders’ equity
$ 4,926,079 $ 5,253,577
Total liabilities and stockholders’ equity
4. Steel Dynamics, Inc.
CONSOLIDATED STATEMENTS OF CASH FLOWS (UNAUDITED)
(in thousands)
Three Months Ended
March 31,
2009 2008
Operating activities
Net income (loss) attributable to Steel Dynamics, Inc. $ (87,862) $ 142,557
Adjustments to reconcile net income (loss) attributable to
Steel Dynamics, Inc. to net cash provided by operating activities:
Depreciation and amortization 56,963 53,212
Equity-based compensation 5,343 3,929
Deferred income taxes 7,695 (973)
Non-controlling interest (1,912) 475
Changes in certain assets and liabilities:
Accounts receivable 141,093 (185,793)
Inventories 193,097 9,575
Accounts payable (34,054) 114,515
Income taxes payable (4,107) 72,608
Other working capital (61,839) 3,491
Net cash provided by operating activities 214,417 213,596
Investing activities
Purchases of property, plant and equipment (74,338) (93,764)
Purchases of securities - (20,373)
Other investing activities (3,223) 1,329
Net cash used in investing activities (77,561) (112,808)
Financing activities
Issuance of current and long-term debt 237,059 218,000
Repayment of current and long-term debt (358,666) (233,214)
Debt issuance costs (453) (1,946)
Issuance of common stock (net of expenses) and
proceeds from exercise of stock options, including related tax effect (1,780) 7,177
Purchase of treasury stock - (46,128)
Contribution from non-controlling investor 5,000 -
Dividends paid (18,182) (14,274)
Net cash used in financing activities (137,022) (70,385)
Increase (decrease) in cash and equivalents (166) 30,403
Cash and equivalents at beginning of period 16,233 28,486
Cash and equivalents at end of period $ 16,067 $ 58,889
Supplemental disclosure information
Cash paid for interest $ 11,984 $ 11,385
Cash paid (refunded) for federal and state income taxes $ (55,430) $ 1,387