Comprehensive Moodle Reports for D.Y. Patil University
•Als PPTX, PDF herunterladen•
0 gefällt mir•45 views

In this case study presentation you can see how D.Y. Patil University has used the LearnerScript Moodle reporting & analytics tool for "Comprehensive Reports from Multiple Moodle Instances" purpose. This case study was presented at the online MoodleMoot India 2020 event by LearnerScript project manager and D.Y. Patil University LMS administrator. Website: https://learnerscript.com/ Demo: https://demo.learnerscript.com/

Empfohlen
Empfohlen
Weitere ähnliche Inhalte
Was ist angesagt?
Was ist angesagt? (20)
Ähnlich wie Comprehensive Moodle Reports for D.Y. Patil University
Ähnlich wie Comprehensive Moodle Reports for D.Y. Patil University (20)
Kürzlich hochgeladen
Kürzlich hochgeladen (20)
Comprehensive Moodle Reports for D.Y. Patil University
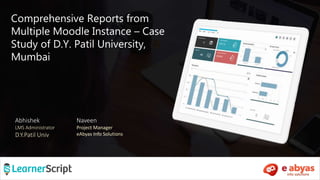
- 1. Naveen Project Manager eAbyas Info Solutions Comprehensive Reports from Multiple Moodle Instance – Case Study of D.Y. Patil University, Mumbai Abhishek LMS Administrator D.Y.Patil Univ
- 2. Agenda D.Y. Patil Univ – Moodle Implementation Introduction01 Reports Dashboard Why LearnerScript Reports Plugin ? 02 Reporting Dashboard Issue with Reporting 03 Seeing is believing Implementation Approach 04 Ask, and you’ll be answered Better Decision Making 05 06 Q & A Thank You
- 3. Introduction • D.Y. Patil University Implementation – Different Moodle Instances • Varied Compliance, Grading Structure • 13 Moodle Implementations • Daily Summary Report Moodle Bio-Tech Moodle Engineering - RAIT Moodle MBA Moodle Hospitality Moodle Medical
- 4. Issue with Reporting • Management Demand for Timely Reports • Single Dashboard Requirement • Decision Making • Improve Student Usage • Track Faculty Involvement • Data from Multiple Instance • Dynamic Content • Huge Data log
- 5. LearnerScript Analytics Plugin • Dashboard for Management • Graphical Representation • Download Reports in different Formats • Schedule of Reports • Collate Data from Multiple Instances • Reduce impact on Moodle Performance • Administrator to Create Custom reports • Widgets for Roles
- 6. Dashboard
- 7. Overall improved performance on Dashboards & Reports New Dashboard look and feel, with new widgets Course Filter to help get Course-wise Dashboard Forum activities and participation report SCORM Timespent from SCORM track Report permissions based on Moodle contextual roles School wise student login report helps to push faculties to increase student involvement daily. Simplified report creation class to build new reports & 85 plus Canned Report
- 8. New Dashboard look and feel, with new widgets Student content hit rate report gives a clear picture to analyse how much uploaded content is beneficial for students & which type of content students are looking for. PPT, pdf, video etc...
- 9. Overall improved performance on Dashboards & Reports New Dashboard look and feel, with new widgets Course Filter to help get Course-wise Dashboard Forum activities and participation report SCORM Timespent from SCORM track Report permissions based on Moodle contextual roles Active students - Last 30 days provides active students, in-active students count of last 30 days from all colleges Simplified report creation class to build new reports & 85 plus Canned Report
- 10. Overall improved performance on Dashboards & Reports New Dashboard look and feel, with new widgets Course Filter to help get Course-wise Dashboard Forum activities and participation report SCORM Timespent from SCORM track Report permissions based on Moodle contextual roles Faculty overview report - Faculty wise course content uploaded in each course Simplified report creation class to build new reports & 85 plus Canned Report
- 11. Overall improved performance on Dashboards & Reports New Dashboard look and feel, with new widgets Course Filter to help get Course-wise Dashboard Forum activities and participation report SCORM Timespent from SCORM track Report permissions based on Moodle contextual roles Most engaging teaching notes - content viewed by the students from different subjects. Simplified report creation class to build new reports & 85 plus Canned Report
- 12. Q & A Ask, and you’ll be answered