
Empfohlen
Weitere ähnliche Inhalte
Was ist angesagt?
Was ist angesagt? (13)
Ähnlich wie Survival and Reproduction
Ähnlich wie Survival and Reproduction (20)
Mehr von dwinter1
Mehr von dwinter1 (13)
Kürzlich hochgeladen
Kürzlich hochgeladen (20)
Survival and Reproduction
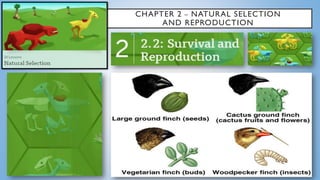
- 1. CHAPTER 2 – NATURAL SELECTION AND REPRODUCTION
- 2. 2.2.1:WARM-UP We agree that the newt population became more poisonous because the snakes in this environment caused poison to be an adaptive trait. Now, we will add to this claim. The claim additions below are ideas from park visitors about how the newts got so poisonous. Based on what you have learned so far, decide which additions you think are true, false, or partially true. Read each claim and select from the choices in the dropdown menu. 1. Poison Level 10 is the most common because the newts with this trait were able to live longer than other newts. 2. Poison Level 10 is the most common because the newts with this trait reproduce more than other newts.
- 3. 2.2.1:WARM-UP We now have to consider two competing ideas. Some park visitors have suggested that Poison Level 10 is the most common because newts with this trait live longer than other newts. Others think that Poison Level 10 is the most common because newts with this trait reproduce more than other newts. Each of these ideas builds on the claim we decided to support at the end of Chapter 1, but now we need to figure out which one is best supported by evidence.
- 4. Observe individual ostrilopes with different traits to see a relationship between traits and the amount of reproduction. Key concept Individuals inherit their genes from their parents, and these genes determine their traits. Therefore, traits in a population are passed down from generation to generation. 2.2.2: SIM OBSERVING REPRODUCTION IN THE SIM Investigation Question How do some traits become more common over many generations while others become less common?
- 5. Some organisms reproduce more than others. Let’s review possible answers to the Investigation Question. • Some organisms can have more offspring than others. • Some organisms will not survive in the environment long enough to reproduce. If yellow ostrilopes from one generation had more offspring than green ostrilopes, would the next generation have more yellow ostrilopes than green ostrilopes? 2.2.2: SIM OBSERVING REPRODUCTION IN THE SIM YES
- 6. 2.2.2: SIM OBSERVING REPRODUCTION IN THE SIM Using the Reproduction Claims mode let’s zoom in and demonstrate locating an ostrilope with a color trait from the data table on your screen (Blue 1, Blue 4,Yellow 7,Yellow 10). Let’s Project the Natural Selection Simulation and demonstrate collecting data and resetting the Sim.
- 7. 2.2.2: SIM OBSERVING REPRODUCTION IN THE SIM Select that ostrilope and press RUN. Count the number of times that ostrilope reproduces, and demonstrate recording that number in the data table.Then demonstrate resetting the Sim to collect data for a different ostrilope color. Let’s Project the Natural Selection Simulation and demonstrate collecting data and resetting the Sim. Record the number of times the ostrilope Reproduces Reset SIM after each ostrilope dies.
- 8. 2.2.2: SIM OBSERVING REPRODUCTION IN THE SIM
- 9. 2.2.2: SIM OBSERVING REPRODUCTION IN THE SIM We gathered information about the number of offspring for each color trait in the data table. But, following just a few ostrilopes before they die is not enough for us to identify a pattern at the scale of the population. To do this, we need to compare observations from the whole class and come to a group conclusion about what we see. We’ll need to collect data from each group and average it. Collecting whole class data using the DATATOOL
- 10. 2.2.2: SIM OBSERVING REPRODUCTION IN THE SIM Let’s share what you notice from the data tool Observe the following: • Not all ostrilopes reproduced the same amount. • Ostrilopes with adaptive traits (Yellow Color 7) reproduced more on average (because they were the most likely to survive). • Ostrilopes with non-adaptive traits (Levels 1, 4, and 10) reproduced less on average (because they were less likely to survive as long).
- 11. 2.2.2: SIM OBSERVING REPRODUCTION IN THE SIM Discuss with your table how this averaged data from the class helps to answer the Investigation Question
- 12. 2.2.2: SIM OBSERVING REPRODUCTION IN THE SIM 1. What pattern describes the relationship between how long an ostrilope lived and how many offspring it had? 2. Which ostrilopes became more common over time, and why? 3. Which ostrilopes became less common over time, and why? 4. If the color of the environment became blue, which ostrilopes do you think would become more or less common, and why? Ostrilopes that lived longer had more offspring. Ostrilopes withYellow Color 7 became more common because they survived longer, so they had more opportunities to reproduce and have offspring. Ostrilopes with colors that didn’t blend into the environment, like Blue Color 1, 4, andYellow Color 10, became less common because they were more likely to be eaten by predators before they could have many offspring. Ostrilopes with blue-color traits would become more common because they’d be camouflaged and survive longer, so they could have more offspring. Ostrilopes with green and yellow colors would be more likely to be eaten by carnithons before they could have many offspring.
- 13. 2.2.2: SIM OBSERVING REPRODUCTION IN THE SIM Answer the poll by selecting your choice at the bottom of . Supports: ostrilopes with Yellow Color 7 had a higher average then the others. VIEW POLLING DATA
- 14. 2.2.3: MODELING TOOL RESPONDING TO SHERMAN You will create a model to explain how different organisms’ survival and reproduction rates lead to traits becoming more or less common over time.GOAL You will be using the Modeling Tool to respond to Sherman. Scientists often explain their thinking in writing and by making visual models. You are going to return to the Sherman’s Story from the previous lesson and explain your thinking by writing a response and making a visual model.
- 15. 2.2.3: MODELING TOOL RESPONDING TO SHERMAN NEW TRAIT LABELS You will make a model of how the distribution of beak- strength traits changed. This model will help you write your responses to Sherman. You can add more than one Trait label to a single trait. Add trait labels Predict Histogram
- 16. 2.2.3: MODELING TOOL RESPONDING TO SHERMAN Respond to Prompt after creating your visual model. 1 2 3
- 17. 2.2.3: MODELING TOOL RESPONDING TO SHERMAN ModelingTool Response: A proficient model is shown below. You should group theTrait labels together as shown in Histogram 1 (+S with +O, -S with -O). Proficient models should include at least two traits labeled in Histogram 1 but might include all traits labeled. Predictions about Histogram 2 will vary significantly. Correct responses should show a shift in distribution of traits toward stronger beak strength and should only include traits that were present in Histogram 1. TIME
- 18. 2.2.3: MODELING TOOL RESPONDING TO SHERMAN WHY DOTHESE BIRDS HAVE STRONGER BEAKS TIME Individuals get their traits from their parents. The birds with stronger beaks were able to crack open more seeds and eat more, which means they lived longer and reproduced more, passing on their strong-beak trait. What may have happened is birds with weak beaks couldn’t crack enough seeds to have enough to eat to survive, and so they died before they could reproduce, which means they did not pass on their weak-beak trait. Over many generations, the distribution of traits changed so that the population had more and more individuals with the strong-beak trait.
- 19. 2.2.3: MODELING TOOL RESPONDING TO SHERMAN Let’s share your responses to Sherman’s Story. Connecting Sherman’s Story to the old claim that individual newts became more poisonous because they wanted to. In the Warm-Up, you read and thought about the claims regarding the newt mystery. Based on Sherman’s Story that you just read, what else can we say to people who think that the newts in Oregon State Park became more poisonous because they wanted to? That’s impossible. Traits are determined by genes that are inherited from an individual’s parents. Individuals cannot choose their traits.
- 20. 2.1.4 HOMEWORK MAKING CONNECTIONS Example: • We have been investigating how populations change over many generations. • Most of these changes are in response to environmental changes. • This is connected to what you learned about in the Microbiome unit. • When one part of the body system changes, such as an increase in the number of harmful gut bacteria, other body systems are affected. • As a result, the other helpful bacteria in the intestines cannot survive, which makes people sick. Think creatively! Challenge yourself to connect a very different science topic to our current topic.