Nitrogen Transformations in Aquaponic Systems
•
1 gefällt mir•1,185 views

Samir Khanal
Empfohlen

Empfohlen
Weitere ähnliche Inhalte
Was ist angesagt?
Was ist angesagt? (20)
Andere mochten auch
Ähnlich wie Nitrogen Transformations in Aquaponic Systems
Ähnlich wie Nitrogen Transformations in Aquaponic Systems (20)
Mehr von National Institute of Food and Agriculture
Mehr von National Institute of Food and Agriculture (20)
Kürzlich hochgeladen
Kürzlich hochgeladen (20)
Nitrogen Transformations in Aquaponic Systems
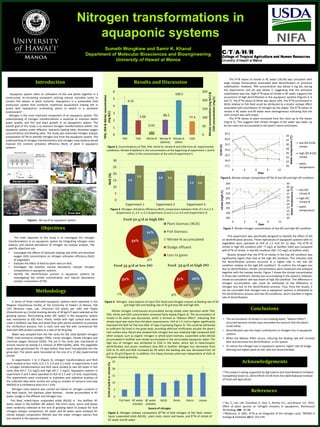
- 1. Nitrogen transformations in aquaponic systems Introduction Aquaponic system refers to cultivation of fish and plants together in a constructed, re-circulating ecosystem utilizing natural microbial cycles to convert fish wastes to plant nutrients. Aquaponics is a sustainable food production system that combines traditional aquaculture (raising fish in tanks) with hydroponics (cultivating plants in water) in a symbiotic environment1. Nitrogen is the most important component of an aquaponic system. The understanding of nitrogen transformations is essential to maintain better water quality, and fish and plant growth in an aquaponics system. The overall goal of this study is to examine nitrogen transformations within the aquaponic system under different hydraulic loading rates, dissolved oxygen concentrations and feeding rates. The study also examined nitrogen isotopic composition (δ15N) to identify nitrogen loss from the aquaponic system. The understanding of nitrogen transformations and nitrogen mass balance would improve the nutrient utilization efficiency (NUE) of plant in aquaponic systems. Objectives The main objective of this study is to investigate the nitrogen transformations in an aquaponic system by integrating nitrogen mass balance and natural abundance of nitrogen via isotope analysis. The specific objectives are: • Investigate the effects of hydraulic loading rate (HLR) and dissolved oxygen (DO) concentration on nitrogen utilization efficiency (NUE) of vegetables. • Evaluate the effect of feed-to-plant ratio on NUE. • Investigate the baseline natural abundance isotopic nitrogen compositions in aquaponic systems. • Identify the denitrification process in aquaponic systems by investigating the nitrate concentration and natural abundance isotopic composition (δ15N). Methodology Figure1. Set-up of an aquaponic system Results and Discussion A series of three replicated aquaponic systems were operated in the Magoon Greenhouse Facility at the University of Hawai’i at Manoa. Pak choi (Brassica rapa, sub. chinensis) (24 plants per raft) and tilapia (Oreochromis sp.) (initial stocking density of 30 kg/m3) were selected as the growing species. Recirculating water (RC water) in the aquaponic system was maintained at 650 liters. Plastic media with high surface area were used in biofilters (up-flow and down-flow with partial aeration) to promote the nitrification process. Fish in each tank was fed with commercial fish feed with 40% protein content at a rate of 35-50 g/day. Water was sampled from the fish tanks for DO, total Kjeldahl nitrogen (TKN), total ammonia nitrogen (TAN), nitrite nitrogen, nitrate nitrogen and chemical oxygen demand (COD). The pH in the tanks was maintained at around neutral by dosing 2:1 mixture of KOH:Ca(OH)2 daily. The vegetable seeds were germinated for 14 days before they were transplanted into the grow bed. The plants were harvested at the end of a 37-day experimental period. In experiments 1 to 3 (Figure 3), nitrogen transformations and NUE were studied at four HLRs (1.0, 1.5, 2.0 and 2.5 m/d). In experiments 4 and 5, nitrogen transformations and NUE were studied at two DO levels in fish tanks (low DO (~ 3.5 mg/L) and high DO (~ 7 mg/L). Aquaponic systems in experiment 4 and 5 were operated at HLR of 1.5 and 1.0 m/d, respectively. The experiments were conducted in triplicates and statistical analyses of the collected data were carried out using an analysis of variance (one-way ANOVA) at a confidence level of α = 0.05. Nitrogen mass balance was carried out based on nitrogen contents in fish feed (input), fish biomass, plant biomass , nitrate accumulated in RC water, sludge in the effluent and nitrogen loss. Fish feed, mixed-liquor suspended solids (MLSS) in the biofilter, RC water, water in the biofilter (BF water), Pak choi’s roots, stems and leaves were randomly collected at the end of growing batch to analyze for bulk nitrogen isotopic composition. RC water and BF water were analyzed for nitrate isotopic composition (Nitrate was the major nitrogen species that was present in the aqueous phase). Conclusions Acknowledgements References Sumeth Wongkiew and Samir K. Khanal Department of Molecular Biosciences and Bioengineering University of Hawaii at Manoa • This project is being supported by Agriculture and Food Research Initiative Competitive Grant no. 2013-67019-21376 from the USDA National Institute of Food and Agriculture. • 1Hu, Z., Lee, J.W., Chandran, K., Kim, S., Brotto, A.C., and Khanal S.K. 2015. Effect of plant species on nitrogen recovery in aquaponics. Bioresource Technology 188: 92-98. • 2Robinson, D. 2001. δ15N as an integrator of the nitrogen cycle. TRENDS in Ecology & Evolution 16(3): 153-159. 26% 16% 19%7% 32% Feed 35 g/d at low DO 26% 16% 18%9% 31% Feed 35 g/d at high DO 21% 12% 10% 5% 52% Feed 50 g/d at high DO Plant biomass (NUE) Fish biomass Nitrate-N accumulated Sludge effluent Loss to gases 0 5 10 15 20 25 30 Experiment 1 Experiment 2 Experiment 3 NUE(%) 20 21 22 23 24 25 26 27 28 29 30 185 190 195 200 205 210 215 220 0 3 6 9 12 Watertemperature(°C) nitrate(mgN/L) Days low DO- nitrate N high DO- nitrate N water temperature This experiment was specifically designed to identify the effect of DO on denitrification process. Three replications of aquaponic systems with no vegetables were operated at HLR of 1.5 m/d for 12 days. The δ15N of nitrate in high DO condition (DO ~7 mg/L at biofilter inlet) was compared with δ15N of nitrate in low DO condition (DO ~3.5 mg/L at biofilter inlet). Results showed that the δ15N of nitrate in the low DO condition was significantly higher than that at the high DO condition. This indicates that the denitrification process occurred at a higher rate in the low DO condition relative to the high DO condition2. To confirm the nitrogen loss due to denitrification, nitrate concentrations were measured and analyzed together with the isotope results. Figure 7 shows the nitrate concentration in these two conditions. Nitrate was accumulating in the systems; however, nitrate accumulation rate was faster at high DO condition. The difference in nitrogen accumulation rate could be attributed to the difference in nitrogen loss due to the denitrification process. Thus, from the results, it can be concluded that nitrogen loss in aquaponic systems is attributed to the denitrification process and low DO conditions, which resulted in higher rate of denitrification. The δ15N values of nitrate in RC water (18.3%) was consistent with large isotope fractionation associated with denitrification or ammonia volatilization. However, TAN concentration was below 4 mg N/L during the experiments and pH was below 7, suggesting that the ammonia volatilization was low. High δ15N value of nitrate in RC water supports the occurrence of high denitrification in the aquaponic systems (Figures 5, 6 and 7). The δ15N values of MLSS was about 10%. The δ15N enrichment in MLSS relative to fish feed could be attributed to a kinetic isotope effect associated with assimilation of nitrogen by the tilapia. The δ15N values of nitrate in RC water and BF water were homogeneous indicating that the tank content was well mixed. The δ15N values of plant increased from the roots up to the leaves (Figure 5). This suggests that nitrate nitrogen in the water was taken up by the roots and accumulated in the plant’s stems and leaves. 4.15 2.00 0.43 86.5 199.5 77.4 0 50 100 150 200 250 0 1 2 3 4 5 6 TKN TAN Nitrite N Nitrate N (before) Nitrate N (after) COD Nitrateconcentration(mgN/L)& CODconcentration(mg/L) TKN,TAN&Nitriteconcentration (mgN/L) Figure 5. Nitrogen isotopic composition (δ15N) of bulk nitrogen of fish feed, mixed- liquor suspended solids (MLSS), plant roots, stems and leaves, and δ15N of nitrate of RC water and BF water 1.0 1.5 2.0 2.5 1.5 2.0 Figure 6. Nitrate isotopic composition (δ15N) of low DO and high DO condition Figure 7. Nitrate nitrogen concentration of low DO and high DO condition Figure 2. Concentrations of TKN, TAN, nitrite N, nitrate N and COD from all experimental conditions. Nitrate N (before) is the concentration at the beginning of experiment 1 and N (after) is the concentration at the end of experiment 5. Figure 3. Nitrogen utilization efficiency (NUE) comparisons between HLRs of 1.0 vs 1.5 (Experiment 1), 2.0 vs 2.5 (Experiment 2) and 1.5 vs 2.0 m/d (Experiment 3) Figure 4. Nitrogen mass balance of input (fish feed) and nitrogen outputs at feeding rate of 50 g/d (high DO) and feeding rate of 35 g/d (low DO and high DO) Fish tank Grow bed Aquaponic system Biofilter 20 22 24 26 28 30 32 34 17.5 18.0 18.5 19.0 19.5 20.0 20.5 0 3 6 9 12 Watertemperature(°C) δ15N(%) Days low DO-δ15N nitrate high DO-δ15N nitrate water temperature • The accumulation of nitrate in recirculating water, “Balloon Effect”, occurred because nitrate input exceeded the amount that the plants could utilize. • Denitrification was the major contribution to nitrogen loss in aquaponic systems. • When the Balloon Effect occurs, reducing the feeding rate will increase NUE and decrease the denitrification in the system. • To reduce the nitrogen loss in aquaponic systems, higher rate of sludge draining and higher plant-to-fish ratio are recommended. Nitrate nitrogen continuously accumulated during steady state operation while TKN, TAN, nitrite and COD concentration remained fairly steady (Figure 2). The accumulation of nitrate in RC water was discovered, which is termed as “Balloon Effect”, indicating that nitrate input was more than the plant requirements. HLR of 1.5 m/d or higher significantly improved the NUE for Pak choi after 37 days of growing (Figure 3). This could be attributed to sufficient DO level in the grow beds; providing effective nitrification around the plant’s root surface area. Result also showed that nitrogen loss was relatively high compared with other outputs such as organic nitrogen in whole plant biomass, suspended solids (MLSS) accumulated in biofilter and nitrate accumulated in the recirculated aquaponic water. The high loss of nitrogen was attributed to COD in the water, which led to heterotrophic denitrification and anoxic conditions (low DO) in biofilter. Nitrogen loss decreased from 52% to 31-32% and NUE increased by 5% when the feeding rate was decreased from 50 g/d to 35 g/d (Figure 4). In addition, the tilapia biomass yield was independent of HLRs at the given stocking density. 0 5 10 15 20 25 Fish feed RC water (nitrate) BF water (nitrate) MLSS Roots Stems Leaves δ15NofbulkNornitrate(%) Source of nitrogen