Large Runoff Flux And Transformation of Particulate Nitrogen (Pn) Following Large Storms: A Critical But Unexplored Component Of N Cycling
•
0 gefällt mir•827 views

Empfohlen

Empfohlen
Weitere ähnliche Inhalte
Was ist angesagt?
Was ist angesagt? (20)
Andere mochten auch
Andere mochten auch (14)
Ähnlich wie Large Runoff Flux And Transformation of Particulate Nitrogen (Pn) Following Large Storms: A Critical But Unexplored Component Of N Cycling
Ähnlich wie Large Runoff Flux And Transformation of Particulate Nitrogen (Pn) Following Large Storms: A Critical But Unexplored Component Of N Cycling (20)
Mehr von National Institute of Food and Agriculture
Mehr von National Institute of Food and Agriculture (20)
Kürzlich hochgeladen
Kürzlich hochgeladen (20)
Large Runoff Flux And Transformation of Particulate Nitrogen (Pn) Following Large Storms: A Critical But Unexplored Component Of N Cycling
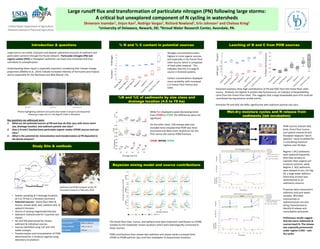
- 1. Large runoff flux and transformation of particulate nitrogen (PN) following large storms: A critical but unexplored component of N cycling in watersheds Shreeram Inamdar1, Jinjun Kan2, Rodrigo Vargas1, Richard Rowland1, Erin Johnson1 and Chelsea Krieg1 1University of Delaware, Newark, DE; 2Stroud Water Research Center, Avondale, PA. Study Site & methods Introduction & questions Baseflow Receding FlowStormflow Large storms can erode, transport and deposit substantial amounts of sediment and particulate nutrients through the fluvial network. Particulate nitrogen (PN) and organic carbon (POC) in floodplain sediments can leach and mineralize and thus contribute to eutrophication. Understanding these inputs is especially important considering that climate-change projections (Melillo et al., 2014) indicate increased intensity of hurricanes and tropical storms (especially for the Northeast and Mid-Atlantic US). Key questions we addressed were: 1. What are the potential sources of PN and how do they vary with storm event size, drainage location, and sediment particle size class? 2. How is N and C leached from particulate organic matter (POM) sources and size class? 3. What is the potential for mineralization and transformation of PN deposited in the fluvial network? Photos highlighting sediment and particulate matter transport and deposition following a large storm in the Big Elk Creek in Maryland Sediment Size Fractions Coarse (CPOM) 2000 µm-1000 µm Medium (MPOM) 1000 µm-250 µm Fine (FPOM) <250 µm • Stream sampling at 5 drainage locations (4.5 to 79 ha) in a forested catchment • Potential sources – forest floor litter & humus, stream bank, bed, wetland soils, & upland A horizons • Storms of varying magnitude/intensity • Sediment characterized for 3 particle size classes • %C and %N determined for stream sediment & individual sources • Sources identified using 13C and 15N stable isotopes • Transformation and mineralization of POM determined for 2 moisture regimes using laboratory incubations Sediment and POM transport at the 79 ha stream location in February, 2016 % N and % C content in potential sources %Carbon%Nitrogen Nitrogen concentrations were highest in more organic sources, and especially in the Forest Floor Litter source, which is composed of fresh plant material. This indicates that this is a large N source in forested systems. Carbon concentrations displayed more variability, with increased C in Forest Floor Humus and Litter. Leaching of N and C from POM sources %Protein-likeFluorescence DOC(ppm)TN(ppm) Extracted solutions show high contributions of TN and DOC from the Forest Floor Litter source. Similarly, the highest % protein-like fluorescence, an indicator of bioavailability, came from the Forest Floor litter. This suggests that a large bioavailable pool of N could be contributed during extreme rainfall events. Extracted TN and DOC did differ significantly with sediment particle size class. Wet-dry moisture cycles and N release from sediments (lab incubation) POM sources (stream bed, bank, forest floor humus, and upland mineral A) and floodplain deposits “storm deposits” were incubated for 2 contrasting moisture regimes over 60 days. Regime 1 (R1) sediments were watered frequently (thin blue arrows) to maintain their original soil moisture contents, while Regime 2 (R2) sediments were allowed to dry. On Day 26, a large water addition (thick blue arrows) was administered to all sediments columns. N species were measured in sediment and pore water samples. Microbial communities in sediments/soils are also being characterized to identify N release and consumption processes. Preliminary results suggest that the storm sediments & sources leach N. The release was especially pronounced under regime 2 (R2) – wet- dry cycles. %N and %C of sediments by size class and drainage location (4.5 to 79 ha) CPOM, MPOM, FPOM Drainage area (ha) While % C displayed a weak decreasing trend from CPOM to FPOM, the differences were not significant. On the other hand, 15N isotope data (not included here) revealed that POM was more processed and likely more recalcitrant for the finer versus the coarser POM fractions. Bayesian mixing model and source contributions The forest floor litter, humus, and wetland soils were important contributors to CPOM, notably for the headwater stream locations which were hydrologically connected to these sources. POM contributions from stream bed sediment and stream banks increased from CPOM to FPOM particle class and from headwater to downstream locations.