Integrating Soil Carbon Stabilization Concepts and Nitrogen Cycling
•
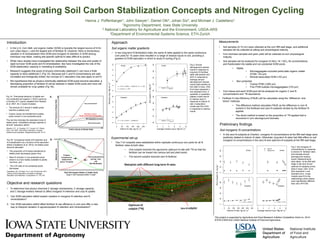
0 gefällt mir•873 views

Micheal Castellano
Empfohlen

Empfohlen
Weitere ähnliche Inhalte
Was ist angesagt?
Was ist angesagt? (20)
Andere mochten auch
Andere mochten auch (20)
Ähnlich wie Integrating Soil Carbon Stabilization Concepts and Nitrogen Cycling
Ähnlich wie Integrating Soil Carbon Stabilization Concepts and Nitrogen Cycling (20)
Mehr von National Institute of Food and Agriculture
Mehr von National Institute of Food and Agriculture (20)
Kürzlich hochgeladen
Kürzlich hochgeladen (20)
Integrating Soil Carbon Stabilization Concepts and Nitrogen Cycling
- 1. Introduction • In the U.S. Corn Belt, soil organic matter (SOM) is typically the largest source of N for corn (Zea mays L.) and the largest sink of fertilizer N. However, there is tremendous variation in N mineralization from SOM and inorganic N retention in SOM among individual crop fields, making site-specific optimal N rates difficult to predict. • While many studies have investigated the relationship between the size and quality of rapid turnover SOM pools and N mineralization, few have investigated the role of the SOM stabilization capacity in mediating N availability. • Research suggests that pools of physico-chemically stabilized C can have a finite capacity to store additional C (Fig 1A). Because soil C and N concentrations are well- correlated and biologically-linked, the concept of C saturation may also apply to soil N. • We hypothesize that as physico-chemically stabilized SOM pools become saturated, a decreasing proportion of fertilizer N will be retained in stable SOM pools and more will remain available for crop uptake (Fig 1B). Integrating Soil Carbon Stabilization Concepts and Nitrogen Cycling Hanna J. Poffenbarger1, John Sawyer1, Daniel Olk2, Johan Six3, and Michael J. Castellano1 1Agronomy Department, Iowa State University 2 National Laboratory for Agriculture and the Environment, USDA-ARS 3Department of Environmental Systems Science, ETH-Zurich Fig 1A. Theoretical behavior of stable and non-protected soil organic C (SOC) pools as a function of C inputs; adapted from Stewart et al. 2007. As C inputs increase: • The amount of C stored in stable pools reaches a plateau and • Carbon inputs not transferred to stable pools remain in non-protected pools. The red line indicates the saturation level of stable pools. Unsatisfied storage capacity is termed “saturation deficit”. Fig 1B. Conceptual model of N retention and N mineralization as a function of the saturation deficit (Castellano et al. 2012). As stable pools become saturated: • The proportion of N inputs transferred to stable pools decreases (green line), • More N remains in non-protected pools where it is more readily available to plants (red line), and • The C/N ratio of non-protected pools decreases Experimental set-up • Two 7-m2 subplots were established within replicate continuous corn plots for all N fertilizer rates at both sites. • One subplot received the agronomic optimum N rate with 15N so that the fertilizer can be traced into various soil and plant pools. • The second subplot received zero N fertilizer. Approach Soil organic matter gradients • In two long-term N fertilization trials, the same N rates applied to the same continuous corn plots for 15 years have resulted in a range of residue inputs to soil, providing a gradient of SOM saturation in which to study N cycling (Fig 2). Objective and research questions • To determine how phyico-chemical C storage mechanisms, C storage capacity, and C storage kinetics interact to affect inorganic N retention and crop N uptake. 1. Can SOM saturation deficit explain variation in inorganic N retention and N mineralization? 2. Can SOM saturation deficit affect fertilizer N use efficiency in corn and offer a new way to interpret variation in agroecosystem N retention and mineralization? Fig 2. Annual aboveground residue inputs in response to long-term N fertilizer rates (left panels) and SOC in response to average annual aboveground residue inputs (right panels) at two sites in Iowa, USA. Error bars represent ± one standard error. A quadratic or quadratic- plateau model was fit to residue input in response to historic N rate. A saturation model was fit to SOC in response to residue inputs. Castellano, MJ, JP Kaye, H Lin, and JP Schmidt. 2011. Linking Carbon Saturation Concepts to Nitrogen Saturation and Retention. Ecosystems 15: 175–187. Stewart, C.E., K. Paustian, R.T. Conant, A.F. Plante, and J. Six. 2007. Soil carbon saturation: concept, evidence and evaluation. Biogeochemistry 86: 19–31. Measurements • Soil samples (0-15 cm) were collected at the corn fifth-leaf stage, and additional samples will be collected at silking and physiological maturity. • Corn biomass samples and grain yield will be collected at corn physiological maturity. • Soil samples will be analyzed for inorganic N (NH4 +-N + NO3 --N) concentrations and fractionated into stable and non-protected SOM pools: • Stable • Microaggregate-occluded particulate organic matter (POM; >53 µm) • Mineral-associated SOM (<53 µm) • Non-protected • Coarse POM (>250 µm) • Fine POM outside microaggregates (>53 µm) • Corn tissue and each SOM pool will be analyzed for organic C and N concentrations and 15N abundance. • Fertilizer N Use Efficiency (FNUE) will be calculated using the “difference” and “direct” methods. • The difference method calculates FNUE as the difference in corn N content in the fertilized and zero-N subplots divided by the fertilizer N applied. • The direct method is based on the proportion of 15N applied that is recovered in corn aboveground biomass. This project is supported by Agriculture and Food Research Initiative Competitive Grant no. 2014- 67019-21629 from USDA National Institute of Food and Agriculture. Preliminary findings Soil inorganic N concentrations • In the zero-N subplots at Chariton, inorganic N concentrations at the fifth-leaf stage were positively related to historic N rates. Otherwise, long-term N rates had little effect on soil inorganic N concentrations in the zero-N and optimum-N subplots at the fifth-leaf stage. Fig 3. Soil inorganic N concentrations in response to historic N fertilizer rates and average annual aboveground residue inputs. Measurements were taken at the fifth-leaf stage in the zero-N and optimum-N subplots at two sites in Iowa, USA. Error bars represent ± one standard error. Linear models were fit to the relationships when slopes were significantly different than zero (P<0.05). 0% 100% Total Soil Organic Matter in Stable Pools (large ← Soil C Saturation Deficit → small) N Inputs Transferred to Stable Pools (g N g-1 N inputs) Non-protected Pool (g N kg-1 soil) and Net Nitrification RelativeUnits B. A. 𝑦 = 3.63 + 0.058𝑥 − 0.00014𝑥2 𝑖𝑓 𝑥 < 183 𝑦 = 9.69 𝑖𝑓 𝑥 > 183 𝑦 = 1.78 + 0.034𝑥 − 0.000043𝑥2 𝑦 = 𝑥 0.020 + ( 𝑥 48.49) 𝑦 = 𝑥 0.0041 + ( 𝑥 43.16) 𝑦 = 11.85 + 0.018𝑥 𝑦 = 10.50 + 0.73𝑥