AIr quality and urban mobility challenges, Chandigarh
•
2 gefällt mir•2,275 views

City dialogue on Clean air and sustainable mobility, a half day workshop conducted in Chandigarh in partnership with Chandigarh Administration on 24th May 2013. The presentation shows the CSE findings and citizen perception survey.

Empfohlen
Empfohlen
Weitere ähnliche Inhalte
Was ist angesagt?
Was ist angesagt? (20)
Andere mochten auch
Andere mochten auch (16)
Ähnlich wie AIr quality and urban mobility challenges, Chandigarh
Ähnlich wie AIr quality and urban mobility challenges, Chandigarh (20)
Kürzlich hochgeladen
Kürzlich hochgeladen (20)
AIr quality and urban mobility challenges, Chandigarh
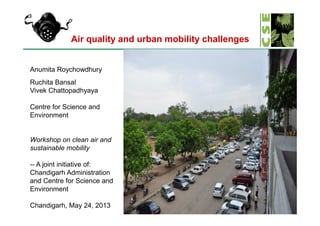
- 1. Air quality and urban mobility challenges Anumita Roychowdhury Ruchita Bansal Vivek Chattopadhyaya Centre for Science and Environment 1 Environment Workshop on clean air and sustainable mobility -- A joint initiative of: Chandigarh Administration and Centre for Science and Environment Chandigarh, May 24, 2013
- 2. 2 The shocker this year……………
- 3. December 2012: Global Burden of Disease estimated by 450 scientists from 300 global organisations including WHO found -- Air pollution related deaths have increased by 300 per cent since 2000. About 65 per cent of these deaths occur in Asia. Air pollution is among the top 10 killers in the world Global Burden of disease: High impacts in India………………. Air pollution is among the top 10 killers in the world Two-thirds of the death burden in developing Asia. South Asia most vulnerable…………. February 2013: GBD findings for India: 620,000 premature deaths a year. More than 18 million healthy life years lost due to air pollution. Air pollution triggers stroke, cardiovascular and respiratory diseases, cancer…..
- 4. More Indian cities in grip of pollution 4 -- PM10 monitoring increased from 96 cities in 2005 to 180 cities in 2010. -- Low polluted cities fallen from 10 to 2. -- Critically polluted cities (1.5 times the standards) increased from 49 to 89 cities. -- 2005: 75% of cities exceeded the standard. 2010: -- 78% of cities NO2 monitoring increased from 100 cities to 177 cities 2005: Only 1 city exceeded the standard. 2010: 19 cities Source: CSE based on CPCB data
- 6. Arial raids…….Smoke from Punjab hogged news this year 6 October 2012: This is NASA image of smoke plume from agricultural burning
- 7. Public campaign in Delhi 7 in Delhi
- 8. Killer breathe: Need strong preventive action……… 8 action………
- 9. Chandigarh: Air pollution rising again 9 Source: Chandigarh Dept. Of Environment
- 10. Chandigarh: Air pollution rising again 10 Source: Chandigarh Dept. Of Environment
- 11. Chandigarh: Air pollution strongly corelates with economic growth 11 Source: CSE
- 12. Where is pollution coming from? •There is no official assessment of the pollution sources in Chandigarh •Independent research studies (Georgia Tech 2004) show high concentration of tiny particles (PM2.5). They have found high share of elements from combustion sources in the overall PM2.5. •Also close to a quarter of PM 2.5 comes from petrol and diesel combustion in the city. This shows high impact of vehicles. 12 http://etd.gatech.edu/theses/available/etd-07112004- 203716/unrestricted/chowdhury_muhammed_z_200407_phd.pdf
- 13. Motorisation based on outdated technology -- Bharat Stage III 12 years behind Europe -- Bharat stage IV seven years behind Diesel car emission norm trajectory and India’s position Special problem of diesel: In June 2012 the WHO/ International Agency on Cancer Research have reclassified diesel emissions as class 1 carcinogen, -- same class as tobacco for its strong link with 13 Source: CSE compilation from European Commission, MORTH, India, Diesel Net tobacco for its strong link with lung cancer. Diesel cars are 60 per cent of the new car sales in India. Bus and trucks also use dirty diesel Cities need clean diesel (10 ppm sulphur) with advanced particulate traps
- 14. What about our health? Considerable reportage on respiratory problems due to air pollution in the region…. 14 pollution in the region…. CSE campaign Source: CSE
- 15. Most studies in India done by doctors themselves……. Maximum health studies in India have been carried out by doctors themselves About 60% studies in India have focused 15 Source: CSE on exposure to traffic pollution…specially those occupationally exposed…………
- 16. Mounting global health evidences….. Scale of studies ---- Eg. the Arden Pope study (Journal of American Medical Association 2002) based on American Cancer Society data …..16 years, about 500,000 people tracked in 116 metropolitan areas to arrive at irrefutable findings.findings. ……… a mere increase of 10 microgramme per cum of PM2.5 can increase the risk of lung cancer by 8 per cent, cardiopulmonary deaths by 6 per cent, all deaths by 4 percent. These findings are equally valid for South Asia … Our lungs are same…….
- 17. 43 No.ofstudies Studies looking at more diverse set of diseases…. Broadens from respiratory health symptoms to other health end points – cardiovascular, eye disorders, cellular changes, cancer, premature deaths…. 7 6 4 6 3 8 Effects studied No.ofstudies Respiratory Cardio Cancer Related Eye related Cytogenetic Mortality Others Source: CSE
- 18. Diabetes: First large-scale population-based study links diabetes with air pollution. Increase in insulin resistance in lab test …. and an increase in markers of inflammation (which may contribute to insulin resistance) after particulate exposure. Strong and consistent association between diabetes prevalence and PM2.5 concentrations. For every 10 µg/m3 increase in PM2.5 exposure, there was a 1 percent increase in diabetes prevalence. Counties with highest versus the lowest levels of PM2.5 pollution had a more than 20% increase in diabetes, which remained after controlling for diabetes risk factors. (Diabetes Care 2011) Heart: Acute Effects of Fine Particulate Air Pollution on Cardiac Arrhythmia:Conclusion: PM2.5 exposure Global studies …. Looking beyond lungs …… Acute Effects of Fine Particulate Air Pollution on Cardiac Arrhythmia:Conclusion: PM2.5 exposure within approximately 60 min was associated with increased PVC counts in healthy individuals. (He F et al 2011The APACR Study. Environ Health Perspect) Blood pressure Traffic-related Air Pollution and Blood Pressure in Elderly Subjects With Coronary Artery Disease: Found positive associations of systolic and diastolic BP with air pollutants. The strongest associations were with organic carbon, multiday average exposures, ect. (Delfino, Ralph J.a et al 2010,, Epidemiology, May 2010) Effect on foetus: Studies have shown damaging impact of PAH on even fetus Source: CSE
- 19. 19 Vehicles are a special problem…
- 20. Vehicles: special concern • Vehicular emissions contribute to significant human exposure. Pollution concentration in our breathe is 3-4 times higher than the ambient air concentration. • In three cities World Bank review found vehicles contributing an average 50% of the direct PM emissions and 70% of PM exposure. • The WHO report of 2005: Epidemiological 20 • The WHO report of 2005: Epidemiological evidences for the adverse health effects of exposure to transport related air pollution is increasing. • Public transport users, walkers and cyclists are the most exposed groups. • Poor have a higher prevalence of some underlying diseases related to air pollution and proximity to roadways increases the potential health effects.
- 21. People living close to roads are most exposed to vehicular fume Evidence from Delhi…. Given the large number of people living within 300- 500 21 living within 300- 500 meters of a major road, the Panel concluded that exposures to primary traffic generated pollutants are likely to be of public health concern and deserve attention. Source: Health Effect Institute
- 22. Lessons from first generation action in 22 Lessons from first generation action in Delhi………
- 23. Delhi has fought hard to get breathing space On vehicles Introduced low sulphur fuels and petrol with 1 per cent benzene Mandated pre-mix petrol to two- and three-wheelers Moved from Euro I to Euro IV over the last decade Implemented largest ever CNG based public transport programme Capped the number of three-wheelers Phased out 15 year old commercial vehicles First generation reforms in Delhi….. 23 Phased out 15 year old commercial vehicles Strengthened vehicle inspection programme (PUC) Efforts made to divert transit traffic Set up independent fuel testing laboratories to check fuel adulteration On industry Relocated polluting units Tighter controls on power plants. No new power plants. Air quality monitoring Adopted new ambient air quality standards Expanded air quality monitoring and reporting Other sources Emissions standards for generator sets Ban on open burning of biomass
- 24. Delhi got cleaner air: it avoided pollution PM10 at ITO Traffic Intersection 500 600 Microgrammepercubicmetre PM10 trend projection pre Supreme Court directions PM10 trend March 98- Dec 05, Post Supreme Court directions 24 0 100 200 300 400 Microgrammepercubicmetre Source: CSE
- 25. Delhi has lost its gains. After a short respite pollution curve turns upward PM10 levelsPM10 levels Nitrogen dioxide levelsNitrogen dioxide levels 25 Source: CSE Based on CPCB data
- 26. Energy guzzling and climate concern in India Cars threaten energy security and climate Future CO2 increase from transport will be dominated by cars and trucks. (IEA) 26 Transport energy demand grown at 1.2 times the GDP growth rate. Transport sector use 40% of total oil consumption. Fuel consumption by vehicles in 2035 could be six times that of the 2005 level. Urban car travel consumes nearly twice as energy on average as average urban bus travel Shift of freight from railways to trucks: Share of railways down to 26%. Transport energy demand in India would grow even faster if all highways planned are constructed. (WEO 2006)
- 27. Chandigarh ranks high in per capita transport CO2 emissions • A study of 46 Indian cities that assessed urban structure, travel pattern and transport emission for different city classes found category 3 cities with population ranging from 10 Lakh to 20 Lakh cause maximum per capita transport CO2 emissions • Among all category-3 cities, Chandigarh witnesses maximum transport emissions/capita. Urban structure has a strong influence. 27 Source: http://www.urbanmobilityindia.in/Upload/Conference/207ec6ee-4b67-4791-bf3a-4be42acee01c.pdf
- 28. 28 Second generation action: Technology challenge………….
- 29. Is affluence a barrier or an opportunity? Chandigarh: Among the wealthiest in India and China 29Source: Regional Growth, Disparity and Convergence in China and India: A Comparative Study Yanrui Wu School of Economics and Commerce University of Western Australia Australia
- 30. Less roads than Delhi. But higher vehicle density Can hit saturation sooner •Chandigarh has 441,284 vehicles per 1000 km of road length. Delhi has 243,783 vehicles per 1000 km of road length. 30 Source: CSE Based on MOSPI data
- 31. Chandigarh: Very high vehicle ownership Number of vehicles per 1000 people If two- wheelers and cars are included then 31 Chandigarh has 878 personal vehicles/1000 people vs 362 personal vehicles /1000people in Delhi. Source: CSE
- 32. -- 43 per cent own cars in Chandigarh vs close to 20 per cent in Delhi -- Multiple ownership of cars and Chandigarh: More households own cars than Delhi 32 two wheelers increasing -- There is still a challenge of equity: Design mobility strategies for urban majority Source: CSE Based on CMP data
- 33. City designed for speed. Compromise safety Distribution of Peak/Off- Peak Hour Journey Speed Distribution of Peak/Off- Peak Hour Running Speed 33 •In absolute numbers the total number of road accidents is much higher in Delhi (7260) than Chandigarh (456). But for comparable road length road accidents in Chandigarh are close to Delhi -- 201 road accidents per 1000 km of road length in Chandigarh vs and 245 in Delhi. Source: CSE Based on CMP data
- 34. Strength of our citiesStrength of our cities…….. 34Source G Tiwari, TRIP, 2010
- 35. Different trend in Chandigarh: High dependency on personal vehicles Modal share in Chandigarh (without walk trips Nearly 73% of travel trips carried by personal transport – cars and two- 35 Source: CMP cars and two- wheelers
- 36. How people feel about the emerging challenges CSE’s rapid survey to understand people’s perception of air pollution and mobility problems in Chandigarh. The preliminary results capture the mood…. • About 30% say air pollution is worsening. About 15% feel incidences of respiratory diseases are rising. • More than 60% have complained of increased delays during peak hours • About 30-40% percent are in favor of cycle and cycle rickshaw infrastructure. • Nearly 10-15% have rated public transport as good, 30% have rated city public 36 • Nearly 10-15% have rated public transport as good, 30% have rated city public transport services average. • About 30% rated the auto/tempo services as average but say they are important. • About one third think parking is causing encroachment of footpaths and causing congestion • Nearly half -- 50%, think government should make efforts to reduce dependence on personal vehicles. • Around 90% want more action to increase public transport and non motorised infrastructure. • Nearly 20% find the cycling infrastructure well maintained, clean and usable only in some areas of the city
- 37. 37 Beginning of second generation action
- 38. City Mobility Plan charts the way forward Scale up and modernise public transport -- Provision of high capacity mass transport corridors and integration with other modes of transport -- Medium level mass transport system -- BRT beyond the Metro network -- Rationalisation of local bus system and its augmentation. -- Improvement in traffic management through TSM measures. Address urban planning and design Chandigarh charting a roadmap………… 38 Address urban planning and design -- Landuse adjustments and densification of corridors along mass transport corridors where possible; Commuter rail system -- Special facilities for pedestrians within the entire network specially in the core areas -- Pedestrian subways, footpaths and road furniture along the roads Commercial traffic -- Diverting through traffic on bypasses, providing transport hubs at the periphery -- Improving primary, arterial and other important roads (particularly radial and ring roads) by providing grade separation in the form of underpasses, junction Inform this process from the experience in other cities………. Source: CMP
- 39. - Can we set targets for public transport modal share? - Delhi Master Plan targets 80% public transport share by 2020; Pune 80% by 2020; Kolkata 90% by 2020................. 39 - Chandigarh needs a target too. Travel trips are expected to nearly double in the coming decades in Chandigarh. What share of this should be on public transport? - Learn from Delhi: Travel trips to increase from 15 million a day today to 28 million by 2020. But disproportionate focus on road building is reducing share of public transport ridership……….
- 40. Roads hitting dead end in DelhiRoads hitting dead end in Delhi Roads expansion cannot keep pace with rising number of vehicles. Delhi has built 65 flyovers…….Yet congestion is getting worse by the day 20000 25000 30000 35000 Roadlengthinkms 8 10 12 14 Roadlengthper1000vehicles 40 0 5000 10000 15000 1971-72. 1980-81. 1990-91. 1993-94. 1994-95. 1995-96. 1996-97. 1997-98. 1998-99. 1999-00. 2000-01. 2001-02. 2002-03. 2003-04. 2004-05. 2005-06. Roadlengthinkms 0 2 4 6 Roadlengthper1000vehicles Road length in kms Road length per 1000 vehicles Source: CSE based on data from Economic Survey, Delhi Govt
- 41. Reality check in DelhiReality check in Delhi Public transport losing groundPublic transport losing ground In Chandigarh buses meet onlyIn Chandigarh buses meet only 16 per cent of the travel demand16 per cent of the travel demand 41 Source: Anon 2008, transport demand forecast study: study and development of an integrated cum multi modal public transport network for NCT of Delhi, RITES, MVA Asia Ltd, TERI, September
- 42. Need big transition……………. Delhi Bus fleet requires massive renewal and modernization Delhi has initiated a massive renewal process New buses to meet the urban bus specifications of the Ministry of Urban Development. 42 Need credible, reliable and quality bus service Improvement in service level of bus service -- Technical planning for route reorganisation, frequency, reliability, coverage, reliable information, ITS enabled passenger information service, improvement in ticketing system, bus priority, signaling, GPS enabled deployment strategy, Performance monitoring system, Innovative contracting and tendering, among others.
- 43. Change in Delhi………… Average number of buses on road, 2002-03 to 2011-12, DTC Revival of bus numbers: Average number of buses augmented to 5892 in 2011-12. …. Revival of ridership: Within a span of one year -- 2010 - 2011, the ridership of DTC has increased by 25%. The turn around happened when it 43 turn around happened when it increased to 2.4 million in 2009-10 and hit 3.0 million in 2010-11. Revival of earnings: DTC earnings show major gains. During 2005-06 this was Rs 279 crores. This has increased three times to Rs794 Crore in 2010-11. Yet long way to go…. Source: CSE based on DTC stats and op data
- 44. 85 90 95 100 %fleetuse % fleet use Fleet utilisation: % fleet use Bus in Chandigarh: A paradox: Efficient yet deficient Chandigarh bus transport corporation is the most efficient compared to other bus transport corporation -- 95 per cent of its fleet is utilised -- Carries at least 90 per cent of its passenger carrying capacity But scale of its operation is very small. 44 70 75 80 Delhi Chandigarh %fleetuse City % fleet use Load factor (%) 0 10 20 30 40 50 60 70 80 90 100 Delhi Chandigarh %loadfactor City % load factor Bus numbers stagnating around 400 Bus purchase and deliveries getting delayed Shortage of staff. Not enough conductors and drivers. Affecting bus operations Old fleet requires replacement
- 45. Buses: burden of costs Spare parts, tyres, tube s, batteries 5% Taxes 8% Interest Payments 1% Depreciation 4% 45 Personnel costs 54% Fuel costs 28%
- 46. Fuel cost is a serious barrier Recent diesel price hike for buses staggering and mindless. For cars its pittance Diesel cost is about a quarter of the total cost This will push up demand for bus fares. But that will erode bus ridership…. Minimum bus fares are Rs 5-7. The running cost of a two wheeler is Re 1 to 46 Source: CSE - based on data from Operational Statistics 5-7. The running cost of a two wheeler is Re 1 to Rs 2 per km High costs can compromise quality of bus services Need fiscal measures to reduce the costs of bus operations. Reduce fuel costs for buses and rationalise other taxes
- 47. Fuel economy of buses worsening Fuel economy performance of the bus fleet in Bangalore Figure: HSD KMPL Figure: KMPL comparison of Leyland and Tata BS-I vehicles 47Need fuel economy standards for buses Source: BMTC
- 48. -- Improve overall economic efficiency of bus transport -- Reduce tax burden on buses -- Waive off interest payment that is weighing down DTC -- Rationalise budgetary allocation in the transport sector. A lot money tied to signal free roads and flyovers that impede bus routes can be ploughed into bus transport. This will release enormous amount of money. -- Reform rates and policy of some key revenue heads like advertisement, parking, and vehicle taxation to be able to tap substantial amount of Need funding strategy for public transport 48 advertisement, parking, and vehicle taxation to be able to tap substantial amount of earnings from them. -- Mandate bus companies to undertake commercial development in their depots and terminals -- Apply travel demand management measures to increase taxes on personal vehicles. Use the additional revenue for public transport. -- Explore best practice model in other cities -- like tax on wage bill, station naming, fuel surcharge, congestion tax etc, TDM measures to generate revenue, and increase bus ridership -- All future bus agreement and contracts must be based on high quality service level guarantee We cannot afford to miss the bus………….
- 49. Rationalise taxes on transport Buses bear significantly higher tax burden in India than cars and two-wheelers... 2,90,431 5.69 2.39 150000 200000 250000 300000 350000 3 4 5 6 Tax per Chandigarh: The one time registration tax that cars costing upto Rs 6 lakhs pay works out to be Rs.533.33-Rs.800 49 30,521 2,725 0.44 0 50000 100000 150000 Two wheeler Cars Bus 0 1 2 Total annual tax per vehicle Total tax per vehicle-km Tax per vehicle-km Annual tax pay works out to be Rs.533.33-Rs.800 per year. But bus pays Rs.4,200 a year. This needs to be reversed to reduce the overall cost of bus operations and make it viable. Buses must not be penalised for meeting their intended objectives -- carry more people
- 50. 50 Improve people carrying capacity of roads………
- 51. 0% 20% 40% 60% 80% 100% NH-21 Outside Dera Bassi (Ambala road) NH-64 Near Zirakpur (Patiala Road) Sarhind Road NH-21 (Outside Kharar) Near Chandigarh Out Side Khuda Composition of traffic Slow moving vehicle Goods vehicles Bus Auto Two-wheelers Car/Jeep More cars can reduce people carrying capacity of the road………………. 51 (Ambala road) (Patiala Road) Side Khuda Lohra Car/Jeep 0% 20% 40% 60% 80% 100% NH-21 Outside Dera Bassi (Ambala road) NH-64 Near Zirakpur (Patiala Road) Sarhind Road NH-21 (Outside Kharar) Near Chandigarh Out Side Khuda Lohra Daily passenger trips Mini Bus Bus Auto Two-wheelers Car/Jeep
- 52. The Transition………Reallocation of road space. More space to low carbon and clean modes and majority commuters Distribution of Vehicles - By Mode 52 Delhi Bus Corridor 2% 23% 75% Motor Vehicles Buses Cycle & Cycle Rkshw Distribution of People - By Mode 55% 33% 11% Motor Vehicles Buses Cycle & Cycle Rkshw Moving vehicles vs. moving people
- 53. Delhi is developing guidelines for modal interchange location Design for integration of modes Delhi-- UTTIPEC/DDA guidelines Bus stop, cycle rental: within 50 meter level walk from station exit Cycle and two wheeler parking :within 100 meter level walk from station exit Auto rickshaw stand: within 150 meter level walk from station exit Private car/taxi/auto rickshaw “drop off”: 53 Private car/taxi/auto rickshaw “drop off”: with barrier-free of exiting pedestrians and NMT Pedestrian exits, bus-stops and Cycle-rickshaw stands must be closest to main pedestrian exits from station. Car parking if provided, must be BEYOND 250 M distance of Station/ or PT interchange point Pairing of Origin-Destination (O-D) Nodes: Provide cycle/ auto stands at nearby important destinations. Signages at both end locations. Private car parking only at Terminal Stations. Metro station/Public transport interchange point
- 54. 54 Access……………
- 55. 35 Total trips -- Chandigarh: More than half of all daily trips fall within 4 km distance. Inherent advantage of our cities: Short trip length Average trip length in Chandigarh 55 32.08 20.92 16.64 11.19 5.92 3.59 1.492.8 1.041.360.950.650.261.110 5 10 15 20 25 30 35 <=2 3--4 5--6 7--8 9--10 11--12 13--14 15--16 17--18 19--20 21--25 26--30 31--35 >=36 total trips -- More than 40 to 50 per cent of the daily trips in many Indian cities have distances less than 5 kilometers. -- These have enormous potential to convert to walking and non-motorised trips.
- 56. 4000 5000 6000 Triplength(inkms) Mode of travel based on trip length Car Two Wheeler Large number of walk and cycle trips in short distances ranges: Naturally 56 0 1000 2000 3000 4000 Triplength(inkms) Two Wheeler Auto Shared Auto Bus Cycle Cycles Rickshaw Train Walk <=2 kms 3-4 kms 5-6 kms 7-8 kms 9-10 kms
- 57. Chandigarh: More people walk and cycle than those use cars Modal Split - 2009 (Including W alk) Cycle 11% Rick 3% W alk 17% T.W . Car 15% 57 Bus 11% S. Auto 6% Auto 1% T.W . 36% Modal Split - 2009 (Excluding Walk) Bus 14% Cycle 13% Rick 3% S. Auto 7% Auto 2% T.W. 43% Car 18% 2009 Source: CSE Based on CMP data
- 58. S.no. Footpath Road length (km) Percentage (%) 1 Present 182.83 37.58 2 Absent 303.69 62.42 Total 486.52 100.00 But 62% of the road length do not have footpaths!... 58 Source: CMP and RITES Primary Surveys – 2008 – 09
- 59. Public transport cannot work without walk infrastructure… 59 Urbanity and life style: Corelation between active transportation (walking and cycling) and obesity. China – 1.8kg weight gain after and twice as likely to get obese for a Chinese who acquired a car. King County – people weigh 7 pounds less on an average in walkable neighbourhoods
- 60. We took a walk………. We looked at residential and commercial neighbourhoods and along Jan Marg to understand the •Engineering features -- continuity of sidewalks, their width, clear view, headroom provided, buffer between NMV and MV lanes, street signanges and parking spaces for cycles. •Crossings facilities traffic calming measures at the 60 •Crossings facilities traffic calming measures at the junctions, pedestrian signals, raised crossing at slip roads and designated traffic signal for NMV. •Environmental conditions -- safety, maintenance, enforcement, encroachment, concentrated lighting and amenities including gender sensitive public toilets, telephone facilities, drinking water facilities, food kiosks, dustbins, arcades, and trees. ….. To understand the way forward
- 61. A snap shot Jan Marg Jan Marg: The cycle tracks and footpaths score well on engineering features. Good environmental conditions with tree shading, adequate space for walking and cycling, proper signages. Good enforcement -- traffic police guides people using the cycle tracks and walking. But …. 61 Source: CSE
- 62. Jan Marg Poor crossing facilities Poor crossing facilities• No raised crossings on slip roads • Lacks pelican signals • Lack of traffic calming measures • Poor lighting conditions makes the track unsafe to walk or cycle in the evenings. 62 the evenings. Source: CSE
- 63. Residential Sector 22 & 26 The cycle tracks and footpaths show poor engineering features Very low usage. Surface is very uneven and difficult to negotiate. Has better environmental conditions. Thick foliage of trees provides good shade; proper signages are provided 63 proper signages are provided Source: CSE
- 64. Sector 4 and sector 22 o Footpaths are either encroached by parking or are not paved. o Engineering features do not reflect compliance with IRC guidelines. o Individual house owners have encroached on the footpath to make gardens or to park cars. No sign of safe crossings. 64 Source: CSE
- 65. Residential Area, sector 9 •Gardens on footpath…………… No protection of public space 65 Source: CSE
- 66. Areas with heavy footfalls: High modal conflict and unsafe o Around PGI hospital and Punjab university: This has large number of walkers. But motor vehicles are allowed very high speed -- 65 Km/h. There is no traffic calming measures. Crossing facilities are poor. 66 PGI at one side and Punjab university on the other; No safe crossings for people, Source: CSE
- 67. Design bars…… 67 Parking meant for whom, really?? Dare to CROSS!! Snapshots from perception survey -- Many want to walk and cycle to the sector market (700-800 meters away) but high speed vehicles and inadequate footpaths and cycle tracks deter them -- Many want cap on speed limit in the residential areas -- People do cycle and walk on weekends but the crossings are not designed for NMV users………… Footpath hits deadend Source: CSE
- 68. Round abouts need improvement `Rotaries at the intersection need design improvement to make it safer and calmer: These will require design improvement and Example London: Global innovations………… improvement and traffic calming measures safety of all road users. Becoming accident prone.
- 69. Dark alleys o Walkways: blacked out 69
- 70. No lights on many roads Street Lighting Type Street Lighting Location 70 Source: CMP
- 71. Onus on whom? Experience from Dhaka Bangladesh Road Transport 71 Transport Regulations and Rules 2012 requires pedestrians to carry indicators including reflector, lamp etc People are complying to protest
- 72. The make over Existing and proposed NMT tracks On anvil -- Footpaths along 220 km of roads to be taken up. -- About 60 Km of cycle network has been identified 72 This can be at risk if car centric infrastructure expands The traffic engineering and management measures under discussion: -- Corridor improvement through traffic circulation measures, ban on certain turning movements, one way streets underpasses at junctions etc. These impede natural flow of walker, cyclists and public transport users.
- 73. Lesson from Delhi 73 VIKAS MARG TUGHLAKABAD FORT Source: CSE
- 74. Car infrastructure severing neighbourhoods and pedestrian routes (All India Institute of Medical Sciences intersection) 74 Cloverleaf flyover disrupt at-grade continuity and direct shortest route, increase walking distance for the ailing visitors using public transport At least in one direction use of subway is unavoidable Before After Source: CSE
- 75. It is possible to change Redesigned streets in a small town of Nanded in Maharashtra After 75 Source: Pradeep Sachdeva Before After
- 76. Retrofitting changes….. • Sidewalks being rerebuilt in Delhi 76 Connaught Place Source: CSE
- 77. Global rich transforming public spaces Adding Human dignity and respect 77 BRT Corridor Source: GIZ
- 79. Delhi has adopted street design guidelines UTTIPEC guidelines 79
- 80. Devil in detail VIKAS MARG Delhi: Even when new infrastructure is created 80 Source: CSE is created according to guidelines any design flaw can make the facility unusable
- 81. Going beyond – planning for a compact city Delhi setting norms for high density requirements Delhi framing Transit Oriented Development Policy (DDA/UTTIPEC) Density minimums as per the table below: Source: UTTIPEC
- 82. National Habitat Standard Mission of the Ministry of Urban Development Guidelines for compact mixed land use -- 95% of residences should have daily needs retail, parks, primary schools and recreational areas accessible within 400m walking distance. -- 95% residences should have access to employment and public and institutional services by public transport or bicycle or walk or combination of two or more. Build compact and accessible city transport or bicycle or walk or combination of two or more. -- At least 85% of all streets to have mixed use development. -- Need small block size with high density permeable streets etc UTTIPEC TOD guidelines
- 83. Excerpts: Initiate planning and road design schemes where unwatched streets can be transformed... to make safe urban areas: • Get rid of walls and setbacks. Add street edge uses -- for road safety at night, Transparent fencing shall be used above 300 Safety and urban planning… Transparent fencing shall be used above 300 mm high toe wall from ground level. • Add planned hawker zones. • Adhere to IRC 103:2012 for Street Design. • Introduce planned mixed-use housing …along road edges of major vulnerable roads. Slow down vehicles on Roads : • No more signal free corridors- signalize existing ones. • Remove gates on public streets from gated colonies from vulnerable areas.
- 84. With seamless traffic and FOBs pedestrians disappear from the roads. Cities become unsafe 8484
- 85. Where will you feel more safe to walk? Why do we have building setbacks and boundary walls? Source: CSE
- 86. 86 Do not underestimate para transit……. The lifeline Autos and rickshaws
- 87. Cycle rickshaws are part of the solution…. High share of short trips make para transit convenient and affordable. Even buses are Can we have zero emissions street? 87 convenient and affordable. Even buses are not convenient for short distances. Delhi is reorganising this sector: Cycle rickshaw policy in Delhi under preparation. Environmentally Sustainable streets in Dhaka
- 88. B Visionary interventions The Delhi High Court ruling: -- The Municipal Corporation of Delhi (MCD)‟s policy of restricting cycle rickshaw licenses was unconstitutional as it violated the right to earn 88 rickshaw licenses was unconstitutional as it violated the right to earn livelihood. Since cars were not regulated, cycle rickshaws could not be blamed for causing congestion. Punjab, Haryana and Chandigarh: 2012, Punjab and Haryana High Court took suo motu action to introduce Ecocabs in 22 district headquarters in Punjab, Haryana and Chandigarh with the objective to improve environmental quality in urban areas. Source: http://www.idfc.com/pdf/publications/Policy-Group-Qtly-no-17-Sep2012-IPT.pdf
- 89. Patiala Green Cabs Fazilka Ecocab Vehicle of the future…….. 89 Amritsar Ecocab -- Also other para transit need integration Three-wheeler policy in Delhi: All three-wheeler drivers to get public service vehicle badge and smart cards. -- GPS connectivity to improve the meters and compliance. -- In-use vehicle fitness and emission testing systems --Integrate with mass transit system.
- 91. Chandigarh identifying parking spaces CSE mapping of some parking lots…… 91 SECTOR 17 SECTOR 9 In Chandigarh new annual registration of cars creates demand for additional land for parking – that equals to 58 football fields……………… Source: CSE
- 92. 400 500 600 700 800 900 Demand supply gap Coventional paradigm – demand supply gap 92 0 100 200 300 400 Infront of High Court Infront of Post Master General Office Backside of Micky Chhabra Shop Sec. - 17E, (SCO-5- 6) Parking demand (ECS) Parking supply (ECS) Source: CSE analysis of CMP data
- 93. 0% 50% 100% Infront of High Court Infront of Post Master General Office Backside of Micky Chhabra Shop Sec. - 17E, (SCO-5-6) Peak time parking Others Two-wheeler Car Parking demand as per duration Cars and two-wheelers dominate parking. Most vehicles are short duration 93 0% 10% 20% 30% 40% 50% 60% 70% 80% 90% 100% Car Two wheeler Car Two wheeler Car Two wheeler Infront of High Court Infront of Post Master General Office Backside of Micky Chhabra Shop Sec. -17E, (SCO-5-6) Parking demand as per duration >8 hrs 6-8 hrs 4-6 hrs 2-4 hrs 0-2 hrs Source: CSE analysis of CMP data
- 94. Parking strategy is identified as the first gen car restraint measure in Delhi…… 2006 “Land is limited and there is a limit to the additional parking space that can be created in the city. This will also require …. well thought out pricing policy to control the demand for parking.” • The provision of parking for personal motorised vehicles cannot be considered as a matter of public good. • Individual user of personal vehicle should pay for the use of the space for parking and parking facilities. The ‘user pays’ principle 94 space for parking and parking facilities. The ‘user pays’ principle should govern the pricing of parking. • Government should not subsidise this cost • Use a wide variety of tools for pricing parking -- time variable rates –etc. • On the basis of these principles MCD, DDA, NDMC should frame the rationalised pricing policy for all types of parking facilities… Supreme Court takes this on board. Issues directives for a parking policy as a demand management tool…….
- 95. Enforcement: The first steps…… Find method in the madness….Tame the chaos EPCA directives to MCD, NDMC in Delhi -- Demarcate legal parking spaces. Organise them well. -- Inventorise the parking spaces. Put out the list on the website -- Prevent encroachment of walkways 95 -- Prevent encroachment of walkways -- Put up signages and information systems -- Introduce metering -- Impose penalty -- Similar moves in other cities – Chennai, Pune, Pimpri Chinchwad etc On-street parking cannot be eliminated. Needs to be managed well. Pune, Pimpri Chinchwad getting organised
- 96. Proposed Asaf Ali Road, New Delhi 96 Off street car and auto rickshaw parking area along the road Source: I Trans, Anvita Arora
- 97. PET RO L PUMP SCO O TER PAR KI NG Need local area management plan……….. Harmonise parking rates for MLP and surface parking EROS FOR CARS Rs 20 for 2 hrs, Rs 40 : 2-4 hrs Rs 60 : 4-6 Rs 100 : 6-10 hrs Rs 250 : 24 hrs Nehru Place Parking C H I R A G D E L H I − K A L K A J I R O A D ( 4 5 . 0 M R / W ) Survey Locations AUGUST 2005 11:1000 LAYOUT PLAN PAH ARPU R BU SIN ESS CENT RE AN SAL O VER HEAD W ATER TANK 6.00 6.00 24.00 Green Area Public Utility Commercial/Semi Commercial Area On-Street Parking No On-Street Parking Proposed Multilevel Parking SiteExisting Multilevel Parking Car: Rs 10 for 12 hrs 2Ws: Rs 5 for 12 hrs No “on-street” parking proposed but not implemented Source: CSE study
- 98. Chandigarh: Miniscule parking charges 98 Source: CSE
- 99. How pricing can influence this street? 99 Source: CSE
- 100. On-street parking pricing has major impact............... 100 29.05.2013 No meters Meters Prices quadrupled Grosvenor square, London Source: TRL in ITDP (2011): Europe‘s Parking U-Turn
- 101. No cars without parking • Sikkim transport department: Notification making it mandatory for buyers to produce an availability-of-parking-space certificate before they can get their vehicles registered • The superintendent of police (traffic) issues certificates after physical verification of the parking space. Outside the city responsibility has been given to panchayats • This is followed by an inspection by motor vehicles inspector, who will submit details Whiff of change…. Sikkim 101 • This is followed by an inspection by motor vehicles inspector, who will submit details to the transport department along with a rough map of the site • Traffic police frames guidelines to implement the notification in Gangtok • The notification aims to encourage people to have parking spaces in their houses and parking along roads is not advisable • In the hills, car owners often park along the road and walk to their houses, which may be located higher up or lower down • Only people who live along NH31A or other state roads have the luxury of parking spaces in front of their houses • Two car dealers received notices from the transport department directing them not to sell cars without first asking for the availability-of-parking-space certificate
- 102. Whiff of change….Aizawl Aizawl: Regulation and Control of Vehicles Parking To own and buy a car….. • the owner of any type of motor vehicle including two wheelers shall have a garage within his own residential or business compound or in some other place, or a garage hired from any other person, for parking the vehicle (The Mizoram Gazette, Vol XL, Issue No. 52, February 2011) 102 • Purchaser, before purchasing any type of motor vehicle including two wheelers or the person intending to purchase any such motor vehicle shall obtain a certificate from the ….transport department…that he has a garage, within his own residential or business compound or in some other place, or a garage to hire from other person, for parking the vehicle he intends to purchase (The Mizoram Gazette, Vol XXXIX, Issue No. 295, August 2010) Other parts of India learn………….. High Court of Jodhpur makes availability of parking space mandatory to car ownership. But need strategy for enforcement
- 103. Other countries are limiting and pricing parking Capping parking supply Portland, Oregon Overall cap of 40,000 parking spaces downtown. This increased public transport usage from 20-25 per cent in the 1970s to 48 per cent in mid 1990s. Seattle allows a maximum of one parking space per 100 square metres at downtown office San Francisco limits parking to seven per cent of a downtown building’s floor area Parking pricing strategy to reduce car usage. Benefits public transport New York: Very high parking fees and limited parking supply lowers car ownership far below the US average. Bogota Removed limit on the fees charged by private parking companies. The revenue goes 103 Bogota Removed limit on the fees charged by private parking companies. The revenue goes to road maintenance and public transit improvement. Shenzhen: Hike in parking fees during peak hours leads to 30% drop in the parking demand. Bremen: No free parking in city centre. Parking charges higher than public transport cost. Barcelona– Parking revenue directed to a special fund for mobility purposes. London: parking income channeled to transportation projects. Strong enforcement and penalty Tokyo: Enforcement against parking violations cuts congestion drastically . Private firms allowed to issue tickets for parking violations. This makes on-street parking expensive. Antwerp: parking fines are invested into mobility projects Free up public space Paris: Street space freed for bike sharing and trams Copenhagen: Streets freed up for bike lanes etc
- 104. Adopt parking policy as a demand management measure • Adopt flexible parking standards and move towards maximum caps to account for improved public transport access and reduction in personal vehicle travel. • Integrate parking design with multi-modal integration • More stringent controls and enforcement • Reforms parking pricing -- Minimise free parking, restrict on-street parking, use variable parking rates, avoid fixed annual payment, price parity between surface and multi-level parking etc. Discard one time parking charge 104 multi-level parking etc. Discard one time parking charge • No parking on green spaces, pavement, NMT lanes etc. Non-negotiable. • Need parking strategy for residential areas and mixed land use areas. Promote priced, shared, common parking • Use parking revenue for public transport, and local area improvement • Stringent penalty on parking violations. • Develop parking strategy for special localities like hospitals, railway station, cinemas, shopping malls, schools, high impact events etc • Parking strategy for buses, IPT, freight • EIA of large commercial buildings to assess parking impacts and seek mitigation
- 105. Our cities need upscaled transition Avoid future emissions Shift to sustainable modes of mobility Indian cities have begun to work towards policies for low carbon and clean transportation. This will have to be enabled and scaled up. Opportunity to provide scaled up alternatives Public transport Infrastructure for walking and cycling Reduce demand for travel and vehicle usage 105 Reduce demand for travel and vehicle usage Land-use planning Road pricing Tax rationalisation Parking policy and charges Leapfrog technology Emissions standards Fuel economy standards Fund the transition: Need tax measures to allocate resources efficiently and raise revenue. Taxes on public transport is 2.6 times higher.
- 106. Change is possible: Early Singapore • Severe Traffic Congestion • Rising travel demand • Unreliable bus services Some of the SIA slides have been provided by Monhinder Singh, Director LTA Academy 106Source: GIZ
- 107. Rich cities have less cars……………. Relationship between GDP per Capita and Individual Motorised Modal Share 107 Source: IEA, Energy Technology Perspectives, Paris 2008 Decoupling of economic growth and individual motorised transport achievable!
- 109. Towards livable cities…… 109 Thank You