Weitere ähnliche Inhalte
Ähnlich wie Polar plots with R (20)
Polar plots with R
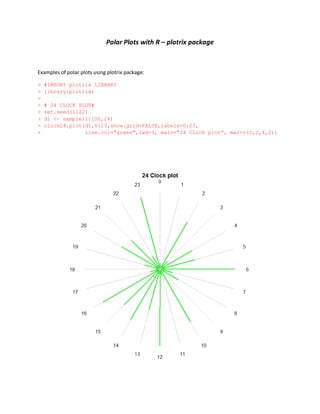
- 1. Polar Plots with R – plotrix package
Examples of polar plots using plotrix package:
> #IMPORT plotrix LIBRARY
> library(plotrix)
>
> # 24 CLOCK PLOT#
> set.seed(1122)
> d1 <- sample(1:100,24)
> clock24.plot(d1,0:23,show.grid=FALSE,labels=0:23,
+ line.col="green",lwd=3, main="24 Clock plot", mar=c(2,2,4,2))
- 2. > #12 CLOCK PLOT
> set.seed(984)
> d2 <- sample(1:100, 12)
> radial.plot(d2,labels=12:1,rp.type="p",
+ main="12 Clock
plot",line.col=2,show.grid=FALSE,lwd=3,start=pi/2,clockwise=FALSE,
+ radial.lim=c(0,100), mar=c(2,2,4,2),show.radial.grid=FALSE)
- 3. > #360 DEGREE PLOT#
> set.seed(2211984)
> d3 <- sample(1:100,36)
> polar.plot(d2,seq(0,350,by=10),main="360 degree plot",mar=c(2,2,4,2),
+ lwd=3,line.col=4, start=90, rp.type="p",
+ clockwise=TRUE,show.grid.labels=FALSE)