SlideShare ist ein Scribd-Unternehmen logo
1 von 21
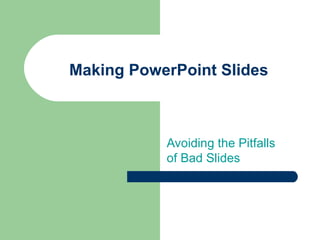
Making PowerPoint Slides


           Avoiding the Pitfalls
           of Bad Slides
Tips to be Covered

   Outlines
   Slide Structure
   Fonts
   Colour
   Background
   Graphs
   Spelling and Grammar
   Conclusions
   Questions
Outline

   Make your 1st or 2nd slide an outline of your
    presentation
    –   Ex: previous slide
   Follow the order of your outline for the rest of
    the presentation
   Only place main points on the outline slide
    –   Ex: Use the titles of each slide as main points
Slide Structure – Good

   Use 1-2 slides per minute of your presentation
   Write in point form, not complete sentences
   Include 4-5 points per slide
   Avoid wordiness: use key words and phrases
    only
Slide Structure - Bad
   This page contains too many words for a
    presentation slide. It is not written in point
    form, making it difficult both for your audience
    to read and for you to present each point.
    Although there are exactly the same number of
    points on this slide as the previous slide, it
    looks much more complicated. In short, your
    audience will spend too much time trying to
    read this paragraph instead of listening to you.
Slide Structure – Good

   Show one point at a time:
    –   Will help audience concentrate on what you are
        saying
    –   Will prevent audience from reading ahead
    –   Will help you keep your presentation focused
Slide Structure - Bad

   Do not use distracting animation

   Do not go overboard with the animation

   Be consistent with the animation that you use
Fonts - Good

   Use at least an 18-point font
   Use different size fonts for main points and
    secondary points
    –   this font is 24-point, the main point font is 28-point,
        and the title font is 36-point
   Use a standard font like Times New Roman or
    Arial
Fonts - Bad
   If you use a small font, your audience won’t be able to read what you have written


   CAPITALIZE ONLY WHEN NECESSARY. IT
    IS DIFFICULT TO READ

   Don’t use a complicated font
Colour - Good

   Use a colour of font that contrasts sharply with
    the background
    –   Ex: blue font on white background
   Use colour to reinforce the logic of your
    structure
    –   Ex: light blue title and dark blue text
   Use colour to emphasize a point
    –   But only use this occasionally
Colour - Bad
   Using a font colour that does not contrast with
    the background colour is hard to read
   Using colour for decoration is distracting and
    annoying.
   Using a different colour for each point is
    unnecessary
    –   Using a different colour for secondary points is also
        unnecessary
   Trying to be creative can also be bad
Background - Good

   Use backgrounds such as this one that are
    attractive but simple

   Use backgrounds which are light

   Use the same background consistently
    throughout your presentation
Background – Bad

   Avoid backgrounds that are distracting or
    difficult to read from
   Always be consistent with the background that
    you use
Graphs - Good

   Use graphs rather than just charts and words
    –   Data in graphs is easier to comprehend & retain
        than is raw data
    –   Trends are easier to visualize in graph form

   Always title your graphs
Graphs - Bad


               January February    March     April
    Blue Balls     20.4     27.4        90     20.4
    Red Balls      30.6     38.6      34.6     31.6
Graphs - Good
            Items Sold in First Quarter of 2002

100
 90
 80
70
60
                                                   Blue Balls
50
                                                   Red Balls
40
30
20
10
 0
      January     February     March       April
Graphs - Bad
100

                                      90
 90


 80


 70


 60


                                                                                Blue Balls
 50
                                                                                Red Balls


 40                            38.6
                                                   34.6
               30.6                                                      31.6
 30                   27.4

      20.4                                                20.4
 20


 10


  0
         January         February          March                 April
Graphs - Bad

   Minor gridlines are unnecessary
   Font is too small
   Colours are illogical
   Title is missing
   Shading is distracting
Spelling and Grammar

   Proof your slides for:
    –   speling mistakes
    –   the use of of repeated words
    –   grammatical errors you might have make

   If English is not your first language, please
    have someone else check your presentation!
Conclusion

   Use an effective and strong closing
    –   Your audience is likely to remember your last words

   Use a conclusion slide to:
    –   Summarize the main points of your presentation
    –   Suggest future avenues of research
Questions??

   End your presentation with a simple question
    slide to:
    –   Invite your audience to ask questions
    –   Provide a visual aid during question period
    –   Avoid ending a presentation abruptly

Weitere ähnliche Inhalte

Ähnlich wie Presentations tips

Avoiding pitfalls of bad slides
Avoiding pitfalls of bad slidesAvoiding pitfalls of bad slides
Avoiding pitfalls of bad slidesbrophyl
 
Presentations tips
Presentations tipsPresentations tips
Presentations tipsAbirmanu
 
Presentations tips
Presentations tipsPresentations tips
Presentations tipsJas Preet
 
Presentations tips
Presentations tipsPresentations tips
Presentations tipsrajeshd1986
 
Presentations tips
Presentations tipsPresentations tips
Presentations tipsRatzzak
 
Presentations tips
Presentations tipsPresentations tips
Presentations tipszeusdex
 
Presentations tips
Presentations tipsPresentations tips
Presentations tipsdjbm71
 
Presentations tips
Presentations tipsPresentations tips
Presentations tipsnakomuri
 
Presentations tips
Presentations tipsPresentations tips
Presentations tipsplus91anand
 
Presentations tips
Presentations tipsPresentations tips
Presentations tipschelovek84
 
Presentations tips
Presentations tipsPresentations tips
Presentations tipsDaniel Gomez
 
Presentations tips
Presentations tipsPresentations tips
Presentations tipsTanmaySoni
 
Presentations tips
Presentations tipsPresentations tips
Presentations tipsjamesbudd99
 

Ähnlich wie Presentations tips (20)

Avoiding pitfalls of bad slides
Avoiding pitfalls of bad slidesAvoiding pitfalls of bad slides
Avoiding pitfalls of bad slides
 
Presentations tips
Presentations tipsPresentations tips
Presentations tips
 
Presentations tips
Presentations tipsPresentations tips
Presentations tips
 
Presentations tips
Presentations tipsPresentations tips
Presentations tips
 
Presentations tips
Presentations tipsPresentations tips
Presentations tips
 
Presentations tips
Presentations tipsPresentations tips
Presentations tips
 
Presentations tips
Presentations tipsPresentations tips
Presentations tips
 
Presentations tips
Presentations tipsPresentations tips
Presentations tips
 
Presentations tips
Presentations tipsPresentations tips
Presentations tips
 
Presentations tips
Presentations tipsPresentations tips
Presentations tips
 
Presentations tips
Presentations tipsPresentations tips
Presentations tips
 
Presentations tips
Presentations tipsPresentations tips
Presentations tips
 
Presentations tips
Presentations tipsPresentations tips
Presentations tips
 
Presentations tips
Presentations tipsPresentations tips
Presentations tips
 
Presentations tips
Presentations tipsPresentations tips
Presentations tips
 
Presentations tips
Presentations tipsPresentations tips
Presentations tips
 
Presentations tips
Presentations tipsPresentations tips
Presentations tips
 
Presentations tips
Presentations tipsPresentations tips
Presentations tips
 
Elen
ElenElen
Elen
 
Presentations tips
Presentations tipsPresentations tips
Presentations tips
 

Kürzlich hochgeladen

Seal of Good Local Governance (SGLG) 2024Final.pptx
Seal of Good Local Governance (SGLG) 2024Final.pptxSeal of Good Local Governance (SGLG) 2024Final.pptx
Seal of Good Local Governance (SGLG) 2024Final.pptxnegromaestrong
 
Key note speaker Neum_Admir Softic_ENG.pdf
Key note speaker Neum_Admir Softic_ENG.pdfKey note speaker Neum_Admir Softic_ENG.pdf
Key note speaker Neum_Admir Softic_ENG.pdfAdmir Softic
 
Sociology 101 Demonstration of Learning Exhibit
Sociology 101 Demonstration of Learning ExhibitSociology 101 Demonstration of Learning Exhibit
Sociology 101 Demonstration of Learning Exhibitjbellavia9
 
Measures of Central Tendency: Mean, Median and Mode
Measures of Central Tendency: Mean, Median and ModeMeasures of Central Tendency: Mean, Median and Mode
Measures of Central Tendency: Mean, Median and ModeThiyagu K
 
PROCESS RECORDING FORMAT.docx
PROCESS      RECORDING        FORMAT.docxPROCESS      RECORDING        FORMAT.docx
PROCESS RECORDING FORMAT.docxPoojaSen20
 
ComPTIA Overview | Comptia Security+ Book SY0-701
ComPTIA Overview | Comptia Security+ Book SY0-701ComPTIA Overview | Comptia Security+ Book SY0-701
ComPTIA Overview | Comptia Security+ Book SY0-701bronxfugly43
 
Basic Civil Engineering first year Notes- Chapter 4 Building.pptx
Basic Civil Engineering first year Notes- Chapter 4 Building.pptxBasic Civil Engineering first year Notes- Chapter 4 Building.pptx
Basic Civil Engineering first year Notes- Chapter 4 Building.pptxDenish Jangid
 
The basics of sentences session 3pptx.pptx
The basics of sentences session 3pptx.pptxThe basics of sentences session 3pptx.pptx
The basics of sentences session 3pptx.pptxheathfieldcps1
 
This PowerPoint helps students to consider the concept of infinity.
This PowerPoint helps students to consider the concept of infinity.This PowerPoint helps students to consider the concept of infinity.
This PowerPoint helps students to consider the concept of infinity.christianmathematics
 
Holdier Curriculum Vitae (April 2024).pdf
Holdier Curriculum Vitae (April 2024).pdfHoldier Curriculum Vitae (April 2024).pdf
Holdier Curriculum Vitae (April 2024).pdfagholdier
 
Z Score,T Score, Percential Rank and Box Plot Graph
Z Score,T Score, Percential Rank and Box Plot GraphZ Score,T Score, Percential Rank and Box Plot Graph
Z Score,T Score, Percential Rank and Box Plot GraphThiyagu K
 
Measures of Dispersion and Variability: Range, QD, AD and SD
Measures of Dispersion and Variability: Range, QD, AD and SDMeasures of Dispersion and Variability: Range, QD, AD and SD
Measures of Dispersion and Variability: Range, QD, AD and SDThiyagu K
 
TỔNG ÔN TẬP THI VÀO LỚP 10 MÔN TIẾNG ANH NĂM HỌC 2023 - 2024 CÓ ĐÁP ÁN (NGỮ Â...
TỔNG ÔN TẬP THI VÀO LỚP 10 MÔN TIẾNG ANH NĂM HỌC 2023 - 2024 CÓ ĐÁP ÁN (NGỮ Â...TỔNG ÔN TẬP THI VÀO LỚP 10 MÔN TIẾNG ANH NĂM HỌC 2023 - 2024 CÓ ĐÁP ÁN (NGỮ Â...
TỔNG ÔN TẬP THI VÀO LỚP 10 MÔN TIẾNG ANH NĂM HỌC 2023 - 2024 CÓ ĐÁP ÁN (NGỮ Â...Nguyen Thanh Tu Collection
 
Unit-IV- Pharma. Marketing Channels.pptx
Unit-IV- Pharma. Marketing Channels.pptxUnit-IV- Pharma. Marketing Channels.pptx
Unit-IV- Pharma. Marketing Channels.pptxVishalSingh1417
 
Making and Justifying Mathematical Decisions.pdf
Making and Justifying Mathematical Decisions.pdfMaking and Justifying Mathematical Decisions.pdf
Making and Justifying Mathematical Decisions.pdfChris Hunter
 
How to Give a Domain for a Field in Odoo 17
How to Give a Domain for a Field in Odoo 17How to Give a Domain for a Field in Odoo 17
How to Give a Domain for a Field in Odoo 17Celine George
 
Advanced Views - Calendar View in Odoo 17
Advanced Views - Calendar View in Odoo 17Advanced Views - Calendar View in Odoo 17
Advanced Views - Calendar View in Odoo 17Celine George
 

Kürzlich hochgeladen (20)

Seal of Good Local Governance (SGLG) 2024Final.pptx
Seal of Good Local Governance (SGLG) 2024Final.pptxSeal of Good Local Governance (SGLG) 2024Final.pptx
Seal of Good Local Governance (SGLG) 2024Final.pptx
 
Asian American Pacific Islander Month DDSD 2024.pptx
Asian American Pacific Islander Month DDSD 2024.pptxAsian American Pacific Islander Month DDSD 2024.pptx
Asian American Pacific Islander Month DDSD 2024.pptx
 
Key note speaker Neum_Admir Softic_ENG.pdf
Key note speaker Neum_Admir Softic_ENG.pdfKey note speaker Neum_Admir Softic_ENG.pdf
Key note speaker Neum_Admir Softic_ENG.pdf
 
Mehran University Newsletter Vol-X, Issue-I, 2024
Mehran University Newsletter Vol-X, Issue-I, 2024Mehran University Newsletter Vol-X, Issue-I, 2024
Mehran University Newsletter Vol-X, Issue-I, 2024
 
Sociology 101 Demonstration of Learning Exhibit
Sociology 101 Demonstration of Learning ExhibitSociology 101 Demonstration of Learning Exhibit
Sociology 101 Demonstration of Learning Exhibit
 
Measures of Central Tendency: Mean, Median and Mode
Measures of Central Tendency: Mean, Median and ModeMeasures of Central Tendency: Mean, Median and Mode
Measures of Central Tendency: Mean, Median and Mode
 
PROCESS RECORDING FORMAT.docx
PROCESS      RECORDING        FORMAT.docxPROCESS      RECORDING        FORMAT.docx
PROCESS RECORDING FORMAT.docx
 
ComPTIA Overview | Comptia Security+ Book SY0-701
ComPTIA Overview | Comptia Security+ Book SY0-701ComPTIA Overview | Comptia Security+ Book SY0-701
ComPTIA Overview | Comptia Security+ Book SY0-701
 
Basic Civil Engineering first year Notes- Chapter 4 Building.pptx
Basic Civil Engineering first year Notes- Chapter 4 Building.pptxBasic Civil Engineering first year Notes- Chapter 4 Building.pptx
Basic Civil Engineering first year Notes- Chapter 4 Building.pptx
 
The basics of sentences session 3pptx.pptx
The basics of sentences session 3pptx.pptxThe basics of sentences session 3pptx.pptx
The basics of sentences session 3pptx.pptx
 
This PowerPoint helps students to consider the concept of infinity.
This PowerPoint helps students to consider the concept of infinity.This PowerPoint helps students to consider the concept of infinity.
This PowerPoint helps students to consider the concept of infinity.
 
Holdier Curriculum Vitae (April 2024).pdf
Holdier Curriculum Vitae (April 2024).pdfHoldier Curriculum Vitae (April 2024).pdf
Holdier Curriculum Vitae (April 2024).pdf
 
Z Score,T Score, Percential Rank and Box Plot Graph
Z Score,T Score, Percential Rank and Box Plot GraphZ Score,T Score, Percential Rank and Box Plot Graph
Z Score,T Score, Percential Rank and Box Plot Graph
 
Measures of Dispersion and Variability: Range, QD, AD and SD
Measures of Dispersion and Variability: Range, QD, AD and SDMeasures of Dispersion and Variability: Range, QD, AD and SD
Measures of Dispersion and Variability: Range, QD, AD and SD
 
TỔNG ÔN TẬP THI VÀO LỚP 10 MÔN TIẾNG ANH NĂM HỌC 2023 - 2024 CÓ ĐÁP ÁN (NGỮ Â...
TỔNG ÔN TẬP THI VÀO LỚP 10 MÔN TIẾNG ANH NĂM HỌC 2023 - 2024 CÓ ĐÁP ÁN (NGỮ Â...TỔNG ÔN TẬP THI VÀO LỚP 10 MÔN TIẾNG ANH NĂM HỌC 2023 - 2024 CÓ ĐÁP ÁN (NGỮ Â...
TỔNG ÔN TẬP THI VÀO LỚP 10 MÔN TIẾNG ANH NĂM HỌC 2023 - 2024 CÓ ĐÁP ÁN (NGỮ Â...
 
Unit-IV- Pharma. Marketing Channels.pptx
Unit-IV- Pharma. Marketing Channels.pptxUnit-IV- Pharma. Marketing Channels.pptx
Unit-IV- Pharma. Marketing Channels.pptx
 
Making and Justifying Mathematical Decisions.pdf
Making and Justifying Mathematical Decisions.pdfMaking and Justifying Mathematical Decisions.pdf
Making and Justifying Mathematical Decisions.pdf
 
INDIA QUIZ 2024 RLAC DELHI UNIVERSITY.pptx
INDIA QUIZ 2024 RLAC DELHI UNIVERSITY.pptxINDIA QUIZ 2024 RLAC DELHI UNIVERSITY.pptx
INDIA QUIZ 2024 RLAC DELHI UNIVERSITY.pptx
 
How to Give a Domain for a Field in Odoo 17
How to Give a Domain for a Field in Odoo 17How to Give a Domain for a Field in Odoo 17
How to Give a Domain for a Field in Odoo 17
 
Advanced Views - Calendar View in Odoo 17
Advanced Views - Calendar View in Odoo 17Advanced Views - Calendar View in Odoo 17
Advanced Views - Calendar View in Odoo 17
 

Presentations tips

  • 1. Making PowerPoint Slides Avoiding the Pitfalls of Bad Slides
  • 2. Tips to be Covered  Outlines  Slide Structure  Fonts  Colour  Background  Graphs  Spelling and Grammar  Conclusions  Questions
  • 3. Outline  Make your 1st or 2nd slide an outline of your presentation – Ex: previous slide  Follow the order of your outline for the rest of the presentation  Only place main points on the outline slide – Ex: Use the titles of each slide as main points
  • 4. Slide Structure – Good  Use 1-2 slides per minute of your presentation  Write in point form, not complete sentences  Include 4-5 points per slide  Avoid wordiness: use key words and phrases only
  • 5. Slide Structure - Bad  This page contains too many words for a presentation slide. It is not written in point form, making it difficult both for your audience to read and for you to present each point. Although there are exactly the same number of points on this slide as the previous slide, it looks much more complicated. In short, your audience will spend too much time trying to read this paragraph instead of listening to you.
  • 6. Slide Structure – Good  Show one point at a time: – Will help audience concentrate on what you are saying – Will prevent audience from reading ahead – Will help you keep your presentation focused
  • 7. Slide Structure - Bad  Do not use distracting animation  Do not go overboard with the animation  Be consistent with the animation that you use
  • 8. Fonts - Good  Use at least an 18-point font  Use different size fonts for main points and secondary points – this font is 24-point, the main point font is 28-point, and the title font is 36-point  Use a standard font like Times New Roman or Arial
  • 9. Fonts - Bad  If you use a small font, your audience won’t be able to read what you have written  CAPITALIZE ONLY WHEN NECESSARY. IT IS DIFFICULT TO READ  Don’t use a complicated font
  • 10. Colour - Good  Use a colour of font that contrasts sharply with the background – Ex: blue font on white background  Use colour to reinforce the logic of your structure – Ex: light blue title and dark blue text  Use colour to emphasize a point – But only use this occasionally
  • 11. Colour - Bad  Using a font colour that does not contrast with the background colour is hard to read  Using colour for decoration is distracting and annoying.  Using a different colour for each point is unnecessary – Using a different colour for secondary points is also unnecessary  Trying to be creative can also be bad
  • 12. Background - Good  Use backgrounds such as this one that are attractive but simple  Use backgrounds which are light  Use the same background consistently throughout your presentation
  • 13. Background – Bad  Avoid backgrounds that are distracting or difficult to read from  Always be consistent with the background that you use
  • 14. Graphs - Good  Use graphs rather than just charts and words – Data in graphs is easier to comprehend & retain than is raw data – Trends are easier to visualize in graph form  Always title your graphs
  • 15. Graphs - Bad January February March April Blue Balls 20.4 27.4 90 20.4 Red Balls 30.6 38.6 34.6 31.6
  • 16. Graphs - Good Items Sold in First Quarter of 2002 100 90 80 70 60 Blue Balls 50 Red Balls 40 30 20 10 0 January February March April
  • 17. Graphs - Bad 100 90 90 80 70 60 Blue Balls 50 Red Balls 40 38.6 34.6 30.6 31.6 30 27.4 20.4 20.4 20 10 0 January February March April
  • 18. Graphs - Bad  Minor gridlines are unnecessary  Font is too small  Colours are illogical  Title is missing  Shading is distracting
  • 19. Spelling and Grammar  Proof your slides for: – speling mistakes – the use of of repeated words – grammatical errors you might have make  If English is not your first language, please have someone else check your presentation!
  • 20. Conclusion  Use an effective and strong closing – Your audience is likely to remember your last words  Use a conclusion slide to: – Summarize the main points of your presentation – Suggest future avenues of research
  • 21. Questions??  End your presentation with a simple question slide to: – Invite your audience to ask questions – Provide a visual aid during question period – Avoid ending a presentation abruptly