SlideShare ist ein Scribd-Unternehmen logo
1 von 9
Biology

Chemistry

Comparison of Leaf Metabolites

Informatics

Comparison of pumpkin and
tomatillo leaf primary
metabolites

Goal:
Carry out a statistical, HCA, PCA and O-/PLS-DA
analyses comparing leaf primary metabolite profiles
(Used DATA: Pumpkin and Tomatillo 1.csv)

Cucurbita pepo

Physalis philadelphica
Biology

Chemistry

Comparison of Leaf Metabolites

Informatics

Comparison of pumpkin and
tomatillo leaf primary
metabolites

Steps:
1.Identify analysis strategy (hint: use HCA
and PCA)
2.Conduct statistical comparison
3.Identify top multivariate discriminants
Data Exploration
Biology

Chemistry

Comparison of Leaf Metabolites

Informatics

Steps:
1. Identify the effect of treatment on species differences
• Use HCA
• PCA
Exercise:
Can different treatments be analyzed together to
identify species differences?
HCA clustering of samples
Biology

Chemistry

Comparison of Leaf Metabolites

Informatics
Biology

Chemistry

Comparison of Leaf Metabolites

Informatics

raw

PCA:
comparison of
pretreatments
Mean centered

Auto scaled
Biology

Chemistry

Identify Analysis
Strategy

Informatics

Comparison of Leaf Metabolites

Analysis Options:
If the treatment is a minor effect compared to species differences:

•

two-sample t-Test for Species

If the treatment is a has a considerable effect compared to species
differences:
•

two-way ANOVA for Species + treatment + interaction
(species/treatment)

If the treatment has a similar effect size to species differences:
•

Eliminate one treatment type from analysis and use t-Test

Conclusions:

•

Both PCA and HCA analyses suggests the treatment effect is minor

•

Using 12 compared to 6 samples per group will increased study power
Comparison PLS-DA to O-PLS-DA
Biology

Chemistry
Informatics

O-PLS-DA is only useful over PLS-DA when the axis of separation
between two groups spans >1 dimension

Comparison of Leaf Metabolites

PLS-DA

O-PLS-DA
Biology

Chemistry

Comparison of Leaf Metabolites

Informatics

Validation of PLS-DA model for
discrimination between pumpkin
and tomatillo leaf metabolites

Outstanding model
performance, highly unlikely
by random chance
Biology

Chemistry

Comparison of Leaf Metabolites

Informatics

Identification of top multivariate
discriminants between pumpkin and
tomatillo leaf primary metabolites

Could also select
from increasing
and decreasing
metabolites
separately

Weitere ähnliche Inhalte

Was ist angesagt?

Normalization of Large-Scale Metabolomic Studies 2014
Normalization of Large-Scale Metabolomic Studies 2014Normalization of Large-Scale Metabolomic Studies 2014
Normalization of Large-Scale Metabolomic Studies 2014Dmitry Grapov
 
General Concepts in QSAR for Using the QSAR Application Toolbox Part 3
General Concepts in QSAR for Using the QSAR Application Toolbox Part 3General Concepts in QSAR for Using the QSAR Application Toolbox Part 3
General Concepts in QSAR for Using the QSAR Application Toolbox Part 3International QSAR Foundation
 
Multivarite and network tools for biological data analysis
Multivarite and network tools for biological data analysisMultivarite and network tools for biological data analysis
Multivarite and network tools for biological data analysisDmitry Grapov
 
Metabolomic Data Analysis Case Studies
Metabolomic Data Analysis Case StudiesMetabolomic Data Analysis Case Studies
Metabolomic Data Analysis Case StudiesDmitry Grapov
 
Prote-OMIC Data Analysis and Visualization
Prote-OMIC Data Analysis and VisualizationProte-OMIC Data Analysis and Visualization
Prote-OMIC Data Analysis and VisualizationDmitry Grapov
 
Data Normalization Approaches for Large-scale Biological Studies
Data Normalization Approaches for Large-scale Biological StudiesData Normalization Approaches for Large-scale Biological Studies
Data Normalization Approaches for Large-scale Biological StudiesDmitry Grapov
 
Data analysis workflows part 2 2015
Data analysis workflows part 2 2015Data analysis workflows part 2 2015
Data analysis workflows part 2 2015Dmitry Grapov
 
3 data normalization (2014 lab tutorial)
3  data normalization (2014 lab tutorial)3  data normalization (2014 lab tutorial)
3 data normalization (2014 lab tutorial)Dmitry Grapov
 
Mapping to the Metabolomic Manifold
Mapping to the Metabolomic ManifoldMapping to the Metabolomic Manifold
Mapping to the Metabolomic ManifoldDmitry Grapov
 
Lecture 11 developing qsar, evaluation of qsar model and virtual screening
Lecture 11  developing qsar, evaluation of qsar model and virtual screeningLecture 11  developing qsar, evaluation of qsar model and virtual screening
Lecture 11 developing qsar, evaluation of qsar model and virtual screeningRAJAN ROLTA
 
Lecture 9 molecular descriptors
Lecture 9  molecular descriptorsLecture 9  molecular descriptors
Lecture 9 molecular descriptorsRAJAN ROLTA
 
Data analysis and Visualisation Techniques for Compound Combination Modelling
Data analysis and Visualisation Techniques for Compound Combination ModellingData analysis and Visualisation Techniques for Compound Combination Modelling
Data analysis and Visualisation Techniques for Compound Combination ModellingRichard Lewis
 
Metabolomics and Beyond Challenges and Strategies for Next-gen Omic Analyses
Metabolomics and Beyond Challenges and Strategies for Next-gen Omic Analyses Metabolomics and Beyond Challenges and Strategies for Next-gen Omic Analyses
Metabolomics and Beyond Challenges and Strategies for Next-gen Omic Analyses Dmitry Grapov
 
Strategies for Metabolomics Data Analysis
Strategies for Metabolomics Data AnalysisStrategies for Metabolomics Data Analysis
Strategies for Metabolomics Data AnalysisDmitry Grapov
 
Case Study: Overview of Metabolomic Data Normalization Strategies
Case Study: Overview of Metabolomic Data Normalization StrategiesCase Study: Overview of Metabolomic Data Normalization Strategies
Case Study: Overview of Metabolomic Data Normalization StrategiesDmitry Grapov
 
Advanced strategies for Metabolomics Data Analysis
Advanced strategies for Metabolomics Data AnalysisAdvanced strategies for Metabolomics Data Analysis
Advanced strategies for Metabolomics Data AnalysisDmitry Grapov
 
Omic Data Integration Strategies
Omic Data Integration StrategiesOmic Data Integration Strategies
Omic Data Integration StrategiesDmitry Grapov
 
Metabolomic data analysis and visualization tools
Metabolomic data analysis and visualization toolsMetabolomic data analysis and visualization tools
Metabolomic data analysis and visualization toolsDmitry Grapov
 

Was ist angesagt? (20)

Normalization of Large-Scale Metabolomic Studies 2014
Normalization of Large-Scale Metabolomic Studies 2014Normalization of Large-Scale Metabolomic Studies 2014
Normalization of Large-Scale Metabolomic Studies 2014
 
General Concepts in QSAR for Using the QSAR Application Toolbox Part 3
General Concepts in QSAR for Using the QSAR Application Toolbox Part 3General Concepts in QSAR for Using the QSAR Application Toolbox Part 3
General Concepts in QSAR for Using the QSAR Application Toolbox Part 3
 
Multivarite and network tools for biological data analysis
Multivarite and network tools for biological data analysisMultivarite and network tools for biological data analysis
Multivarite and network tools for biological data analysis
 
Metabolomic Data Analysis Case Studies
Metabolomic Data Analysis Case StudiesMetabolomic Data Analysis Case Studies
Metabolomic Data Analysis Case Studies
 
Prote-OMIC Data Analysis and Visualization
Prote-OMIC Data Analysis and VisualizationProte-OMIC Data Analysis and Visualization
Prote-OMIC Data Analysis and Visualization
 
Data Normalization Approaches for Large-scale Biological Studies
Data Normalization Approaches for Large-scale Biological StudiesData Normalization Approaches for Large-scale Biological Studies
Data Normalization Approaches for Large-scale Biological Studies
 
7 network mapping i
7  network mapping i7  network mapping i
7 network mapping i
 
Data analysis workflows part 2 2015
Data analysis workflows part 2 2015Data analysis workflows part 2 2015
Data analysis workflows part 2 2015
 
3 data normalization (2014 lab tutorial)
3  data normalization (2014 lab tutorial)3  data normalization (2014 lab tutorial)
3 data normalization (2014 lab tutorial)
 
Mapping to the Metabolomic Manifold
Mapping to the Metabolomic ManifoldMapping to the Metabolomic Manifold
Mapping to the Metabolomic Manifold
 
Lecture 11 developing qsar, evaluation of qsar model and virtual screening
Lecture 11  developing qsar, evaluation of qsar model and virtual screeningLecture 11  developing qsar, evaluation of qsar model and virtual screening
Lecture 11 developing qsar, evaluation of qsar model and virtual screening
 
Lecture 9 molecular descriptors
Lecture 9  molecular descriptorsLecture 9  molecular descriptors
Lecture 9 molecular descriptors
 
Data analysis and Visualisation Techniques for Compound Combination Modelling
Data analysis and Visualisation Techniques for Compound Combination ModellingData analysis and Visualisation Techniques for Compound Combination Modelling
Data analysis and Visualisation Techniques for Compound Combination Modelling
 
Metabolomics and Beyond Challenges and Strategies for Next-gen Omic Analyses
Metabolomics and Beyond Challenges and Strategies for Next-gen Omic Analyses Metabolomics and Beyond Challenges and Strategies for Next-gen Omic Analyses
Metabolomics and Beyond Challenges and Strategies for Next-gen Omic Analyses
 
Strategies for Metabolomics Data Analysis
Strategies for Metabolomics Data AnalysisStrategies for Metabolomics Data Analysis
Strategies for Metabolomics Data Analysis
 
Case Study: Overview of Metabolomic Data Normalization Strategies
Case Study: Overview of Metabolomic Data Normalization StrategiesCase Study: Overview of Metabolomic Data Normalization Strategies
Case Study: Overview of Metabolomic Data Normalization Strategies
 
Advanced strategies for Metabolomics Data Analysis
Advanced strategies for Metabolomics Data AnalysisAdvanced strategies for Metabolomics Data Analysis
Advanced strategies for Metabolomics Data Analysis
 
US-EPA CompTox Chemicals Dashboard as a web-based data resource to help ident...
US-EPA CompTox Chemicals Dashboard as a web-based data resource to help ident...US-EPA CompTox Chemicals Dashboard as a web-based data resource to help ident...
US-EPA CompTox Chemicals Dashboard as a web-based data resource to help ident...
 
Omic Data Integration Strategies
Omic Data Integration StrategiesOmic Data Integration Strategies
Omic Data Integration Strategies
 
Metabolomic data analysis and visualization tools
Metabolomic data analysis and visualization toolsMetabolomic data analysis and visualization tools
Metabolomic data analysis and visualization tools
 

Ähnlich wie 5 data analysis case study

Machine learning/deep learning application in tea industry
Machine learning/deep learning application in tea industryMachine learning/deep learning application in tea industry
Machine learning/deep learning application in tea industryGunasekar Kumarasamy
 
FDA 2013 Clinical Investigator Training Course: Clinical Pharmacology 1: Phas...
FDA 2013 Clinical Investigator Training Course: Clinical Pharmacology 1: Phas...FDA 2013 Clinical Investigator Training Course: Clinical Pharmacology 1: Phas...
FDA 2013 Clinical Investigator Training Course: Clinical Pharmacology 1: Phas...MedicReS
 
Nutrient content of moringa oleifera leaves
Nutrient content of moringa oleifera leavesNutrient content of moringa oleifera leaves
Nutrient content of moringa oleifera leavesDrumstick Moringa
 
MEDC-533 Group 2 Green Tea Final
MEDC-533 Group 2 Green Tea FinalMEDC-533 Group 2 Green Tea Final
MEDC-533 Group 2 Green Tea FinalWilliam Wolanski
 
Comparative Assessment of Total Polyphenols and Antioxidant Activity of Comme...
Comparative Assessment of Total Polyphenols and Antioxidant Activity of Comme...Comparative Assessment of Total Polyphenols and Antioxidant Activity of Comme...
Comparative Assessment of Total Polyphenols and Antioxidant Activity of Comme...AnuragSingh1049
 
Peptide therapeutics
Peptide therapeuticsPeptide therapeutics
Peptide therapeuticsGurwinder97
 
PurposeStudents will conduct one brief research exercise that w.docx
PurposeStudents will conduct one brief research exercise that w.docxPurposeStudents will conduct one brief research exercise that w.docx
PurposeStudents will conduct one brief research exercise that w.docxamrit47
 

Ähnlich wie 5 data analysis case study (10)

Machine learning/deep learning application in tea industry
Machine learning/deep learning application in tea industryMachine learning/deep learning application in tea industry
Machine learning/deep learning application in tea industry
 
FDA 2013 Clinical Investigator Training Course: Clinical Pharmacology 1: Phas...
FDA 2013 Clinical Investigator Training Course: Clinical Pharmacology 1: Phas...FDA 2013 Clinical Investigator Training Course: Clinical Pharmacology 1: Phas...
FDA 2013 Clinical Investigator Training Course: Clinical Pharmacology 1: Phas...
 
Nutrient content of moringa oleifera leaves
Nutrient content of moringa oleifera leavesNutrient content of moringa oleifera leaves
Nutrient content of moringa oleifera leaves
 
MEDC-533 Group 2 Green Tea Final
MEDC-533 Group 2 Green Tea FinalMEDC-533 Group 2 Green Tea Final
MEDC-533 Group 2 Green Tea Final
 
Comparative Assessment of Total Polyphenols and Antioxidant Activity of Comme...
Comparative Assessment of Total Polyphenols and Antioxidant Activity of Comme...Comparative Assessment of Total Polyphenols and Antioxidant Activity of Comme...
Comparative Assessment of Total Polyphenols and Antioxidant Activity of Comme...
 
Computer Aided Drug Design
Computer Aided Drug DesignComputer Aided Drug Design
Computer Aided Drug Design
 
Peptide therapeutics
Peptide therapeuticsPeptide therapeutics
Peptide therapeutics
 
403 RMR Lab
403 RMR Lab403 RMR Lab
403 RMR Lab
 
Consumo de té verde.pdf
Consumo de té verde.pdfConsumo de té verde.pdf
Consumo de té verde.pdf
 
PurposeStudents will conduct one brief research exercise that w.docx
PurposeStudents will conduct one brief research exercise that w.docxPurposeStudents will conduct one brief research exercise that w.docx
PurposeStudents will conduct one brief research exercise that w.docx
 

Mehr von Dmitry Grapov

R programming for Data Science - A Beginner’s Guide
R programming for Data Science - A Beginner’s GuideR programming for Data Science - A Beginner’s Guide
R programming for Data Science - A Beginner’s GuideDmitry Grapov
 
Network mapping 101 course
Network mapping 101 courseNetwork mapping 101 course
Network mapping 101 courseDmitry Grapov
 
Rise of Deep Learning for Genomic, Proteomic, and Metabolomic Data Integratio...
Rise of Deep Learning for Genomic, Proteomic, and Metabolomic Data Integratio...Rise of Deep Learning for Genomic, Proteomic, and Metabolomic Data Integratio...
Rise of Deep Learning for Genomic, Proteomic, and Metabolomic Data Integratio...Dmitry Grapov
 
Dmitry Grapov Resume and CV
Dmitry Grapov Resume and CVDmitry Grapov Resume and CV
Dmitry Grapov Resume and CVDmitry Grapov
 
Machine Learning Powered Metabolomic Network Analysis
Machine Learning Powered Metabolomic Network AnalysisMachine Learning Powered Metabolomic Network Analysis
Machine Learning Powered Metabolomic Network AnalysisDmitry Grapov
 
Complex Systems Biology Informed Data Analysis and Machine Learning
Complex Systems Biology Informed Data Analysis and Machine LearningComplex Systems Biology Informed Data Analysis and Machine Learning
Complex Systems Biology Informed Data Analysis and Machine LearningDmitry Grapov
 
Data analysis workflows part 1 2015
Data analysis workflows part 1 2015Data analysis workflows part 1 2015
Data analysis workflows part 1 2015Dmitry Grapov
 
Gene Ontology Enrichment Network Analysis -Tutorial
Gene Ontology Enrichment Network Analysis -TutorialGene Ontology Enrichment Network Analysis -Tutorial
Gene Ontology Enrichment Network Analysis -TutorialDmitry Grapov
 
American Society of Mass Spectrommetry Conference 2014
American Society of Mass Spectrommetry Conference 2014American Society of Mass Spectrommetry Conference 2014
American Society of Mass Spectrommetry Conference 2014Dmitry Grapov
 
Automation of (Biological) Data Analysis and Report Generation
Automation of (Biological) Data Analysis and Report GenerationAutomation of (Biological) Data Analysis and Report Generation
Automation of (Biological) Data Analysis and Report GenerationDmitry Grapov
 

Mehr von Dmitry Grapov (11)

R programming for Data Science - A Beginner’s Guide
R programming for Data Science - A Beginner’s GuideR programming for Data Science - A Beginner’s Guide
R programming for Data Science - A Beginner’s Guide
 
Network mapping 101 course
Network mapping 101 courseNetwork mapping 101 course
Network mapping 101 course
 
Rise of Deep Learning for Genomic, Proteomic, and Metabolomic Data Integratio...
Rise of Deep Learning for Genomic, Proteomic, and Metabolomic Data Integratio...Rise of Deep Learning for Genomic, Proteomic, and Metabolomic Data Integratio...
Rise of Deep Learning for Genomic, Proteomic, and Metabolomic Data Integratio...
 
Dmitry Grapov Resume and CV
Dmitry Grapov Resume and CVDmitry Grapov Resume and CV
Dmitry Grapov Resume and CV
 
Machine Learning Powered Metabolomic Network Analysis
Machine Learning Powered Metabolomic Network AnalysisMachine Learning Powered Metabolomic Network Analysis
Machine Learning Powered Metabolomic Network Analysis
 
Complex Systems Biology Informed Data Analysis and Machine Learning
Complex Systems Biology Informed Data Analysis and Machine LearningComplex Systems Biology Informed Data Analysis and Machine Learning
Complex Systems Biology Informed Data Analysis and Machine Learning
 
Data analysis workflows part 1 2015
Data analysis workflows part 1 2015Data analysis workflows part 1 2015
Data analysis workflows part 1 2015
 
Modeling poster
Modeling posterModeling poster
Modeling poster
 
Gene Ontology Enrichment Network Analysis -Tutorial
Gene Ontology Enrichment Network Analysis -TutorialGene Ontology Enrichment Network Analysis -Tutorial
Gene Ontology Enrichment Network Analysis -Tutorial
 
American Society of Mass Spectrommetry Conference 2014
American Society of Mass Spectrommetry Conference 2014American Society of Mass Spectrommetry Conference 2014
American Society of Mass Spectrommetry Conference 2014
 
Automation of (Biological) Data Analysis and Report Generation
Automation of (Biological) Data Analysis and Report GenerationAutomation of (Biological) Data Analysis and Report Generation
Automation of (Biological) Data Analysis and Report Generation
 

5 data analysis case study

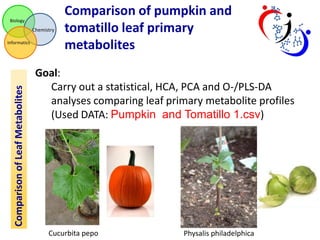
  • 1. Biology Chemistry Comparison of Leaf Metabolites Informatics Comparison of pumpkin and tomatillo leaf primary metabolites Goal: Carry out a statistical, HCA, PCA and O-/PLS-DA analyses comparing leaf primary metabolite profiles (Used DATA: Pumpkin and Tomatillo 1.csv) Cucurbita pepo Physalis philadelphica
  • 2. Biology Chemistry Comparison of Leaf Metabolites Informatics Comparison of pumpkin and tomatillo leaf primary metabolites Steps: 1.Identify analysis strategy (hint: use HCA and PCA) 2.Conduct statistical comparison 3.Identify top multivariate discriminants
  • 3. Data Exploration Biology Chemistry Comparison of Leaf Metabolites Informatics Steps: 1. Identify the effect of treatment on species differences • Use HCA • PCA Exercise: Can different treatments be analyzed together to identify species differences?
  • 4. HCA clustering of samples Biology Chemistry Comparison of Leaf Metabolites Informatics
  • 5. Biology Chemistry Comparison of Leaf Metabolites Informatics raw PCA: comparison of pretreatments Mean centered Auto scaled
  • 6. Biology Chemistry Identify Analysis Strategy Informatics Comparison of Leaf Metabolites Analysis Options: If the treatment is a minor effect compared to species differences: • two-sample t-Test for Species If the treatment is a has a considerable effect compared to species differences: • two-way ANOVA for Species + treatment + interaction (species/treatment) If the treatment has a similar effect size to species differences: • Eliminate one treatment type from analysis and use t-Test Conclusions: • Both PCA and HCA analyses suggests the treatment effect is minor • Using 12 compared to 6 samples per group will increased study power
  • 7. Comparison PLS-DA to O-PLS-DA Biology Chemistry Informatics O-PLS-DA is only useful over PLS-DA when the axis of separation between two groups spans >1 dimension Comparison of Leaf Metabolites PLS-DA O-PLS-DA
  • 8. Biology Chemistry Comparison of Leaf Metabolites Informatics Validation of PLS-DA model for discrimination between pumpkin and tomatillo leaf metabolites Outstanding model performance, highly unlikely by random chance
  • 9. Biology Chemistry Comparison of Leaf Metabolites Informatics Identification of top multivariate discriminants between pumpkin and tomatillo leaf primary metabolites Could also select from increasing and decreasing metabolites separately