Dr Dev Kambhampati | FY 2014 US Agricultural Trade Forecasts- USDA
•
0 gefällt mir•520 views

Dr Dev Kambhampati | FY 2014 US Agricultural Trade Forecasts- USDA

Empfohlen
Empfohlen
Weitere ähnliche Inhalte
Was ist angesagt?
Was ist angesagt? (20)
Ähnlich wie Dr Dev Kambhampati | FY 2014 US Agricultural Trade Forecasts- USDA
Ähnlich wie Dr Dev Kambhampati | FY 2014 US Agricultural Trade Forecasts- USDA (20)
Mehr von Dr Dev Kambhampati
Mehr von Dr Dev Kambhampati (20)
Kürzlich hochgeladen
Kürzlich hochgeladen (20)
Dr Dev Kambhampati | FY 2014 US Agricultural Trade Forecasts- USDA
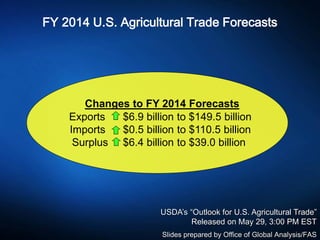
- 1. FY 2014 U.S. Agricultural Trade Forecasts Changes to FY 2014 Forecasts Exports $6.9 billion to $149.5 billion Imports $0.5 billion to $110.5 billion Surplus $6.4 billion to $39.0 billion USDA’s “Outlook for U.S. Agricultural Trade” Released on May 29, 3:00 PM EST Slides prepared by Office of Global Analysis/FAS
- 2. U.S. Agricultural Trade 0 10 20 30 40 50 60 70 80 90 100 110 120 130 140 150 '92 '94 '96 '98 '00 '02 '04 '06 '08 '10 12 14(f) Billion$ 39.0 Exports Imports Trade Surplus Records 137.4 110.5 42.9 149.5
- 3. 0 5 10 15 20 25 30 35 40 Grains and Feeds Oilseeds Livestock, Poultry, and Dairy Cotton Horticultural Products Billion$ FY 2014 ForecastsFebruary May +$4.5 Billion +$0.6 Billion -$0.4 Billion May vs. February Commodity Forecasts Large gains in grains and oilseeds; slight reduction in horticultural products +$2.4 Billion No change
- 4. Record volume for soybeans and feeds; Corn volume rebounds 0 20 40 60 80 100 120 140 160 180 2011 2012 2013 2014f MillionTons Overall volume up 31% from FY13 Other* Soybeans Feeds Wheat Coarse Grains 170 mmt166 mmt *Includes cotton, rice, soybean meal, soybean oil, beef & veal, pork, beef and pork variety meats, broiler meat, and tobacco 146 mmt 130 mmt
- 5. Record Forecast for Livestock, Poultry, and Dairy 0 5 10 15 20 25 30 35 2010 2011 2012 2013 2014f Billion$ Overall Forecast up $0.7 Billion from FY 2013 Other Dairy Beef & veal Hides & skins Dairy, beef, and hides & skins each hit historical highs
- 6. Top 10 U.S. Markets in FY2014 0 10 20 30 Philippines Indonesia Taiwan HK S. Korea EU Japan Mexico Canada China Billion $ Record Half of top markets forecast to hit records
- 7. Soybeans and Feeds Drive Higher U.S. Exports to China 0 7 14 21 Oct-Mar FY13 Oct-Mar FY14 Billion$ U.S. Exports to China In First Half of Fiscal Year Other Feeds & fodders Grains Meat & poultry Cotton Soybeans $11.7 B $14.1 B
- 8. Exports Up to China, SE Asia, EU, & S. America Change in FY 2014 Exports from February Forecast +$1.5 bil +$3.5 bil +$900 mil +$900 mil -$200 mil +$200 mil +$200 mil
- 9. Total $0.5 billion at a record of 110.5 billion Tropical Products $1.0 billion – lower prices for coffee and rubber Horticultural Products $0.2 billion – lower volume of wine Grain and Oilseeds $1.7 billion – record wheat and soybean imports Livestock & Dairy $0.1 billion – higher swine, beef, and pork imports Other Imports $0.1 billion – mainly tobacco and planting seeds FY 2014 Imports
- 10. Revised FY 2014 Forecast: $35.8 Billion $4.5 Billion 13 17 21 25 29 33 37 41 '02 '04 '06 '08 '10 '12 '14f Export Value ($Bil) Actual Feb Forecast May Forecast 2014 Key Developments Corn volume up sharply on rising global demand and less competition from Argentina Wheat prices up on tight supplies and deteriorating crop conditions DDGS and sorghum up on record demand from China Wild Cards Timing of South American corn shipments Northern Hemisphere winter wheat harvests Wheat export policies in India and Argentina Export Outlook for Grain & Feed Products
- 11. Revised FY 2014 Forecast: $33.8 Billion $2.4 Billion Export Outlook for Oilseeds & Products 2014 Key Developments Soybean volume rises on record sales to China Soybean meal volume up on stronger demand Strong demand and tight U.S. supplies boost soybean complex prices Wild Cards Argentina export activity 9 14 19 24 29 34 '02 '04 '06 '08 10 12 14f Export Value ($Bil) Actual Feb Forecast May Forecast
- 12. Revised FY 2014 Forecast: $32.2 Billion $600 Million Export Outlook for Dairy, Livestock, and Poultry 2014 Key Developments Dairy higher on strong global demand Beef up mostly on unit values due to robust global demand Poultry down on lower egg and egg product shipments Pork edges lower on tighter exportable supplies Wild Cards PED impact Ongoing SPS trade issues 10 14 18 22 26 30 34 '02 '04 '06 '08 '10 '12 '14f Export Value ($Bil) Actual Feb Forecast May Forecast
- 13. Revised FY 2014 Forecast: $4.4 Billion Unchanged Export Outlook for Cotton 2014 Key Developments China demand slows Prices remain strong Wild Cards Additional changes in China’s reserve policy Cotton yarn demand in China 0 2 4 6 8 10 '02 '04 '06 '08 10 12 14f Export Value ($Bil) Actual Feb Forecast May Forecast
- 14. Revised FY 2014 Forecast: $34.1 Billion Down $400 million Export Outlook for Horticulture Products 2014 Key Developments Tree nut growth lower as rising prices weaken Chinese demand Fresh fruit and vegetables down on lower volumes to Canada and Korea Wild Card California Drought 10 15 20 25 30 35 '02 '04 '06 '08 '10 12 14f Export Value ($Bil) Actual Feb Forecast May Forecast Record