Swells, Soundings, and Sustainability, but "Here be Monsters"

18th Annual Roger Revelle Commemorative Lecture, National Academy of Sciences Ocean Studies Board, 5:30 – 6:30 p.m. on Friday, April 28, 2017, Baird Auditorium, Smithsonian National Museum of Natural History From the stick charts of the ancient Marshall Islanders to the SONAR of World War II, humankind continues to devise ways to map the ocean. The newest maps, which are global, 3D, and increasingly intelligent, hold great promise for improving science and decision-making related to our oceans, but “here be monsters” to conquer data challenges. Join Dr. Dawn Wright, chief scientist at the Environmental Systems Research Institute (ESRI) and professor of geography and oceanography at Oregon State University, to learn about the past and present of ocean mapping and what must be done to overcome the challenges of “big data,” “dark data,” and the need to make data more resilient and more accessible to users. The Roger Revelle Commemorative Lecture is presented by the Ocean Studies Board of the National Academies of Sciences, Engineering, and Medicine in cooperation with the Smithsonian National Museum of Natural History. The lecture was created in honor of Dr. Revelle’s contributions to the ocean sciences and his dedication to making scientific knowledge available to policymakers.

Empfohlen
Empfohlen
Weitere ähnliche Inhalte
Was ist angesagt?
Was ist angesagt? (7)
Ähnlich wie Swells, Soundings, and Sustainability, but "Here be Monsters"
Ähnlich wie Swells, Soundings, and Sustainability, but "Here be Monsters" (20)
Mehr von Dawn Wright
Mehr von Dawn Wright (20)
Kürzlich hochgeladen
Kürzlich hochgeladen (20)
Swells, Soundings, and Sustainability, but "Here be Monsters"
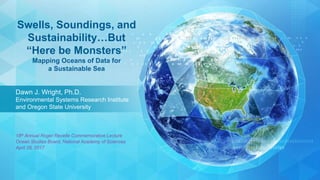
- 1. Dawn J. Wright, Ph.D. Environmental Systems Research Institute and Oregon State University Swells, Soundings, and Sustainability…But “Here be Monsters” Mapping Oceans of Data for a Sustainable Sea 18th Annual Roger Revelle Commemorative Lecture Ocean Studies Board, National Academy of Sciences April 28, 2017
- 2. Some Past History New Innovations Taming the Monsters
- 3. Swells…. Ancient Marshall Islands Stick Chart By Cullen328 (Own work) [CC BY-SA 3.0 (http://creativecommons.org/licenses/by-sa/3.0)], via Wikimedia Commons
- 4. Soundings … Single Beam Multibeam Image courtesy of NOAA and UNH Heinrich Berann, 1968 International Cartographic Association, Ken Field Image courtesy of NOAA and UNH
- 5. Soundings…. Heezen and Tharp, 1977 Hanging on Dawn’s wall
- 6. Smith and Sandwell, Science, 277: 1957-1962, 1997 Smith and Sandwell, 1997
- 7. Sustainability…. UN Sustainable Development Goals, 2016-2030
- 11. Maps for Solving the World’s Biggest Problems … the science behind the maps, as well as the science done with the maps. www.esri.com/about-esri
- 12. New Innovations
- 13. Not the map on your wall or in your glove compartment
- 14. Not the map on your wall or in your glove compartment Smarter, intelligent, linked to databases, sophisticated algorithms
- 15. Charles Minard, 1864 Global Export of British Coal Thanks to Ken Field, Esri
- 16. Charles Minard, 1864 Global Export of British Coal
- 17. Heezen and Tharp, 1977 Hanging on Dawn’s wall
- 18. Ocean Basemap, 2011-present, esriurl.com/obm
- 19. March 11, 2011 March, 2016
- 20. Title Subtitle Thanks to Ken Field, Esri
- 21. Title Subtitle Thanks to Ken Field, Esri
- 22. 3D Fence or Curtain Diagrams esriurl.com/3dfence
- 23. 3D Fence or Curtain Diagrams esriurl.com/3dfence
- 24. 3D Fence or Curtain Diagrams esriurl.com/3dfence
- 25. ArcGIS Pro
- 29. 52 Million Points and Counting: A New Stratification Approach for Mapping Global Marine Ecosystems AGU Fall Meeting, 16 December 2016 IN53E-02 (Invited) Dawn Wright, Chief Scientist, Environmental Systems Research Institute (aka Esri) Affiliated Professor, Oregon State University dwright@esri.com Roger Sayre (USGS), Sean Breyer, Kevin A. Butler, Keith VanGraafeiland (Esri), Kathy Goodin (NatureServe), Maria Kavanaugh (WHOI), Mark Costello (U. of Auckland), Noel Cressie (U. of Wollongong), Zeenatul Basher (USGS), Peter T. Harris (GRID-Arendal), John M. Guinotte (USFWS)
- 30. Based on NOAA’s World Ocean Atlas 2013 v. 2 Nitrate Silicate Phosphate Temperature* Salinity Dissolved Oxygen e.g., *Locarnini, R.A., A.V. Mishonov, J.I. Antonov, T.P. Boyer, H.E. Garcia, O.K. Baranova, and others. 2013. World Ocean Atlas 2013 version 2 (WOA13 V2), Volume 1: Temperature. In: NOAA National Centers for Environmental Information S. Levitus, ed, and A. Mishonov, technical ed, NOAA Atlas NESDIS 73, doi:10.7289/V55X26VD, www.nodc.noaa.gov/OC5/woa13/ 0 m 5500 m 100 m 100 m 5 m 10 m 25 m
- 31. EMU 3D Point Mesh Framework UnitTop SurfaceArea 5500 m 100 m 100 m 5 m 10 m 25 m 0 m 5500 m Feature Attributes Depth_Level Temperature Salinity Dissolved Oxygen Nitrate Silicate Phosphate MODIS Ocean Color PointID QuarterID UnitTop (m) UnitMiddle (m) UnitBottom (m) Thickness (m) ThicknessPos (m) EMUID EMU Name GeomorphologyBase GeomorphologyFeatures SurfaceArea Volume, SpecialCases 0 m UnitBottom Unit Middle Thickness Volume World Ocean Atlas EMUPoints • K-means statistical clustering • Backwards stepwise discriminant analysis • Pseudo F-statistic 37 clusters • Canonical discriminant analysis
- 32. EMU 13 Summary Technical Name: • Bathypelagic • Very Cold • Euhaline • Hypoxic • High Nitrate • Medium Phosphate • High Silicate Common Name: • Deep • Very Cold • Normal Salinity • Low Oxygen • High Nitrate • Medium Phosphate • High Silicate
- 34. MobileApp App Store (iOS) or Google Play (Android)
- 36. www.esri.com/ecological-marine-units esriurl.com/emudata Nature news feature, 3 January 2017 Sayre et al., 2017, Oceanography, 30(1): 90-103
- 37. “Yer off the edge of the map, mate. Here there be monsters!” -- Captain Barbossa, Pirates of the Caribbean: The Curse of the Black Pearl
- 39. Thanks to Carthage Smith (Org for Economic Cooperation & Development), Heidi Laine (U. Helsinki) Research Data Alliance Plenary 7 The Challenge of “Open Science” Providing a Platform for Open and Effective Access Research Data, Materials Scientific Pubs Access for Scientists, Companies, the Public Digital Applications Source Code Re-Asserting Science as a Global Public Good
- 40. The Challenge of “Open Science” Providing a Platform for Open and Effective Access Research Data, Materials Scientific Pubs Access for Scientists, Companies, the Public Digital Applications Source Code Re-Asserting Science as a Global Public Good dusk.geo.orst.edu/ec-story
- 41. … of a Fourth Paradigm 2008 2009 2011
- 42. Some Things That I Like …Volume
- 43. Grounding of USS San Francisco on Uncharted Guyot 1 Sailor Killed, 115 Injured, January 2005 Image courtesy of Dave Sandwell, Scripps www.gebco.net Picard et al., Eos, March 2017
- 44. Some Things That I Like …Velocity
- 45. Some Things That I Like …Variety
- 46. NRC (2011) Critical Infrastructure for Ocean Research and Societal Needs in 2030
- 47. Values
- 48. …deal with changes, threats Re•sil•ience [n.] …absorb disturbance, stress, catastrophe …recover quickly to a prior desired state
- 49. …deal with changes, threats Re•sil•ience [n.] …absorb disturbance, stress, catastrophe …recover quickly to a prior desired state 3 ideas esriurl.com/resilientdata
- 50. Inspired by Mark Gahegan, U. of Auckland, RDA 5th Plenary (1) Making Data & Code “Available” is NOT ENOUGH We need to be more open about what we do WITH them!
- 51. (1) Making Data & Code “Available” is NOT ENOUGH We need to be more open about what we do WITH them! esriurl.com/workflows esriurl.com/3dfences
- 52. (2) To Make it Reproducible, Make it Virtual. Digital Object Identifiers, “Containers,” and more . . .
- 53. (3) “Once upon a time . . .”
- 54. “Stories are data with a soul . . . persuasive and memorable.” Nancy Baron | Director of Science Outreach COMPASS Science Communication, Inc.
- 55. By Charles Saxon | Published March 21, 1983 Licensed personally to Dawn Wright by The New Yorker Cartoon Bank, TCB-86966, Invoice L12480
- 56. The Power of Storytelling Science Communication a growing movement in the community. esriurl.com/ocnstories
- 57. The Power of Storytelling “Story Maps” esriurl.com/ocnstories
- 58. The Power of Storytelling ”Story Maps” esriurl.com/ocnstories
- 62. UN Sustainable Goal 14 Conserve and sustainably use the oceans, seas, and marine resources Estimate of Plastic Pollution in the World’s Oceans (km2)
- 63. Biodiversity Philippines River Discharge, Pollution Outflow Mexico Reef Health Cook Islands Coral Habitats and Fishing Density Southern California Tsunami Inundation Modeling Pacific Northwest Australia Marine Reserve Planning Coral Reef Monitoring Martinique South Carolina Sea Level Rise Siting Offshore Aquaculture Gulf of Mexico Marine Debris Tracking Gulf of Mexico, Loop Current
- 64. Throughout a Geographic “Nervous System” of Planet Ocean... Planning and Policy Prediction (where appropriate) Decision Making Analysis and Modeling Action Ocean Observations For the “Science of Where”TM in the Oceans “Smart Maps” Provide a Framework and Process
- 65. Best wishes to you in your work Dawn Wright Email: dwright@esri.com Twitter: @deepseadawn esriurl.com/revelle esriurl.com/scicomm