DECC Headline Impact Indicators
•Als PPTX, PDF herunterladen•
0 gefällt mir•353 views

DECC Headline Impact Indicators

Empfohlen
Empfohlen
Weitere ähnliche Inhalte
Was ist angesagt?
Was ist angesagt? (20)
Andere mochten auch
Ähnlich wie DECC Headline Impact Indicators
Ähnlich wie DECC Headline Impact Indicators (20)
Mehr von Department of Energy and Climate Change
Mehr von Department of Energy and Climate Change (12)
Kürzlich hochgeladen
Kürzlich hochgeladen (20)
DECC Headline Impact Indicators
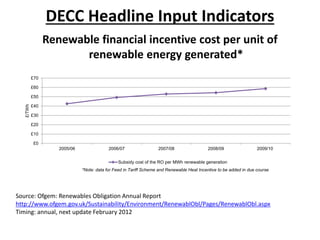
- 1. DECC Headline Input Indicators Renewable financial incentive cost per unit of renewable energy generated* Source: Ofgem: Renewables Obligation Annual Report http://www.ofgem.gov.uk/Sustainability/Environment/RenewablObl/Pages/RenewablObl.aspx Timing: annual, next update February 2012 £0 £10 £20 £30 £40 £50 £60 £70 2005/06 2006/07 2007/08 2008/09 2009/10 £/TWh Subsidy cost of the RO per MWh renewable generation *Note: data for Feed in Tariff Scheme and Renewable Heat Incentive to be added in due course
- 2. Leverage of UK international climate change finance* *Note: Leverage ratio figures shown in brackets, average ratio for all countries = 8.3 Source: DECC based on data from Climate Investment Funds http://www.climateinvestmentfunds.org Timing: biannual, next update September 2011 (10.0) (5.4) (7.4) (3.9) (10.1) (14.8) (13.2) (5.8) (11.4) $0 $1,000 $2,000 $3,000 $4,000 $5,000 $6,000 $7,000 Morocco Egypt Turkey South Africa Philippines Vietnam Thailand Middle East and North Africa Mexico Millions Clean Technology Fund Co-Financing (private finance, Multilateral Development Banks contributions and National Government funding)
- 3. Proportion of the Nuclear Decommissioning Authority’s budget spent on decommissioning and cleaning up nuclear plants* *Note: Decommissioning and clean up costs including capital expenditure for new plant to undertake clean up operations, e.g. building a machine to extract waste safely. Source: Nuclear Decommissioning Authority - annual report and accounts https://www.nda.gov.uk/aboutus/ Timing: annual, next update July 2011 0% 10% 20% 30% 40% 50% 60% 70% 80% 90% 100% 2005-06 2006-07 2007-08 2008-09 2009-10
- 4. DECC Headline Impact Indicators Number of energy efficiency installations Source: DECC (Experimental Official Statistics) http://www.decc.gov.uk/en/content/cms/statistics/en_effic_stats/en_effic_stats.aspx Timing: quarterly, next update September 2011 0 2,000 4,000 6,000 8,000 10,000 12,000 14,000 Apr 2007 Apr 2008 Oct 2008 Jan 2009 Apr 2009 Jul 2009 Oct 2009 Jan 2010 Apr 2010 Jul 2010 Oct 2010 Jan 2011 Apr 2011 Thousands Cavity wall insulation Loft insulation >125mm
- 5. Number of households in Fuel Poverty* *Note: 2010 and 2011 figures for England are projected from 2009 position Source: DECC (National Statistics) http://www.decc.gov.uk/en/content/cms/statistics/fuelpov_stats/fuelpov_stats.aspx Timing: annual, next update July 2012 0 1 2 3 4 5 6 7 1996 1997 1998 1999 2000 2001 2002 2003 2004 2005 2006 2007 2008 2009 2010 2011 Numberoffuelpoorhouseholds (millions) UK England
- 6. Percentage of final energy consumption from renewable sources Source: DECC (National Statistics) http://www.decc.gov.uk/en/content/cms/statistics/publications/trends/trends.aspx Timing: annual, next update 28 June 2012 0.0% 0.5% 1.0% 1.5% 2.0% 2.5% 3.0% 3.5% 4.0% 2004 2005 2006 2007 2008 2009 2010 Percentage
- 7. Spare electricity and gas ‘capacity’ margins Source: DECC (National Statistics) and National Grid http://www.decc.gov.uk/en/content/cms/statistics/publications/brief/brief.aspx Timing: annual, next update 26 July 2012 0 15 30 45 60 75 90 0 2 4 6 8 10 12 93/94 94/95 95/96 96/97 97/98 98/99 99/00 00/01 01/02 02/03 03/04 04/05 05/06 06/07 07/08 08/09 09/10 10/11 GW TWh/day winter Forecast maximum gas supply (left hand scale) Actual maximum gas demand (left hand scale) Total electricity declared net capacity (right hand scale) Simultaneous maximum electricity load met (right hand scale) Gas margin Electricity margin
- 8. The impact of other countries’ pledges to decrease their greenhouse gas emissions on predicted global emissions Source: DECC based on data from the United Nations Environment Programme Emission Gap Report http://www.unep.org/publications/ebooks/emissionsgapreport/ Timing: annual, next update November 2011 30 35 40 45 50 55 60 1990 1995 2000 2005 2010 2015 2020 GlobalGHGEmissions(GtCO2e) High Copenhagen Accord Offers 49 Gt Global Business As Usual emissions 48Gt 44Gt Late Peaking 2°C Trajectory (based on LSE/Met Office) Climate Responsible 2°C Trajectory (based on UNEP) High Accord offers assumes: •High ambition pledges (conditional) are delivered in full •Surplus AAUs not used •Strict LULUCF rules An Unconditional pledges scenario with lenient accounting would lead to emissions of around 53Gt The aim is to work in the UK, within the EU and internationally to ensure effective delivery of pledges and increased ambition to reduce the gap between 2020 projected emissions and a cost-effective 2 degree pathway to zero. Low Copenhagen Accord Offers (with loose accounting) 53 Gt
- 9. UK Greenhouse Gas emissions levels: progress against statutory carbon budgets Source: DECC (National Statistics) http://www.decc.gov.uk/en/content/cms/statistics/climate_change/gg_emissions/uk_emissions/uk_em issions.aspx Timing: annual, next update 7 February 2012 0 100 200 300 400 500 600 700 800 1990 1991 1992 1993 1994 1995 1996 1997 1998 1999 2000 2001 2002 2003 2004 2005 2006 2007 2008 2009 2010(p) 2011 2012 2013 2014 2015 2016 2017 2018 2019 2020 2021 2022 MilliontonnesCO2/CO2equivalent UK non-CO2 greenhouse gas emissions UK net CO2 emissions (emissions minus removals) 2050 target of at least 80% reduction from 1990 levels UK net emissions including the effect of trading under the EU ETS / (from 2008) net UK carbon account 2008-12 carbon budget 2013-17 carbon budget 2018-22 carbon budget Actual Forecast Kyoto Protocol Target
- 10. Reduction in the Nuclear Liabilities Estimate through decommissioning and clean-up* *Note: Total value of work completed in the year, offset by any increase in the NLE as a result of financing costs (unwind of discount and effect of inflation) and any change in scope. Source: Nuclear Decommissioning Authority - annual report and accounts https://www.nda.gov.uk/aboutus/ Timing: annual, next update July 2011 0.0 0.2 0.4 0.6 0.8 1.0 1.2 1.4 1.6 1.8 2.0 2005-06 2006-07 2007-08 2008-09 2009-10 £billions Provision discharged
- 11. The proportion of all UK energy generation from low carbon sources Source: DECC (National Statistics) http://www.decc.gov.uk/en/content/cms/statistics/publications/dukes/dukes.aspx Timing: annual, next update 26 July 2012 0% 2% 4% 6% 8% 10% 12% 2000 2001 2002 2003 2004 2005 2006 2007 2008 2009 2010