SlideShare ist ein Scribd-Unternehmen logo
1 von 10
Vogel’s Approximation Method (VAM)
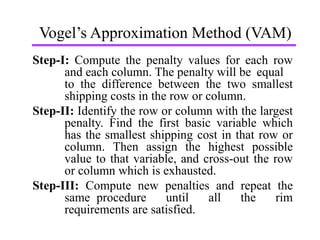
Step-I: Compute the penalty values for each row
and each column. The penalty will be equal
to the difference between the two smallest
shipping costs in the row or column.
Step-II: Identify the row or column with the largest
penalty. Find the first basic variable which
has the smallest shipping cost in that row or
column. Then assign the highest possible
value to that variable, and cross-out the row
or column which is exhausted.
Step-III: Compute new penalties and repeat the
same procedure until all the rim
requirements are satisfied.
An example for Vogel’s Method
Find the IBFS of the following transportation problem by using Penalty
Method.
Supply
6 7 8
15 80 78
D1 D2 D3
15 5 5
10
15
O1
O2
Demand
Step 1: Compute the penalties in each row and
each column .
Supply Row Penalty
6 7 8
15 80 78
Demand
Column Penalty 15-6=9 80-7=73 78-8=70
7-6=1
78-15=63
15 5 5
10
15
Step 2: Identify the largest penalty and choose
least cost cell to corresponding this penalty
Supply Row Penalty
6 7 8
15 80 78
Demand
Column Penalty 15-6=9 80-7=73 78-8=70
7-6=1
78-15=63
15 5 5
10
15
Step-3: Allocate the amount 5 which is minimum of
corresponding row supply and column demand and
then cross out column2
Supply Row Penalty
5
6 7 8
15 80 78
Demand
Column Penalty 15-6=9 80-7=73 78-8=70
7-6=1
78-15=63
15 5 5
10
15
Step-4: Recalculate the penalties
Supply Row Penalty
5
6 7 8
15 80 78
Demand
Column Penalty 15-6=9 78-8=70
8-6=2
78-15=63
15 X 5
5
15
Step-5: Identify the largest penalty and choose
least cost cell to corresponding this penalty
Supply Row Penalty
5
6 7 8
15 80 78
Demand
Column Penalty 15-6=9 78-8=70
8-6=2
78-15=63
15 X 5
5
15
Step-6: Allocate the amount 5 which is minimum of
corresponding row supply and column demand, then
cross out column3
Supply Row Penalty
5 5
6 7 8
15 80 78
Demand
Column Penalty 15-6=9
8-6=2
78-15=63
15 X X
5
15
Step-7: Finally allocate the values 0 and 15 to
corresponding cells and cross out column 1
Supply
0 5 5
6 7 8
15
15 80 78
Demand X X X
X
X
D3
O1
O2
D1 D2
Solution of the problem
Now the Initial Basic Feasible Solution of the
transportation problem is
X11=0, X12=5, X13=5, and X21=15 and
Total transportation cost = (0x6)+(5x7)+(5x8)+(15x15)
= 0+35+40+225
= 300.

Weitere ähnliche Inhalte

Ähnlich wie vam.ppt

Lecture 7 transportation problem finding initial basic feasible solution
Lecture 7 transportation problem finding initial basic feasible solutionLecture 7 transportation problem finding initial basic feasible solution
Lecture 7 transportation problem finding initial basic feasible solution
Aathi Suku
 
Transportatopn problm
Transportatopn problmTransportatopn problm
Transportatopn problm
Anshul Singh
 

Ähnlich wie vam.ppt (20)

Vogel's Approximation Method
Vogel's Approximation MethodVogel's Approximation Method
Vogel's Approximation Method
 
Transportation problem
Transportation problemTransportation problem
Transportation problem
 
Transportation Problem
Transportation ProblemTransportation Problem
Transportation Problem
 
Substation grounding grid design using Alternative Transients Program-ATP and...
Substation grounding grid design using Alternative Transients Program-ATP and...Substation grounding grid design using Alternative Transients Program-ATP and...
Substation grounding grid design using Alternative Transients Program-ATP and...
 
Msa la
Msa laMsa la
Msa la
 
Assign transportation
Assign transportationAssign transportation
Assign transportation
 
Lecture 7 transportation problem finding initial basic feasible solution
Lecture 7 transportation problem finding initial basic feasible solutionLecture 7 transportation problem finding initial basic feasible solution
Lecture 7 transportation problem finding initial basic feasible solution
 
Fn methods em08
Fn methods em08Fn methods em08
Fn methods em08
 
Needleman-wunch algorithm harshita
Needleman-wunch algorithm  harshitaNeedleman-wunch algorithm  harshita
Needleman-wunch algorithm harshita
 
IRJET- Wallace Tree Multiplier using MFA Counters
IRJET-  	  Wallace Tree Multiplier using MFA CountersIRJET-  	  Wallace Tree Multiplier using MFA Counters
IRJET- Wallace Tree Multiplier using MFA Counters
 
Vogel’s Approximation Method (VAM)
Vogel’s Approximation Method (VAM)Vogel’s Approximation Method (VAM)
Vogel’s Approximation Method (VAM)
 
LCM unbalanced.pptx
LCM unbalanced.pptxLCM unbalanced.pptx
LCM unbalanced.pptx
 
Top schools in ghaziabad
Top schools in ghaziabadTop schools in ghaziabad
Top schools in ghaziabad
 
algorithmdivs
algorithmdivsalgorithmdivs
algorithmdivs
 
algorithmdivs
algorithmdivsalgorithmdivs
algorithmdivs
 
Transportation Problem- Stepping Stone Method
Transportation Problem- Stepping Stone Method Transportation Problem- Stepping Stone Method
Transportation Problem- Stepping Stone Method
 
DTS procedure
DTS procedureDTS procedure
DTS procedure
 
Transportatopn problm
Transportatopn problmTransportatopn problm
Transportatopn problm
 
Generalized Logistic Regression - by example (Anthony Kilili)
Generalized Logistic Regression - by example (Anthony Kilili)Generalized Logistic Regression - by example (Anthony Kilili)
Generalized Logistic Regression - by example (Anthony Kilili)
 
IRJET- Developed Method for Optimal Solution of Transportation Problem
IRJET- Developed Method for Optimal Solution of Transportation ProblemIRJET- Developed Method for Optimal Solution of Transportation Problem
IRJET- Developed Method for Optimal Solution of Transportation Problem
 

Mehr von debmahuya (8)

project monitoring_and_control in project mgt
project monitoring_and_control in project mgtproject monitoring_and_control in project mgt
project monitoring_and_control in project mgt
 
New Microsoft Office PowerPoint Presentation.pptx
New Microsoft Office PowerPoint Presentation.pptxNew Microsoft Office PowerPoint Presentation.pptx
New Microsoft Office PowerPoint Presentation.pptx
 
Introduction to Retail Business.pptx
Introduction to Retail Business.pptxIntroduction to Retail Business.pptx
Introduction to Retail Business.pptx
 
4 Ps of Marketing.ppt
4 Ps of Marketing.ppt4 Ps of Marketing.ppt
4 Ps of Marketing.ppt
 
Levels of measurement
Levels of measurementLevels of measurement
Levels of measurement
 
Vam
VamVam
Vam
 
Sampling
SamplingSampling
Sampling
 
Statistics basics
Statistics basicsStatistics basics
Statistics basics
 

Kürzlich hochgeladen

Russian Escort Service in Delhi 11k Hotel Foreigner Russian Call Girls in Delhi
Russian Escort Service in Delhi 11k Hotel Foreigner Russian Call Girls in DelhiRussian Escort Service in Delhi 11k Hotel Foreigner Russian Call Girls in Delhi
Russian Escort Service in Delhi 11k Hotel Foreigner Russian Call Girls in Delhi
kauryashika82
 
1029 - Danh muc Sach Giao Khoa 10 . pdf
1029 -  Danh muc Sach Giao Khoa 10 . pdf1029 -  Danh muc Sach Giao Khoa 10 . pdf
1029 - Danh muc Sach Giao Khoa 10 . pdf
QucHHunhnh
 
An Overview of Mutual Funds Bcom Project.pdf
An Overview of Mutual Funds Bcom Project.pdfAn Overview of Mutual Funds Bcom Project.pdf
An Overview of Mutual Funds Bcom Project.pdf
SanaAli374401
 
1029-Danh muc Sach Giao Khoa khoi 6.pdf
1029-Danh muc Sach Giao Khoa khoi  6.pdf1029-Danh muc Sach Giao Khoa khoi  6.pdf
1029-Danh muc Sach Giao Khoa khoi 6.pdf
QucHHunhnh
 
Seal of Good Local Governance (SGLG) 2024Final.pptx
Seal of Good Local Governance (SGLG) 2024Final.pptxSeal of Good Local Governance (SGLG) 2024Final.pptx
Seal of Good Local Governance (SGLG) 2024Final.pptx
negromaestrong
 
Making and Justifying Mathematical Decisions.pdf
Making and Justifying Mathematical Decisions.pdfMaking and Justifying Mathematical Decisions.pdf
Making and Justifying Mathematical Decisions.pdf
Chris Hunter
 

Kürzlich hochgeladen (20)

Paris 2024 Olympic Geographies - an activity
Paris 2024 Olympic Geographies - an activityParis 2024 Olympic Geographies - an activity
Paris 2024 Olympic Geographies - an activity
 
Application orientated numerical on hev.ppt
Application orientated numerical on hev.pptApplication orientated numerical on hev.ppt
Application orientated numerical on hev.ppt
 
Z Score,T Score, Percential Rank and Box Plot Graph
Z Score,T Score, Percential Rank and Box Plot GraphZ Score,T Score, Percential Rank and Box Plot Graph
Z Score,T Score, Percential Rank and Box Plot Graph
 
Mehran University Newsletter Vol-X, Issue-I, 2024
Mehran University Newsletter Vol-X, Issue-I, 2024Mehran University Newsletter Vol-X, Issue-I, 2024
Mehran University Newsletter Vol-X, Issue-I, 2024
 
Unit-IV; Professional Sales Representative (PSR).pptx
Unit-IV; Professional Sales Representative (PSR).pptxUnit-IV; Professional Sales Representative (PSR).pptx
Unit-IV; Professional Sales Representative (PSR).pptx
 
Key note speaker Neum_Admir Softic_ENG.pdf
Key note speaker Neum_Admir Softic_ENG.pdfKey note speaker Neum_Admir Softic_ENG.pdf
Key note speaker Neum_Admir Softic_ENG.pdf
 
Introduction to Nonprofit Accounting: The Basics
Introduction to Nonprofit Accounting: The BasicsIntroduction to Nonprofit Accounting: The Basics
Introduction to Nonprofit Accounting: The Basics
 
Measures of Central Tendency: Mean, Median and Mode
Measures of Central Tendency: Mean, Median and ModeMeasures of Central Tendency: Mean, Median and Mode
Measures of Central Tendency: Mean, Median and Mode
 
This PowerPoint helps students to consider the concept of infinity.
This PowerPoint helps students to consider the concept of infinity.This PowerPoint helps students to consider the concept of infinity.
This PowerPoint helps students to consider the concept of infinity.
 
Russian Escort Service in Delhi 11k Hotel Foreigner Russian Call Girls in Delhi
Russian Escort Service in Delhi 11k Hotel Foreigner Russian Call Girls in DelhiRussian Escort Service in Delhi 11k Hotel Foreigner Russian Call Girls in Delhi
Russian Escort Service in Delhi 11k Hotel Foreigner Russian Call Girls in Delhi
 
1029 - Danh muc Sach Giao Khoa 10 . pdf
1029 -  Danh muc Sach Giao Khoa 10 . pdf1029 -  Danh muc Sach Giao Khoa 10 . pdf
1029 - Danh muc Sach Giao Khoa 10 . pdf
 
An Overview of Mutual Funds Bcom Project.pdf
An Overview of Mutual Funds Bcom Project.pdfAn Overview of Mutual Funds Bcom Project.pdf
An Overview of Mutual Funds Bcom Project.pdf
 
Class 11th Physics NEET formula sheet pdf
Class 11th Physics NEET formula sheet pdfClass 11th Physics NEET formula sheet pdf
Class 11th Physics NEET formula sheet pdf
 
1029-Danh muc Sach Giao Khoa khoi 6.pdf
1029-Danh muc Sach Giao Khoa khoi  6.pdf1029-Danh muc Sach Giao Khoa khoi  6.pdf
1029-Danh muc Sach Giao Khoa khoi 6.pdf
 
Presentation by Andreas Schleicher Tackling the School Absenteeism Crisis 30 ...
Presentation by Andreas Schleicher Tackling the School Absenteeism Crisis 30 ...Presentation by Andreas Schleicher Tackling the School Absenteeism Crisis 30 ...
Presentation by Andreas Schleicher Tackling the School Absenteeism Crisis 30 ...
 
Unit-V; Pricing (Pharma Marketing Management).pptx
Unit-V; Pricing (Pharma Marketing Management).pptxUnit-V; Pricing (Pharma Marketing Management).pptx
Unit-V; Pricing (Pharma Marketing Management).pptx
 
Explore beautiful and ugly buildings. Mathematics helps us create beautiful d...
Explore beautiful and ugly buildings. Mathematics helps us create beautiful d...Explore beautiful and ugly buildings. Mathematics helps us create beautiful d...
Explore beautiful and ugly buildings. Mathematics helps us create beautiful d...
 
Seal of Good Local Governance (SGLG) 2024Final.pptx
Seal of Good Local Governance (SGLG) 2024Final.pptxSeal of Good Local Governance (SGLG) 2024Final.pptx
Seal of Good Local Governance (SGLG) 2024Final.pptx
 
Making and Justifying Mathematical Decisions.pdf
Making and Justifying Mathematical Decisions.pdfMaking and Justifying Mathematical Decisions.pdf
Making and Justifying Mathematical Decisions.pdf
 
Web & Social Media Analytics Previous Year Question Paper.pdf
Web & Social Media Analytics Previous Year Question Paper.pdfWeb & Social Media Analytics Previous Year Question Paper.pdf
Web & Social Media Analytics Previous Year Question Paper.pdf
 

vam.ppt

  • 1. Vogel’s Approximation Method (VAM) Step-I: Compute the penalty values for each row and each column. The penalty will be equal to the difference between the two smallest shipping costs in the row or column. Step-II: Identify the row or column with the largest penalty. Find the first basic variable which has the smallest shipping cost in that row or column. Then assign the highest possible value to that variable, and cross-out the row or column which is exhausted. Step-III: Compute new penalties and repeat the same procedure until all the rim requirements are satisfied.
  • 2. An example for Vogel’s Method Find the IBFS of the following transportation problem by using Penalty Method. Supply 6 7 8 15 80 78 D1 D2 D3 15 5 5 10 15 O1 O2 Demand
  • 3. Step 1: Compute the penalties in each row and each column . Supply Row Penalty 6 7 8 15 80 78 Demand Column Penalty 15-6=9 80-7=73 78-8=70 7-6=1 78-15=63 15 5 5 10 15
  • 4. Step 2: Identify the largest penalty and choose least cost cell to corresponding this penalty Supply Row Penalty 6 7 8 15 80 78 Demand Column Penalty 15-6=9 80-7=73 78-8=70 7-6=1 78-15=63 15 5 5 10 15
  • 5. Step-3: Allocate the amount 5 which is minimum of corresponding row supply and column demand and then cross out column2 Supply Row Penalty 5 6 7 8 15 80 78 Demand Column Penalty 15-6=9 80-7=73 78-8=70 7-6=1 78-15=63 15 5 5 10 15
  • 6. Step-4: Recalculate the penalties Supply Row Penalty 5 6 7 8 15 80 78 Demand Column Penalty 15-6=9 78-8=70 8-6=2 78-15=63 15 X 5 5 15
  • 7. Step-5: Identify the largest penalty and choose least cost cell to corresponding this penalty Supply Row Penalty 5 6 7 8 15 80 78 Demand Column Penalty 15-6=9 78-8=70 8-6=2 78-15=63 15 X 5 5 15
  • 8. Step-6: Allocate the amount 5 which is minimum of corresponding row supply and column demand, then cross out column3 Supply Row Penalty 5 5 6 7 8 15 80 78 Demand Column Penalty 15-6=9 8-6=2 78-15=63 15 X X 5 15
  • 9. Step-7: Finally allocate the values 0 and 15 to corresponding cells and cross out column 1 Supply 0 5 5 6 7 8 15 15 80 78 Demand X X X X X D3 O1 O2 D1 D2
  • 10. Solution of the problem Now the Initial Basic Feasible Solution of the transportation problem is X11=0, X12=5, X13=5, and X21=15 and Total transportation cost = (0x6)+(5x7)+(5x8)+(15x15) = 0+35+40+225 = 300.