
Empfohlen
Weitere ähnliche Inhalte
Was ist angesagt?
Was ist angesagt? (20)
Ähnlich wie Deblina Dey - Resume
Ähnlich wie Deblina Dey - Resume (20)
Deblina Dey - Resume
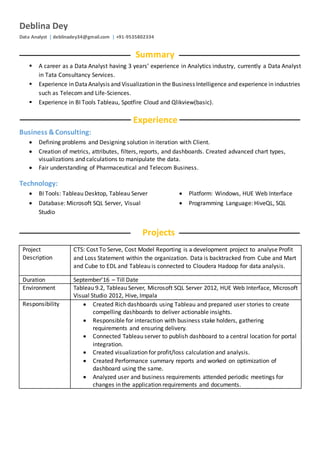
- 1. Deblina Dey Data Analyst | deblinadey34@gmail.com | +91-9535802334 Summary A career as a Data Analyst having 3 years’ experience in Analytics industry, currently a Data Analyst in Tata Consultancy Services. Experience in DataAnalysis and Visualizationin the Business Intelligence and experience in industries such as Telecom and Life-Sciences. Experience in BI Tools Tableau, Spotfire Cloud and Qlikview(basic). Experience Business &Consulting: Defining problems and Designing solution in iteration with Client. Creation of metrics, attributes, filters, reports, and dashboards. Created advanced chart types, visualizations and calculations to manipulate the data. Fair understanding of Pharmaceutical and Telecom Business. Technology: BI Tools: Tableau Desktop, Tableau Server Database: Microsoft SQL Server, Visual Studio Platform: Windows, HUE Web Interface Programming Language: HiveQL, SQL Projects Project Description CTS: Cost To Serve, Cost Model Reporting is a development project to analyse Profit and Loss Statement within the organization. Data is backtracked from Cube and Mart and Cube to EDL and Tableau is connected to Cloudera Hadoop for data analysis. Duration September’16 – Till Date Environment Tableau 9.2, Tableau Server, Microsoft SQL Server 2012, HUE Web Interface, Microsoft Visual Studio 2012, Hive, Impala Responsibility Created Rich dashboards using Tableau and prepared user stories to create compelling dashboards to deliver actionable insights. Responsible for interaction with business stake holders, gathering requirements and ensuring delivery. Connected Tableau server to publish dashboard to a central location for portal integration. Created visualization for profit/loss calculation and analysis. Created Performance summary reports and worked on optimization of dashboard using the same. Analyzed user and business requirements attended periodic meetings for changes in the application requirements and documents.
- 2. Project Description RMG is an HR functional that deals with fulfillment and management of the allocated and unallocated resources within TCS. Duration Jun’15 – Jun’16 Environment Office 2013 (Excel), Tableau 9. Responsibility Created various reports for top management to analyze unallocated resource data, for optimum utilization of resources and for decision-making. Validate source data from different branches and merge that data into single source and organizing the employee data. Managing un-allocated data and reports Publishing of dashboards on weekly, monthly quarterly basis. Fulfillment of other RMG parameters. Project Description Project requirement is to analyze hardware data and hardware tracking within the organization. Used Spotfire Cloud for visualization and data analysis. Duration Apr’14- May’ 15 Environment Spotfire Cloud, HTML5 Responsibility Used HTML5 to build webpages. Data Analysis to build reports. Worked on reports specification and reports data testing. Achievements Awarded multiple Spot Awards and Appreciations. Academic History Bangalore Institute of Technology, Bangalore, Karnataka, India Bachelor of Computer Science and Engineering (2009 -2013) -70.6 % Assembly of God Church School, Purulia, West Bengal, India Senior secondary high school (2009) – 70.66% Assembly of God Church School, Purulia, West Bengal, India Secondary high school (2007) – 80.6% Personal Detail Date of Birth: 27th April 1991 Languages Known: English, Hindi and Bengali Project Description HAMR: Hardware Asset Management Reporting is a development project to analyse hardware usage and hardware tracking within the organization. Data is coming from various downstream systems into warehouse and on top of that Tableau is used for data analysis. Duration Jul’16 – August’16 Environment Tableau 9.0, SQL Server Responsibility Developed various Dashboards, Data Visualizations and reports in Tableau 9.0. Implemented action filters, parameters, calculated fields and sets for preparing dashboards and workbooks in Tableau. Created Tableau dashboards and Visualizations using Stack bars, bar graphs, scattered plots, geographical maps, Gantt charts. Developed parameter and dimension based reports, drill-down reports, charts, and Tabular reports using Tableau Desktop. Used multiple data sources to create dashboards. Used Custom SQL Query.