09 05 05 Web 2.0 Weekly
•
0 gefällt mir•502 views

The document summarizes activity in the Web 2.0 sector for April 2009. It notes that April saw the fewest financings of any month that year, totaling $144.5 million across 21 deals. However, Disney's investment in Hulu was a strategic move bringing three major media companies together in online video distribution. The document also highlights that the video sector saw the most capital raised over the prior three months, which could indicate future trends.

Empfohlen
Weitere ähnliche Inhalte
Was ist angesagt?
Was ist angesagt? (18)
Andere mochten auch
Ähnlich wie 09 05 05 Web 2.0 Weekly
Mehr von David Shore
Mehr von David Shore (19)
Kürzlich hochgeladen
Kürzlich hochgeladen (20)
09 05 05 Web 2.0 Weekly
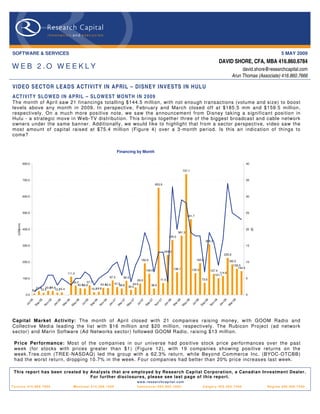
- 1. SOFTWARE & SERVICES 5 MAY 2009 DAVID SHORE, CFA, MBA 416.860.6784 WEB 2.O WEEKLY david.shore@researchcapital.com Arun Thomas (Associate) 416.860.7666 VIDEO SECTOR LEADS ACTIVITY IN APRIL – DISNEY INVESTS IN HULU ACT I VIT Y SL O W ED I N AP RIL – SL OW E ST MO NT H I N 2 009 The month of April saw 21 financings totalling $144.5 million, with not enough transactions (volume and size) to boost levels above any month in 2009. In perspective, February and March closed off at $185.5 mm and $159.5 million, respectively. On a much more positive note, we saw the announcement from Disney taking a significant position in Hulu - a strategic move in W eb-TV distribution. This brings together three of the biggest broadcast and cable network owners under the same banner. Additionally, we would like to highlight that from a sector perspective, video saw the most amount of capital raised at $75.4 million (Figure 4) over a 3-month period. Is this an indication of things to come? Financing by Month 800.0 40 737.1 700.0 35 653.9 600.0 30 500.0 25 461.7 (US$mm) (#) 400.0 20 361.3 335.0 308.3 300.0 15 244.0 225.8 193.0 192.6 185.5 200.0 10 159.5 144.5 138.1 132.3 129.0 127.4 114.6 111.0 101.1 87.3 85.5 100.0 5 73.6 71.5 69.0 57.7 56.3 47.5 45.6 43.4 42.0 40.5 38.8 38.8 38.6 30.0 24.4 15.4 21.4 23.9 13.2 18.8 16.5 12.5 8.0 0.0 0 05 6 06 7 7 8 08 5 05 06 6 6 06 07 7 7 07 08 8 8 08 09 9 -0 -0 -0 l -0 -0 l -0 -0 l -0 -0 -0 l -0 -0 v- v- v- p- n- p- n- p- n- p- n- ay ay ov ay ar ar ar ar Ju Ju Ju Ju No No No Se Ja Se Ja Se Ja Se Ja M M M M N M M M Capital Market Activity: The month of April closed with 21 companies raising money, with GOOM Radio and Collective Media leading the list with $16 million and $20 million, respectively. The Rubicon Project (ad network sector) and Marin Software (Ad Networks sector) followed GOOM Radio, raising $13 million. Price Performance: Most of the companies in our universe had positive stock price performances over the past week (for stocks with prices greater than $1) (Figure 12), with 19 companies showing positive returns on the week.Tree.com (TREE-NASDAQ) led the group with a 62.3% return, while Beyond Commerce Inc. (BYOC-OTCBB) had the worst return, dropping 10.7% in the week. Four companies had better than 20% price increases last week. This report has been created b y Anal ysts that are emplo yed b y Research Capital Corporation, a Canadian Investment Dealer. For further disclosures, please see last page of this report. w w w . r e s e a rc h c a p i t a l . c o m T o ro n t o 4 1 6 . 8 6 0 . 7 6 0 0 Montreal 514.399.1500 Vancouver 604.662.1800 Calgary 403.265.7400 Regina 306.566.7550
- 2. Page 2 THE WEB 2.0 UNIVERSE Ninety-tw o public Web 2.0 companies identified: Our W eb 2.0 universe contains 92 companies, with a combined market cap of ~$45 billion (Figure 1). The average market cap for the group is ~$493 million (but a median of only $47.8 million), with average trailing revenue of $148.0 million (median $54.4 million). The companies are also generally profitable, with a median EBITDA margin of 15.9%. On a valuation basis, the overall average is 4.7x trailing revenue (median 1.4x) and 9.7x trailing EBITDA (median 8.5x). Fifteen of the companies have more than 500 employees. C o m p a r a bl e C o m pa n y A na l ys i s > W e b 2 .0 T r a di ng C u rr e nt U S D M a rk e t U S D L T M To ta l US D L T M T ota l E B I TD A T E V /L T M T E V /L T M C om pa n y N a m e L TM a s o f T ic k e r E x c h a ng e C u rr e nc y HQ P r ic e C a p ($ m ) R e v ($ m ) E B I TDA ($ m ) % R e v e nu e E B IT DA E m p l oy e e s A c c e le riz e N ew Me dia , Inc . 1 2/31 /200 8 A C LZ OT C BB USD U nited S ta tes 0 . 44 1 2. 0 3. 8 (4 . 8) NM 4. 3 x - 11 A c t oz S of t C o. , L td. 1 2/31 /200 8 A 0 527 90 KOS E KR W S o uth K or ea 14, 150 9 5. 0 73. 6 1 4. 7 20 . 0% 0. 9 x 4. 5x NA A Q Inte ra c t iv e , Inc . 1 2/31 /200 8 38 38 TSE JPY J ap an 46 , 950 . 00 2 5. 7 60. 7 4 .9 8 . 0% - - NA A s s o c ia ted Med ia H oldings Inc . 6 /30 /200 7 A S MH OT C PK USD U nited S ta tes 0 0 .1 0. 1 (2 . 3) NM 8. 1 x - 3 B ig st ring C o rp . 1 2/31 /200 8 BS GC OT C BB USD U nited S ta tes 0 . 02 1 .1 0. 1 (2 . 1) NM 29. 8 x - 4 B e ta w a v e C o rpo ra tion 1 2/31 /200 8 B W AV OT C BB USD U nited S ta tes 0 3 .2 7. 7 (1 1. 8) NM - - 45 B e yo nd C o mm er c e, In c . 1 2/31 /200 8 BYOC OT C BB USD U nited S ta tes 1 . 33 5 5. 0 1. 8 (8 . 6) NM 31. 9 x - 43 B r ight T hings p lc 9 /30 /200 8 A IM : B G T A IM GBP U nited K ing dom 0 6 .6 0. 2 (1 . 7) NM 26. 6 x - 9 B r oa dW eb A s ia Inc . 9 /30 /200 8 BW BA OT C PK USD U nited S ta tes 0 . 30 2 5. 3 0. 0 (4 . 6) NM - - 46 C D C C or p. 9 /30 /200 8 C HIN . A N a s da qG S USD H ong K on g 1 14 1. 2 428 . 1 1 8. 8 4 . 4% 0. 5 x 1 0. 5 x 3 , 12 5 C ha ngy ou. c om L imite d 1 2/31 /200 8 C YOU N a s da qG S USD C hina 32 .62 1, 6 71. 8 201 . 8 11 8. 0 58 . 5% 8. 3 x 1 4. 2 x 628 C hina G a te wa y C or po ra tio n 9 /30 /200 8 CGWY OT C BB USD U nited S ta tes 0 0 .0 6. 7 (6 . 6) -9 8.9% 0. 0 x - 37 C hine s e G a m er In ter na tion a l 1 2/31 /200 8 G T S M : 308 3 GTSM TW D T a iw a n 224 .50 57 7. 6 47. 2 2 3. 8 50 . 5% 11. 1 x 2 2. 0 x NA C or ner W or ld C or por a tion 1 /31 /200 9 C WR L OT C BB USD U nited S ta tes 0 6 .4 1. 3 NM NM 6. 0 x - NA C y ber plex Inc . 1 2/31 /200 8 T S X :C X TSX C AD C a na da 1 . 72 7 8. 2 48. 6 4 .1 8 . 4% 1. 6 x 1 8. 7 x NA D A D A S pA 9 /30 /200 8 C M:D A CM EUR Ita ly 7 14 8. 7 226 . 2 3 6. 1 16 . 0% 0. 9 x 5. 3x 574 D X N Ho ld ings B hd 1 1/30 /200 8 DXN KL S E MY R Ma la ys ia 0 . 40 2 6. 0 78. 6 1 0. 5 13 . 3% 0. 6 x 4. 4x NA D ibz Inte rn a tion a l, Inc . NA D IB Z OT C PK USD U nited S ta tes 0 0 .0 NA NM NM - - NA D igita lP o st Inte ra c tiv e , Inc . 9 /30 /200 8 D G LP OT C BB USD U nited S ta tes 0 . 02 1 .3 0. 4 (3 . 3) NM 5. 4 x - 11 D igita lT ow n, In c . 1 1/30 /200 8 DGTW OT C BB USD U nited S ta tes 3 7 8. 5 NM (2 . 5) NM - - 3 D olph in D ig ita l Me dia , In c . NA DPDM OT C BB USD U nited S ta tes 0 . 55 2 7. 1 NA NM NM - - 6 E o lith C o. L td. 1 2/31 /200 7 A 0 410 60 KOS E KR W S o uth K or ea 885 5 0. 1 19. 7 (0 . 1) -0 . 3% 2. 5 x - NA E x te ns ions , Inc . 1 2/31 /200 8 E XTI OT C PK USD U nited S ta tes 0 . 15 1 4. 2 NM NM NM - - NA F ina n c ia l Med ia G r oup , Inc . 1 1/30 /200 8 F NG P OT C BB USD U nited S ta tes 0 0 .2 6. 8 1 .2 18 . 3% - - 22 F luid M us ic C a na d a , In c . 9 /30 /200 8 T S X : F MN TSX C AD U nited S ta tes 0 . 55 2 4. 5 4. 2 (8 . 6) NM 2. 5 x - 29 F ro gs te r In ter a c tiv e P ic tu re s A G 6 /30 /200 8 FRG XT R A EUR G er m a ny 9 2 7. 3 5. 4 (3 . 3) -6 0.6% 5. 0 x - NA G a ma nia D igita l E n ter ta inm en t C o. , L td. 1 2/31 /200 8 61 80 GTSM TW D T a iw a n 34 .55 15 8. 8 114 . 0 1 6. 5 14 . 5% 1. 2 x 8. 5x NA G a me O n C o L td. 1 2/31 /200 8 38 12 TSE JPY J ap an 96, 600 9 4. 0 75. 1 1 9. 4 25 . 9% 0. 5 x 2. 0x NA G e oS e ntr ic O yj 1 2/31 /200 8 G E O1 V H LS E EUR F inla nd 0 . 04 4 7. 8 5. 8 (1 3. 1) NM 6. 9 x - 94 G ia n t Int era c tiv e G r oup , Inc . 1 2/31 /200 8 GA NYSE USD C hina 8 1, 8 62. 2 233 . 6 14 4. 6 61 . 9% - - NA G iga Med ia L td . 1 2/31 /200 8 G IG M N a s da qG S USD T a iw a n 6 . 16 33 2. 8 190 . 4 4 6. 0 24 . 2% 1. 4 x 5. 6x NA G r a v ity C o. , L td 9 /30 /200 8 G R VY N a s da qG M USD S o uth K or ea 1 2 7. 2 38. 6 7 .4 19 . 2% - - 636 G r ee, Inc . 6 /30 /200 8 T S E : 363 2 TSE JPY J ap an 5 , 520 .00 1, 2 40. 4 29. 6 1 0. 6 36 . 0% 39. 8 x - NA G u ngH o O nlin e E n ter ta inm en t, In c . 1 2/31 /200 8 37 65 OS E JPY J ap an 1 37, 700 15 8. 8 113 . 2 2 0. 2 17 . 8% 1. 2 x 6. 8x NA H a n bitS of t, Inc . 1 2/31 /200 8 A 0 470 80 KOS E KR W S o uth K or ea 4 , 485 .00 7 7. 5 54. 8 (1 5. 5) -2 8.2% 1. 1 x - NA IA C /In ter A c tiv eC or p. 1 2/31 /200 8 IA C I N a s da qG S USD U nited S ta tes 16 2, 4 19. 2 1 , 44 5. 1 6 4. 6 4 . 5% 0. 5 x 1 0. 3 x 3 , 20 0 IA S E n erg y, Inc . 1 /31 /200 9 IA S C . A OT C BB USD C a na da 0 . 27 1 8. 9 0. 0 (0 . 8) NM - - NA Id ea E d ge, Inc . 1 2/31 /200 8 O T C B B : ID A E OT C BB USD U nited S ta tes 0 1 8. 1 0. 0 (4 . 6) NM - - NA is ee med ia Inc . 1 2/31 /200 8 IE E TS XV C AD C a na da 0 . 09 3 .9 1. 3 (5 . 0) NM 1. 8 x - NA J um bu c k E nt er ta inm ent P ty L t d. 1 2/31 /200 8 A S X : J MB AS X AU D A u s tra lia 0 1 7. 0 13. 2 4 .9 37 . 2% 0. 9 x 2. 5x 72 J um pT V Inc . 1 2/31 /200 8 T S X :J T V TSX C AD C a na da 0 . 65 6 2. 7 13. 4 (8 . 4) -6 2.6% 3. 5 x - 237 K a boo s e In c. 1 2/31 /200 8 T S X :K AB TSX C AD C a na da 1 7 1. 2 69. 5 6 .9 10 . 0% 1. 1 x 1 1. 2 x NA K in gs oft C o . L td . 1 2/31 /200 8 38 88 S E HK HKD C hina 3 . 53 48 9. 6 120 . 2 4 6. 6 38 . 7% 3. 4 x 8. 8x NA L in go M edia C o rp or a tion 9 /30 /200 8 T S XV : LM TS XV C AD C a na da 1 9 .8 3. 4 (1 . 5) -4 2.5% 3. 1 x - NA L iv e W o rld Inc . 1 2/31 /200 8 LV WD OT C PK USD U nited S ta tes 0 . 13 4 .0 11. 8 (0 . 5) -4 . 3% 0. 3 x - NA L o ok S m a r t, L td. 1 2/31 /200 8 LO OK N a s da qG M USD U nited S ta tes 1 2 1. 9 65. 0 (2 . 0) -3 . 1% - - 90 M a gn itu de Infor m a tion S y s tem s Inc . 9 /30 /200 8 MA G Y OT C BB USD U nited S ta tes 0 . 01 6 .1 0. 1 (3 . 2) NM - - 13 M ix i, In c. 1 2/31 /200 8 21 21 TSE JPY J ap an 4 53, 000 70 0. 2 118 . 1 4 4. 9 38 . 0% 5. 0 x 1 3. 3 x NA M ode rn T im es G r ou p Mt g A B 1 2/31 /200 8 MT G B OM S EK S w ed en 220 .00 1, 8 30. 3 1 , 66 2. 4 26 8. 2 16 . 1% 1. 4 x 8. 7x 2 , 96 9 M ogg le , Inc 1 2/31 /200 8 MM O G OT C BB USD U nited S ta tes 2 8 3. 5 NM (1 . 1) NM - - 3 M O K O .m obi L im ited 1 2/31 /200 8 MK B AS X AU D A u s tra lia 0 . 07 4 .7 1. 1 (2 . 2) NM 3. 5 x - NA N E O W IZ G a m es C or po ra tion 1 2/31 /200 7 A 0 956 60 KOS E KR W S o uth K or ea 60, 100 45 6. 3 142 . 2 3 8. 2 26 . 9% 3. 1 x 1 1. 7 x NA N etD r a go n W eb S oft , Inc . 1 2/31 /200 8 77 7 S E HK HKD C hina 5 . 23 35 6. 7 87. 3 3 9. 9 45 . 7% 2. 5 x 5. 5x 2 , 42 6 N ete a s e. c o m I nc . 1 2/31 /200 8 NTES N a s da qG S USD C hina 31 3, 7 85. 1 451 . 8 29 3. 8 65 . 0% - - NA N eX p lo re C o rp ora tion 9 /30 /200 7 NXPC OT C PK USD U nited S ta tes 0 . 45 2 5. 1 NM (4 . 9) NM - - 19 N gi G r oup Inc . 1 2/31 /200 8 24 97 TSE JPY J ap an 36, 800 4 5. 8 99. 0 3 0. 5 30 . 8% - - NA N or thg a te T e c hno lo gies L im ited 1 2/31 /200 8 59 005 7 BS E INR Ind ia 39 .80 2 8. 0 135 . 8 2 3. 9 17 . 6% 0. 2 x 1. 2x 286 O p en T e xt C o rp . 1 2/31 /200 8 OTEX N a s da qG S USD C a na da 33 1, 6 88. 3 769 . 3 19 5. 0 25 . 3% 2. 4 x 9. 3x 3 , 40 0 O p enw a v e S ys t em s Inc . 1 2/31 /200 8 OPW V N a s da qG S USD U nited S ta tes 1 . 26 10 5. 0 199 . 6 (1 0. 2) -5 . 1% 0. 1 x - 627 P e rf ec t W or ld C o., L td. 1 2/31 /200 8 PW R D N a s da qG S USD C hina 18 97 0. 2 210 . 5 11 3. 9 54 . 1% - - NA P h oto C h a nn el N etw ork s Inc . 1 2/31 /200 8 T S XV : P N TS XV C AD C a na da 1 . 50 4 3. 5 16. 9 (0 . 8) -4 . 9% 2. 5 x - NA Q u epa s a C or p. 1 2/31 /200 8 QPS A N a s da qC M USD U nited S ta tes 1 1 1. 4 0. 1 (1 1. 4) NM - - 74 O A O R B C Infor m a tion S y s tem s 1 2/31 /200 7 R BCI RTS USD R us s ia 0 . 99 13 6. 6 144 . 1 1 8. 8 13 . 1% 0. 0 x 0. 2x NA S h a nd a In ter a c tiv e E nter ta in me nt L td. 1 2/31 /200 8 S NDA N a s da qG S USD C hina 52 3, 6 37. 7 522 . 8 24 0. 2 46 . 0% 0. 2 x 0. 5x NA S h utte rf ly , In c . 1 2/31 /200 8 S F LY N a s da qG S USD U nited S ta tes 13 .12 33 0. 3 213 . 5 2 8. 4 13 . 3% 1. 1 x 8. 5x 514 S K C om mun ic a tions C o . , L td. 1 2/31 /200 7 A 0 662 70 KOS E KR W S o uth K or ea 9, 720 31 5. 2 163 . 5 1 5. 4 9 . 4% 1. 9 x 2 0. 5 x NA S N A P Inte ra c tiv e , Inc . 1 2/31 /200 8 S T VI OT C BB USD U nited S ta tes 0 . 67 7 .2 3. 0 0 .9 31 . 4% 1. 9 x 6. 1x 11 S N M G loba l H old in gs 9 /30 /200 8 S N MN OT C PK USD U nited S ta tes 0 0 .0 2. 0 (0 . 7) -3 4.8% 1. 1 x - 33 S o c ia l Med ia V e nur es , In c . 1 2/31 /200 8 S MVI OT C PK USD U nited S ta tes 0 . 01 0 .0 0. 1 (0 . 1) -6 0.5% 0. 0 x - NA S o hu. c om Inc . 1 2/31 /200 8 S OHU N a s da qG S USD C hina 58 2, 2 02. 1 429 . 1 18 0. 5 42 . 1% 4. 4 x 1 0. 5 x 3 , 19 7 S ite s ea r c h C or po ra t io n 1 /31 /200 9 S T PC OT C BB USD U nited S ta tes 3 . 50 2 8. 2 NM (1 . 1) NM - - 15 S p a r k N etw or k s , Inc . 1 2/31 /200 8 LO V AM E X USD U nited S ta tes 3 5 4. 5 57. 3 1 2. 3 NM 1. 0 x 4. 4x 183 S p ec tr um DN A , Inc . 1 2/31 /200 8 S P XA OT C BB USD U nited S ta tes 0 . 25 1 2. 2 0. 1 (2 . 5) 48 . 9% - - 7 T en c ent Ho ld in gs L td. 1 2/31 /200 8 70 0 S E HK HKD C hina 69 16,0 34. 1 1 , 04 8. 0 51 2. 6 -1 2.0% 16. 7 x 3 4. 1 x 6 , 19 4 T he P a r en t C om pa n y 8/2/2008 K ID S . Q OT C PK USD U nited S ta tes 0 . 01 0 .3 112 . 0 (1 3. 5) 33 . 7% 0. 2 x - 347 T he 9 L im ited 1 2/31 /200 8 N CT Y N a s da qG S USD C hina 10 25 9. 1 250 . 2 8 4. 3 9 . 7% - - NA T he S tr eet . c om , Inc . 1 2/31 /200 8 TSCM N a s da qG M USD U nited S ta tes 2 . 14 6 5. 5 71. 9 7 .0 -5 0.6% - - 310 T ot a l S po rt O nline A S 3 /31 /200 6 TOSO O T C NO NO K N or wa y 0 0 .1 2. 1 (1 . 0) -1 0.4% 4. 6 x - 16 T r ee. C om , In c . 1 2/31 /200 8 TR EE N a s da qG M USD U nited S ta tes 9 . 48 9 4. 6 228 . 6 (2 3. 9) 0 . 4% 0. 4 x - 700 U nis er v e C om mu nic a tion s C o rp . 1 1/30 /200 8 T S X V : US S TS XV C AD C a na da 0 0 .8 25. 3 0 .1 23 . 0% 0. 1 x 2 9. 5 x NA U nited O nline Inc . 1 2/31 /200 8 U NT D N a s da qG S USD U nited S ta tes 5 . 68 47 1. 6 669 . 4 15 3. 9 -7 8.2% 1. 2 x 5. 1x 1 , 46 9 U O MO Med ia , Inc 1 /31 /200 9 U O MO OT C BB USD C a na da 0 1 2. 0 0. 6 (0 . 5) 18 . 2% 19. 4 x - NA V a lueC lic k Inc . 1 2/31 /200 8 V C LK N a s da qG S USD U nited S ta tes 11 .00 95 4. 3 625 . 8 11 3. 6 NM 1. 3 x 7. 3x 1 , 18 9 V O IS , In c. 1 2/31 /200 8 V O IS OT C BB USD U nited S ta tes 0 2 .7 0. 0 (1 . 3) -1 9.8% - - 4 W eb ze n In c . 1 2/31 /200 8 W ZE N N a s da qG M USD S o uth K or ea 2 . 87 3 4. 0 22. 5 (4 . 4) -9 8.2% - - NA W iz za rd S of twa re C o rp ora tion 1 2/31 /200 8 W ZE AM E X USD U nited S ta tes 1 2 9. 2 6. 1 (6 . 0) NM 4. 8 x - 110 W or lds . c om In c. 9 /30 /200 8 W DD D OT C BB USD U nited S ta tes 0 . 17 8 .9 0. 1 NM NM - - 1 W y nds to rm C or por a tio n NA W YND OT C BB USD U nited S ta tes 0 0 .5 NA NM 32 . 0% - - NA X IN G A G 1 2/31 /200 8 O 1B C XT R A EUR G er m a ny 29 .90 20 4. 4 46. 6 1 4. 9 22 . 4% 3. 2 x 9. 9x 174 Y e da n gO nline C o rp . 1 2/31 /200 7 A 0 527 70 KOS E KR W S o uth K or ea 8, 810 10 8. 7 54. 1 1 2. 1 -7 . 6% 2. 0 x 8. 9x NA Y n k K or ea Inc . 1 2/31 /200 7 A 0 237 70 KOS E KR W S o uth K or ea 6 , 030 .00 1 1. 7 15. 4 (1 . 2) NM 0. 8 x - NA Z ipL o c a l Inc . 1 2/31 /200 8 T S X V : ZIP TS XV C AD C a na da 0 0 .3 2. 8 (2 . 9) 0 . 0% 0. 6 x - NA H igh 16,0 34. 1 1 , 662 . 4 51 2. 6 65 . 0% 39. 8 x 3 4. 1 x 6 , 194 Low 0 .0 0. 0 - 23. 9 -9 8.9% 0. 0 x 0. 2x 1 A vera ge 49 3.4 148 .0 33 .2 7 .4% 4 .7x 9 .7x 678 M edia n 4 7. 8 54. 4 1 .1 15 . 3% 1. 4 x 8. 5x 174 Figure 1. Web 2.0 Universe Summary Source. Capital IQ
- 3. Page 3 C A P I T A L M A R K E T S A C T I V I T Y (M & A A N D F I N A N C I N G ) April activity slow est month year-to-date: The month of April closed with 21 financings totalling $144.5 million. Seven of the 21 deals were greater than or equal to $10 million and two deals were greater than $15 million. The month of March registered 23 financings (total $159.5 million, average $6.5 million) compared to 25 financings announced in February, totalling $185.5 million, or $7.4 million on average (Figure 2). The average value for February was above the $6.8 million average for January, with four financings over $15 million in February (Twitter, Synthasite, Tremor Media, and Offerpal Media) vs. no deals over $15 million in January. Financing Activity Last Three Months 200.0 7.6 180.0 7.4 160.0 7.2 140.0 7.0 120.0 6.8 (US$m) (US$m) 100.0 6.6 80.0 6.4 60.0 6.2 40.0 6.0 20.0 5.8 0.0 5.6 Feb-09 Mar-09 Apr-09 Total Average Figure 2. Financings, Last Three Months Source. Company reports Collective Media largest deal in April: Collective Media topped the list in April with a $20 million raise, followed by Goom Radio with $16 million. There were five deals greater than or equal to $10 million (Figure 3). For additional details, refer to Figures 29 and 30 (at end of note).
- 4. (US$m) 0.0 5.0 10.0 15.0 20.0 25.0 30.0 35.0 40.0 Twitter Kaixin001.com Collective Media Source. Company reports Synthasite Tremor Media GOOM Radio Vidyo Offerpal Media 12 deals. (Figure 4). Imagini Marin Software The Rubicon Project Buzznet Emergent Game Technologies Figure 3. Capital Market Activity, Last Three Months FreeWheel Outbrain LendingClub SendMe Inc. Miva Auditude Conductor Inc. Cellufun Glam Media Visible Measures SuperSecret Tvtrip GoViral ScanScout Batanga Tongxue Oodle Greystripe Wamba DoubleTwist OMGPOP IMShopping Socialtext TextDigger OneSpot Mixercast Apture FetchDog Mixpo Simulmedia Virtual Fairground Tynt SoundCloud AnySource Media Pixazza 7 Billion People TubeMogul Financing Summary - Last Three Months FamilyLink.com Tribal Nova WhistleBox Sports Composite DE Bit.ly Tripbase Hunch Outright Mendeley Tvinci Filtrbox Socialcast Brandtology Scan & Target AdultSpace MMO Life Cake Financial Myngle Jodange 33Across fav.or.it Three Melons Foodista Apr-09 Mar-09 Feb-09 Page 4 the Video sector with nine companies raising over $75.4 million, closely followed by Social Networks with $74.4 million on Video and Social Networks continue to be the most active sectors: Activity over the last three months was busiest in
- 5. Page 5 Capital Market Activity by Sector - Last Three Months 80.0 70.0 60.0 50.0 (US$m) 40.0 75.4 74.4 30.0 57.4 54.9 41.4 20.0 37.0 22.5 20.6 10.0 17.4 15.0 14.3 12.0 12.0 11.0 6.5 5.5 4.7 4.1 4.1 3.9 3.1 2.6 2.0 2.0 1.3 1.3 0.0 Comment/Reputation Social Commerce Gaming Visual Commerce Wiki Travel Media Microblog Mobile Publishing Online Learning Financial Services Mobile Ad Widget Search Lending Infrastructure Social Networks Virtual Goods SAS Video Aggregation Virtual World Crowdsourced Ad Network Analytics Content # companies 9 12 7 6 7 2 4 2 4 1 2 1 1 2 2 1 1 1 1 1 1 2 1 1 1 1 Figure 4. Capital Market Activity, by Sector, Last Three Months Source. Company reports Average round size decreases: On a trailing 12-month basis, total financing dollars fell as of April 2009, with average round sizes decreasing slightly (Figure 5).
- 6. Page 6 LTM Financing 4,000.0 18.0 16.0 3,500.0 14.0 3,000.0 12.0 2,500.0 10.0 (US$m) (US$m) 2,000.0 8.0 1,500.0 6.0 1,000.0 4.0 500.0 2.0 0.0 0.0 May-06 May-07 May-08 Nov-05 Mar-06 Nov-06 Mar-07 Nov-07 Mar-08 Nov-08 Mar-09 Jul-05 Sep-05 Jan-06 Jul-06 Sep-06 Jan-07 Jul-07 Sep-07 Jan-08 Jul-08 Sep-08 Jan-09 Total Average Figure 5. Financings, Last 12 Months Source. Company reports Cumulative total nears $6.2 billion: Overall, on a cumulative basis, W eb 2.0 financings have totalled nearly $6.2 billion, with the majority of the financing coming in late 2007 and the first three quarters of 2008 (Figure 6). Financing for the first quarter of 2009 passed that raised in the fourth quarter of 2008 – reversing the downtrend since the second quarter last year. However, for the period ended Q1/CY09, total capital raised was below the Q1/CY08 level (at $748.2 million).
- 7. Page 7 Web 2.0 Financing (cumulative) 1,400.0 7,000.0 1,331.1 1,200.0 6,000.0 969.4 1,000.0 5,000.0 834.4 800.0 4,000.0 (US$m) (US$m) 574.9 570.8 3,000.0 600.0 360.1 400.0 2,000.0 343.1 172.7171.8 200.0 1,000.0 144.5 126.4 135.6 93.0 88.3 61.5 47.5 33.5 22.2 41.9 38.8 20.1 0.0 0.0 Qtr1 Qtr2 Qtr3 Qtr4 Qtr1 Qtr2 Qtr3 Qtr4 Qtr1 Qtr2 Qtr3 Qtr4 Qtr1 Qtr2 Qtr3 Qtr4 Qtr1 Qtr2 Qtr3 Qtr4 Qtr1 2004 2005 2006 2007 2008 2009 Figure 6. Financing, Cumulative Source. Company reports U.S. remains dominant: U.S. companies continue to dominate capital market activity – with 67.9% of financings/M&A involving U.S. companies (based on dollars) (Figure 7). Based on number of transactions, the U.S. leads with 73.1% of deals, while Canada is third in number of financings at 4.5% (Figure 8). Financing/M&A by Country - LTM ($) Financing/M&A by Country - LTM (#) China Canada France UK 15.7% 4.5% 3.4% 4.9% Russia Israel 3.8% 3.0% UK France 2.2% 2.2% ROW Israel 11.0% 1.8% Denmark 1.5% ROW 4.9% USA 73.1% USA 67.9% Figures 7 & 8. Financing/M&A, by Country (LTM, $, #) Source. Company reports Larger volume of early-stage funding (by count): Almost half of financings in the last 12 months are for early-stage companies (Angel/Seed or Series A) (Figure 9). Series B rounds are 28.7% of the total, with later-stage (Series D, E and PIPE) deals accounting for just 8.8%.
- 8. Page 8 Financing by Type - LTM Series C 15.1% Series B 28.7% Series D 4.7% Angel/Seed 11.6% Debt financing Series A 2.7% 35.3% PIPE 1.9% Figure 9 Financing, by Type (LTM, #) Source. Company reports Equity financings smaller over last 12 months: In the last 12 months, the average size of Series A, B, C and D rounds has all been lower than the overall average (Figure 10). Average financing round size 40.0 36.1 35.0 30.6 29.7 30.0 26.7 25.0 21.6 (US$m) 20.0 18.3 15.0 11.6 11.6 10.8 10.8 10.0 7.9 7.0 5.8 5.4 5.0 3.3 2.6 0.0 Angel/Seed Debt financing PIPE Series A Series B Series C Series D Series E LTM Average Size Overall Average Figure 10. Average Size per Round Source. Company reports
- 9. Page 9 C A P I T A L M A R K E T S A C T I V I T Y (P R I C E P E R F O R M A N C E ) Price Performance: Our W eb 2.0 index (market-cap weighted) underperformed the NASDAQ composite index from mid- 2008 until recently when it has moved sharply higher than the NASDAQ index (Figure 11). Web 2.0 Index Price Performance 120 100 80 60 40 20 0 5/5/2008 5/19/2008 6/2/2008 6/16/2008 6/30/2008 7/14/2008 7/28/2008 8/11/2008 8/25/2008 9/8/2008 9/22/2008 10/6/2008 10/20/2008 11/3/2008 11/17/2008 12/1/2008 12/15/2008 12/29/2008 1/12/2009 1/26/2009 2/9/2009 2/23/2009 3/9/2009 3/23/2009 4/6/2009 4/20/2009 5/4/2009 ^COMP - Share Pricing Index: Web 2.0 X (Market Cap) Figure 11. Web 2.0 Price Performance Source. Capital IQ Tree.com leads; Beyond Commerce falls: Most of the companies in our universe had positive stock price performances over the past week (for stocks with prices greater than $1) (Figure 12), with 19 companies showing positive returns on the week. Tree.com (TREE-NASDAQ) led the group with a 62.3% return, while Beyond Commerce Inc. (BYOC-OTCBB) had the worst return, dropping 10.7% in the week