
Empfohlen
Weitere ähnliche Inhalte
Ähnlich wie Chapter 4--results and discussion.docx
Ähnlich wie Chapter 4--results and discussion.docx (20)
Mehr von danilojrsiquig
Mehr von danilojrsiquig (17)
Kürzlich hochgeladen
Kürzlich hochgeladen (20)
Chapter 4--results and discussion.docx
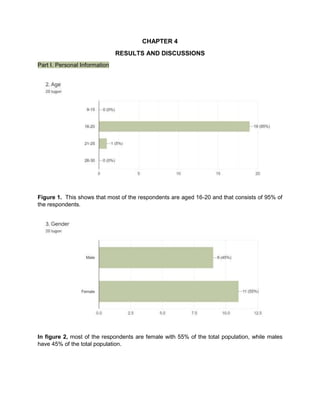
- 1. CHAPTER 4 RESULTS AND DISCUSSIONS Part I. Personal Information Figure 1. This shows that most of the respondents are aged 16-20 and that consists of 95% of the respondents. In figure 2, most of the respondents are female with 55% of the total population, while males have 45% of the total population.
- 2. Figure 3. Shows the highest educational attainment of the study, specifically of the respondents. The highest rate of the respondent of high school level of 18 respondents with 90% of the rating. The second highest is at the college level of 2 respondents with a percentage of 10%, meanwhile in the elementary level with only 1 respondent with 5 percent. Part II- PERSPECTIVES ON TRASH TALKING In figure 1.1, the highest respondents are 35% non-very extremely easy towards opponents, while there are 25% of respondents who choose most extremely easy, and there is 15% for almost extremely easy. For the difficult, there are 5% and 10%that make it difficult to use trash talk towards opponents.
- 3. Figure 1.2, According to the results, 25% of respondents disagree with trash-talking opponents, while 5% agree. As a result, it has a considerable impact on how gamers engage with their opponents in online gaming. In this figure 1.3, The findings of this study showed that the majority of the respondents is 6(30%) with the highest rate of respondents who feel neutral. The second with the second-highest rate is 5(25%) which they responded bad. The third one, on the other hand, 3(15%) of the respondents feel good. 5 and 6 have the same answers with the same number of respondents (10%). Same also with 1 and 2 with the same answers and number of respondents (5%).
- 4. Figure 1.4, shows that 4 and 6 have the same 2 answers with the same number of respondents (6) and the number of percentages (30%) with also 3 same answer which is 1 with the different individual of respondents of 5% each. Figure 1.5, most respondents (45%) strongly agree to stop using trash talk toward opponents. Meanwhile, some respondents are unsure whether they disagree or strongly agree.
- 5. Figure 1.6, shows that past seasons 4 and 5 have the same equal respondents with 6 different respondents with 25 percent, and past seasons 1, 3, and 7 also have the same response of 1 different respondent with a 5% rating. While past season 2 has 3 respondents with 15% of rating and lastly, past season 6 had the second-highest rating with 4 respondents with a 20& rating. Figure 1. 7, shows that the highest response rate is 55%, which is moderate, but there is a second highest response rate of 22%, indicating that they are very capable.
- 6. In figure 1.8, the highest respondents are 25% moderate, while the same results are 20% and 10% in that figure that is approved to be used trash talk against opponents, but the lowest is 5%. Figure 1.9, According to the data, 7(35%) of respondents find it enjoyable to use trash-talk to the opponents which has the highest rate on the data. 3, 4 and 7 (15%) has the same number of respondents but with different answer. 2(10%) of the respondents find it also enjoyable. Lastly, 1 and 2 (5%) of the respondents find it unenjoyable to use trash-talk to the opponents though with the same number of respondents but with different answer as well.
- 7. Figure 1.10, according to this table, 10% of the respondents say they can control the trash talk towards opponents, and 20% have a neutral perspective, while 35% of the respondents say they have no control over the trash talk towards opponents. This demonstrates that the average of gamers has a reasonable attitude toward their opponents. As a result, it is a positive factor in online gaming. Figure 1.11, According to the findings of this study, the majority of five (35%) of respondents find it advantageous to trash-talk their opponents. The second highest percentage of respondents is 15%. Respondent 3 has the same number of respondents as Respondent 1 and feels bad about trash talking toward opponents. Last but not least, the 3 and 4 (15%) respondents were neutral.
- 8. Figure 1.12, shows that upcoming season 4 has the biggest rate of 10 respondents with 50% parts of the given survey. The upcoming season 2 and 3 has the same 4 distinctive respondents consisting of 20% rating, same as the upcoming season 5 and 7 with the same number of respondents consisting of 1 different respondent of 5% rating and the upcoming season 1 and 6 with distinctive respondents of 0. Figure 1.13, The highest respondents are 50% moderate, while the same results are 25% and 5%, which is the lowest rate to use trash talk towards their opponents.
- 9. Figure 1.14, The data shows that the majority of the respondents is 7(35%) that used to trash- talk to the opponents in the past season almost very many times. 4 and 6 (15%) shared the same number of respondents but with different answers 4 being neutral and 6 used to trash-talk very many times. Same goes with 2, 3 and 7 (10%) shared the same number of respondents but with different answers 2 and 3 being not used to trash-talk at all and 7 being used to trash-talk very many times in the past season. Lastly, 1(5%) being not used to trash-talk at all to the opponents. Figure 1.15, The findings of this study showed that majority of the respondents is 7(35%) that the respondents feel neutral when they are encouraging to use trash-talk towards opponents. 4(20%) of respondents feel highly encourage to use trash-talk towards opponents with their important people which they answered agree. 1, 2, 3 and 7 (10%) of respondents has the same number of respondents but with different answers. 2(10%) of the respondents answered strongly agree and
- 10. being highly encouraged by their important people. Meanwhile, 1(5%) with the lowest rate of respondents answered slightly agree. Part III- IMPACTS ON TRASH TALKING Table 1. The impact of trash talk on online games is depicted in this graph. This table depicts the impact of trash talk by rank. When playing in a game or competition, I trash-talk my competitor. They shared the same number of respondents. It means that they rarely, if ever, trash talk their opponents. The second is the statement. I trash-talk in a way that is beneficial to my motivation levels’. It implies that a number of respondents sometimes trash talk their opponents in a way that is beneficial to their motivation levels. The third is the statement. When I trash-talk, my confidence increases’. The majority of the respondents say that sometimes trash talk can boost confidence in oneself. The fourth statement I only trash talk when I believe I am clearly superior to my opponent. A large percentage of respondents criticize their opponents if they know they are better gamers than they are, so their opponents have nothing to say and can immediately decide to shut up. The last statement is, "The closeness or competitiveness of a game influences my use of trash-talking." In this table, they both have the same number of respondents who state that they do not use trash-talking frequently or at all.
- 11. Table 2. Indicated that 60% of the players would likely trash-talk during a close game to mess with the opponent’s state of mind while 35% of the players would likely to trash- talk if their team is losing to give their selves the satisfaction to feel good about themselves despite losing. While some only prefer to throw foul words at the opponents if their team is already winning. Table 3. In question number 7, the highest respondents are 2= rarely and 4= sometimes. Question number 8, the most respondents, is 6= usually, and the last question number 9, the highest result, is 1= almost never.
- 12. Table 5. The table indicated that 35% of the respondent get motivated by using foul words to their enemies, 25% use trash-talk to boost confidence and 20% Do not use trash-talk at all to their opponents and 15% use other internal motives for trash-talking. Table 6. The table shows that the majority 30% of respondents intended to make the opponent angry. Also, 25% of respondents intend to psych out the opponent and another 25% of respondents do not use trash-talk to the opponent. 15% of respondents intended to scare the competitor, meanwhile, none of the respondents chooses another which is 0%.
- 13. Table 7. The table indicates that the majority of respondents have the highest percentage of 45% answered sometimes believe those effects that they answered in Table 12 truly happens to their competitor when they trash-talk against them. The second highest percentage answered Yes with 35% if those effects that they answered in Table 12 truly happen to their competitor when they trash-talk against them. 15% of respondents answered does not apply. Lastly, none of the respondents answered No which is 0%. Table 8. In this table, the objective that the study sought to answer is' do I respond to trash talk in a manner similar to those who I trash talk against'. The highest response is sometimes, and the second is rarely. The others, on the other hand, have a lower response rate. 15. What are some example phrases of the trash-talk that you use?20 tugon You suck Ka bobo simo!
- 14. tang ina mo bobo ang panget ng pag mumukha mo sana hindi kana pinanganak Apaka hina mo nmn ayusin mo nmn, palakas ka muna. Pabigat e . Tni wy ka napatay! Bob* you're so dumb🐱🐱 YUT DU GAGO. SAYANG BATTLE PASS MO KON MUNA KAMLANG MAG HMPANG. MUMANGO SIMO LINTE SUGGEST KO PAMUNONG KANLANG. SAKTO! IGO-A ANG HANGIN! HEHEHHEHEHH Mad? Okay. Lane Diff. You are terrible. Delete the game. Weak "You are just adopted by you're parents" Bobo mo mahina kang nilalang POTINGINA A talking sheet.. Bobu Kakawalng gana naman kayo kampi umayy Sorry di kita nakita. Masyado kang irrelevant. " SMURF YON?SUS BAKA BOOSTED" " PABUHATTTT NYO NAMN " "BOBO NG TOP FRAG" "HINA NYO NAMN" "EZ WIN" "DELETE MO NA LG YANNN BOBO MO " None I hope you do better! Addition In this table, the game platform with the highest proportion of respondents is 36.8%, which is mobile and both. Meanwhile, the lowest proportion of respondents is 26.3%, which is the PC.
- 15. While in this table, valorant has the highest respondent (36.6%). With 31.6 percent of responses, Mobile Legends comes in second. The third one, LOL, received 15.5 percent of the votes. The second game platform, on the other hand, has a low response rate.