2. ABSTRACT
• Government of Punjab (GOP), in their 10th Five-Year Plan identified road
sector as one of the main component to boost the growth rate in the state.
• Because of low land to population ratio, land cost is very high and ribbon
development along road sides has further complicated the process of up-
gradation and widening of the existing roads of Punjab.
• The government of Punjab has proposed to develop a new road network along
the major canals where sufficient land is available to construct roads.
• It has been observed in the past that failure of roads along water bodies such
as canal, lake and pond etc.is very common.
• Therefore it becomes utmost important to identify the causes of road failures
along the canal and to find their possible solutions.
• Canal embankment always consists of different types of soil which will exhibit
different engineering characteristics when subjected to loads.
3. INTRODUCTION
• Variation in capillary saturation zone leads to moisture content
variation in the subgrade soil which adversely affects the physical
properties of the soil causing failure of roads at such locations.
• Most of the soil deposits in Punjab consist of alluvial soils which are
highly heterogeneous in nature both in horizontal and vertical
direction.
• The design of new flexible pavements and rehabilitation of existing
pavements needs an accurate estimation of CBR value.
• The California Bearing Ratio (CBR) is a measure of the strength of
the sub- grade and is used to design the thickness of road
pavements built over the soil.
• CBR value is affected by the soil moisture content and can decrease
significantly, if the sub-grade soil remains saturated for an
appreciable length of time.
4. • Design of new pavements or strengthening of existing one is based upon worst
possible environmental conditions, therefore in situ CBR tests has to be
conducted after saturating the existing subgrade.
• It is very difficult to conduct a field soaked CBR test and is almost impractical in
many situations where effective drainage layer is available and water table or
capillary saturation zone is at depth.
• On the other hand in case of a laboratory CBR test specimens after being
moulded at insitu density tend to give higher values of CBR than those obtained
in the field especially for sandy soils [1]. The difference is due to the confining
effect of rigid mould in laboratory tests.
• In field CBR tests, many times misleading CBR value is obtained, whenever
piston tip rests on a small stone present in the subgrade soil.
• In the design of overlays generally Benkelman’s beam method and Falling
Weight Deflectometer (FWD) are used but these methods are sophisticated and
time consuming. In the present scenario when roads are to be constructed
along canal banks comprehensive quality control plan needs to be exercised
which can only be possible by exploring the use of simple, less time consuming
and economical testing techniques. [2] has successfully used dynamic cone
penetrometer(DCP) for estimating the strength of soil.
5. • Some of the work regarding correlation between DCPT and CBR has been reported in
literature [3,4] but the conditions considered were not simulating the actual highway
condition. Keeping in view the above stated limitations of field as well as laboratory CBR
tests,
• it was decided to conduct dynamic cone penetration test (DCPT) and CBR tests at similar
conditions both in laboratory and in field simultaneously to find the possibility of
developing simple relationship that could be used to evaluate the field CBR.
• The DCP test values can be used to estimate the CBR values provided an acceptable
relationship exists between the CBR and the DCPI value.
• Development of any such relationship may become very effective tool for highway
engineers.
• The other benefits of the relationship are the following:
• It may help enhancing highway construction quality control;
• It may help ensuring long-term pavement performance and stability; and
• It may help in achieving more uniform structural properties.
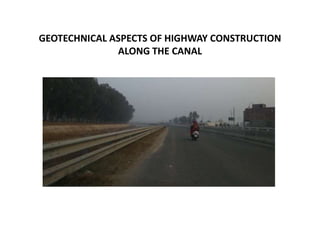
• In the present study DCP tests were conducted along the 8 Km long stretch of the left bank
of Sidhwan canal passing through the southern part of Ludhiana city (Punjab) for widening
and strengthening of the existing road. Total 8 locations were earmarked at an interval of
one Km after visiting the site. The interval was decided based on uniformity of soil available
along the whole stretch. The present study describes a series of DCP tests conducted at in
situ conditions and soaked in situ condition. In addition to the above field test, laboratory
soaked CBR tests moulded at in situ density were also carried out and the results obtained
from the tests were presented and discussed.
6. EXPERIMENTAL WORK
• The DCP tests were conducted according to the procedure laid down in [5] and
[6].
• The apparatus consists of 16mm diameter steel rod in which a tempered steel
cone with a 20 mm base diameter and a 60 degree point angle is attached.
• The DCP is driven into the soil by a 8kg hammer with a free fall of 575mm. The
hammer correction factor is unity for 8 kg hammer.
• The DCP index or reading is defined as the penetration depth (D) in mm for a
single drop of hammer. The cone is driven in to the ground up to the desired
depth and average DCP index is calculated for a single blow.
• Depth of penetration considered in the study was 300mm, two layers of 150
mm each of soil subgrade.
7. FIELD and LABORATORY TESTS
• Following tests were conducted during the course
of this study:
• Sieve analysis
• Atterberg’s limit test
• Modified Procter compaction test
• In situ density test (Sand replacement)
• DCP tests (In situ saturated)
• DCP test (mould, in saturated condition)
• Laboratory CBR tests (at in situ density).
• In situ CBR tests (saturated condition)
8. TEST PROCEDURE and SAMPLE PREPARATION
• The experimental study involved performing a number of field and laboratory CBR tests and
DCP tests at artificially saturated condition.
• In situ dry density of soil subgrade was also determined.
• The dynamic cone penetrometer was directly placed on the subgrade and the test was
started by sliding the hammer. Soil resistance was measured in terms of penetration as
mm/blow. For every location three points were tested and average value was considered for
the determination of DCPI.
• Since the imprint area of the cone tip for the first blow is smaller than that of subsequent
blows the penetration of the first blow was discounted.
• The numbers of blows were counted for top 150 mm (designated as the top layer)
penetration of the cone and penetration per blow was calculated and the same procedure is
repeated for lower 150 mm layer (designated as bottom layer).
• The second layer was tested to study the effect of underneath soft layer on field CBR [7].
• To conduct soaked in situ DCP test and in-situ saturated CBR, a small area of 3mx3m was
flooded with water by making small dykes around that area.
• As the soil was silty sand, water was kept flooded for 24 hours before conducting the tests.
• Rest of the field and laboratory tests were conducted as per the relevant Indian Standard
Codes.
9. RESULTS and DISCUSSION
• The most important parameter to evaluate subgrade strength for the
pavement design is the CBR value that would actually be available to
support the pavement and traffic load. In case, strata below the subgrade
is weak, the available subgrade CBR is always less than the anticipated
from laboratory test, hence the term effective CBR is taking place in
pavement design.
• In this study an efforts has been made to correlate DCPI with effective CBR.
The results of various tests conducted in the field and laboratory are
presented graphically as shown in Figure-1 and Figure-2
• It is observed from the results that soil is sandy in nature for all the 8
locations with sand content varying from 63.0% to 90%. The atterberg’s
limits indicates that soil is either non plastic or having a low plasticity index
in the range of 1% to 5%.. The in-situ density is different for different
locations varying from 16.20kN/m3 to 20.30kN/m3. In-situ moisture lies
between 2.5 to 8.0%. The results further reveals that soaked laboratory
CBR value is higher than the DCP based soaked in situ CBR value. This is
attributed to the higher confinement pressure of rigid mould in the
laboratory.
10. Graphs
Figure 1, Showing the relationship
between mould DCPI and Laboratory CBR
Figure 2, Showing the relationship
between field DCPI and field CBR.
11. Figure 1 shows the relationship between the laboratory DCPI value with the corresponding
Laboratory CBR value of samples compacted at field dry density and soaked for 24 hours.
This relationship can be expressed by means of a polynomial equation as given below.
Y1= 0.1943xm
2 - 6.7988xm + 71.628 (1)
Where
Yl = Laboratory CBR at field density saturated for 24 hours
And
xm =DCPI of soil compacted in mould at field density and saturated for 24 hours in mm/blow
.
In Figure 2, field DCPI values were plotted against field CBR values of the subgrade soil
artificially saturated for 24 hours . Similarly the variation can be expressed by a polynomial
equation as given below
yf = 0.1918xf
2 - 6.4346xf + 68.081 (2)
Where
yf = Field CBR at surface of subgrade with known dry density and artificially saturated for 24
hours
And
xf = DCPI of soil at surface of subgrade with known dry density and artificially saturated for
24 hours in mm/blow .
12. CONCLUSIONS
Based on the study following conclusions can be drawn:
1. The in-situ CBR value of sandy soils having similar degree of saturation can be
determined quickly and with adequate accuracy using the DCPT results.
2. Once the correlation is established between CBR and DCP index for tests conducted
under different conditions and compaction level or in-situ density. The soaked CBR
value in the field can be determined very quickly by conducting the in-situ DCPT for
the similar conditions.
3. Similarly laboratory soaked CBR value can be evaluated after establishing a
correlation between DCPI and CBR sat at different compaction levels in the laboratory.
4. Effective CBR of upper layers can be easily verified with the help of DCPI of individual
layers from top up to intended depth.
5. For construction of new embankments or strengthening of existing pavements, DCPT
will be a very useful tool for evaluating the strength of sub grade in terms of CBR
value.
6. It may helpful in enhancing highway construction quality control, ensuring long-term
pavement performance, stability and achieving more uniform structural property.
13. REFERENCES
1. Haison, J.A. (1987) “Correlation Between California Bearing Ratio and Dynamic Cone
Penetrometer Strength Measurement of Soils” Proceeding, Institution of civil
engineering, 83(2), 833-844.
2. Scala, A. J. (1956) “Simple Methods of Flexible Pavement Design Using Cone
Penetrometer”.N.Z.Eng..11, No2
3. Smith,R.B and Pratt D.N. (1983) “A Field Study of In situ California Bearing Ratio and
Dynamic Cone Penetrometer Testing for Road Investigations”. Australian Road Research,
13 No.4, 285-294.
4. Livneh, M. (1989) “Validation of Correlations Between a Number of Penetratin Tests and
In situ California Tests”.Transport Research Record, No1219, 56-67.
5. ASTM D6951/D6951M November 2009 Standard Test Method for Use of the Dynamic
Cone Penetrometer in Shallow Pavement Applications.
6. IRC SP 72-2007 Guidelines for the Design of Flexible Pavements for Low Volume Rural
Roads Indian Roads CONGRESS. 2007.
7. IRC:37-2012 Guidelines for the Design of Flexible Pavements. (Third Revision). Indian
Roads Congress 2012
8. Choudhary, A.K., Jha, J.N. & Gill, K.S. (2010) “Utilization of Plastic Waste for Improving
the Subgrades in Flexible Pavements” Geotechnical Special Publication, ASCE,
No.203.320-326.
9. Cone Penetration Report”.GL-93-3. Department of Army, Washington DC, 19.
10. Sawangsuriya, A., Wachiraporn, S. & Sramoon, W. (2008) “Assessment of Modulas and
CBR of Pavement Materials for Design and Construction.” Seminar:
11. Bureau of Materials-Analysis and Inspection of Highways, Bangkok, Thailand, 31-50.