Labour Force Survey Shows Unemployment Rate Edges Down to 7.9
1. Released at 7:00 a.m. Eastern time in The Daily, November 05, 2010
Labour Force Survey
October 2010 Note to readers
The Labour Force Survey (LFS) estimates are based on a
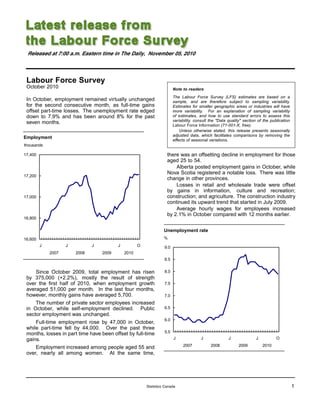
In October, employment remained virtually unchanged sample, and are therefore subject to sampling variability.
for the second consecutive month, as full-time gains Estimates for smaller geographic areas or industries will have
offset part-time losses. The unemployment rate edged more variability. For an explanation of sampling variability
down to 7.9% and has been around 8% for the past of estimates, and how to use standard errors to assess this
variability, consult the "Data quality" section of the publication
seven months.
Labour Force Information (71-001-X, free).
Unless otherwise stated, this release presents seasonally
adjusted data, which facilitates comparisons by removing the
Employment
effects of seasonal variations.
thousands
17,400 there was an offsetting decline in employment for those
aged 25 to 54.
Alberta posted employment gains in October, while
Nova Scotia registered a notable loss. There was little
17,200
change in other provinces.
Losses in retail and wholesale trade were offset
by gains in information, culture and recreation;
17,000 construction; and agriculture. The construction industry
continued its upward trend that started in July 2009.
Average hourly wages for employees increased
by 2.1% in October compared with 12 months earlier.
16,800
Unemployment rate
16,600 %
J J J J O 9.0
2007 2008 2009 2010
8.5
Since October 2009, total employment has risen 8.0
by 375,000 (+2.2%), mostly the result of strength
over the first half of 2010, when employment growth 7.5
averaged 51,000 per month. In the last four months,
however, monthly gains have averaged 5,700. 7.0
The number of private sector employees increased
in October, while self-employment declined. Public 6.5
sector employment was unchanged.
6.0
Full-time employment rose by 47,000 in October,
while part-time fell by 44,000. Over the past three
months, losses in part time have been offset by full-time 5.5
gains. J J J J O
Employment increased among people aged 55 and 2007 2008 2009 2010
over, nearly all among women. At the same time,
Statistics Canada 1
2. Additional hiring in the private sector in October Employment gains in Alberta
The number of private sector employees increased Employment in Alberta rose by 17,000 in
by 38,000 in October, while self-employment declined October, following two months of little change. This
by 24,000. At the same time, public sector employment increase brings total gains over the past 12 months
was virtually unchanged. to 46,000 or 2.3%, slightly above the national growth
Over the past year, 337,000 employees have rate of 2.2%.
been added to the private sector and 134,000 to the Employment also increased in Prince Edward Island
public sector. The number of self-employed has fallen in October, up 1,200. Despite this increase, employment
by 96,000 over the same period. in the province remained similar to the level of 12 months
earlier.
Full-time employment continues to gain In Quebec, employment was little changed
in October. The unemployment rate rose
The number of people working full-time continued by 0.3 percentage points to 8.0%, as more people
to rise in October, up 47,000, bringing gains were looking for work.
to 164,000 over the past three months. At the same
time, the total number of hours worked has edged up. While employment in Ontario was also little
changed in October, the unemployment rate edged
Part-time employment fell by 44,000 in October, with down 0.2 percentage points to 8.6%, the result of fewer
losses totalling 132,000 over the past three months. men aged 25 and over participating in the labour market.
Construction up in October In Nova Scotia, employment fell by 8,600 in
October, following an increase the month before. This
In October, employment in the goods-producing decline pushed the unemployment rate in the province
sector rose by 36,000, led by a gain of 21,000 in up 0.8 percentage points to 9.8%.
construction. Since October 2009, employment in Employment in Newfoundland and Labrador
construction has risen by 6.0% (+72,000), one of the declined by 2,300 in October. A decrease in the number
fastest growth rates of all major industries. of people in the labour force pushed the unemployment
Within the goods sector, employment also increased rate down to 13.0%, its lowest level since June 2008.
in agriculture in October, up 9,000, while it edged up in
manufacturing. Canada’s labour market downturn two years later
The number of workers in the service sector Employment in Canada reached a high in the fall
declined by 33,000 in October, with losses concentrated of 2008, then declined steeply over a period of nine
in retail and wholesale trade (-29,000). The only service months. Since the summer of 2009, employment has
industry with a notable increase was information, culture increased, particularly in the first half of 2010.
and recreation, up 22,000.
Although employment has returned to its
More women aged 55 and over employed in October pre-recession level of October 2008, the unemployment
rate remains around 8%, well above its pre-recession
In October, employment among women aged 55 and level of 6.2%. Over this two-year period, the working-age
over increased by 16,000, while there was little change population (15 years and over) grew by 2.9%, and the
for men in this age group. At the same time, the number labour force — those working or looking for work —
of 25 to 54 year-old workers dipped by 16,000. Youth rose by 1.9%.
employment was little changed in October, following a Across the provinces, Newfoundland and Labrador
notable decline the previous month. (+3.1%), Manitoba (+2.9%), Prince Edward Island
Between October 2009 and October 2010, the (+2.3%), Quebec (+1.5%), Saskatchewan (+0.9%) and
fastest rate of employment growth was among workers British Columbia (+0.6%) added employment compared
aged 55 and over, up 7.7% for men and 7.4% for with October 2008, while New Brunswick (-1.8%), Nova
women. Scotia (-1.7%), Alberta (-1.1%) and Ontario (-0.9%)
experienced losses.
Over this year-long period, there were
also employment gains for men aged 25 to 54,
up 117,000 or 1.9%. Among women in this age group,
employment grew much slower (+27,000 or +0.5%).
2 Statistics Canada
3. These provincial differences were partly driven by
the industrial composition of the economy. Over the Growth in hours worked lags employment growth
two years, employment in the manufacturing sector hours employment
dropped 10.8%, with significant declines in Ontario in thousands in thousands
and Alberta. Transportation and warehousing declined
by 5.4%, with notable losses in Ontario, Quebec, Alberta 585,000 17,300
and New Brunswick. Natural resources remained 2.6%
580,000
below its October 2008 level, with Quebec, British 17,200
Columbia and Nova Scotia most affected. 575,000
17,100
Gains in construction were widespread across the
570,000
country, as employment in that sector has now returned 17,000
to its pre-recession level. British Columbia was the only 565,000
exception, as construction employment dropped 13.6% 16,900
below its October 2008 level. 560,000
Compared with October 2008, employment 555,000 16,800
increased notably in health care and social assistance
550,000 16,700
(+6.7%), as well as in professional, scientific and
technical services (+6.7%). All provinces shared in the J J J O
gains observed in health care and social assistance, 2008 2009 2010
but growth was particularly strong in Alberta, Nova Total actual hours worked
Scotia and Newfoundland and Labrador. Increases in Employment
professional, scientific and technical services occurred
mostly in Quebec, Ontario, British Columbia and
Manitoba. Available on CANSIM: tables 282-0001 to 282-0042,
282-0047 to 282-0064 and 282-0069 to 282-0108.
Employment fell steeply during the downturn
for youths (15 to 24) and men aged 25 to 54. Definitions, data sources and methods: survey
In October 2010, employment among youths
number 3701.
remained 7.8% below its October 2008 level, while
the number of workers aged 25 to 54 was just A more detailed summary, Labour Force Information
below its pre-recession level (-1.0% for men and
(71-001-X, free) is now available online for the week
-0.7% for women). Workers aged 55 and over,
ending October 16. From the Key resource module of
however, experienced employment growth between our website under Publications, choose All subjects,
October 2008 and October 2010, up 13.5% for women
then Labour. LAN and bulk prices are available on
and 10.0% for men. The DVD-ROM Labour Force Historical
request.
During the downturn, full-time employment saw Review, 2009 (71F0004X, $209) is now available. See
large declines, while part-time increased. Although How to order products.
overall employment has returned to its pre-recession
Data tables are also now available online. From the
level, full-time employment remains 102,000 or 0.7%
Subject module of our website, choose Labour.
below its peak, while there are 110,000 (+3.5%) more
workers employed part time. The next release of the Labour Force Survey will be
on December 3.
Total hours worked in the labour market fell
steeply during the downturn (-3.7%) and have For general information or to order data,
since picked up, increasing by 2.9%. However, contact Client Services (toll-free 1-866-873-8788;
unlike total employment, the number of hours 613-951-4090; labour@statcan.gc.ca). To enquire
worked in October 2010 remained 0.9% below the about the concepts, methods or data quality of this
October 2008 level. release, contact Vincent Ferrao (613-951-4750;
vincent.ferrao@statcan.gc.ca) or Lahouaria Yssaad
(613-951-0627; lahouaria.yssaad@statcan.gc.ca),
Labour Statistics Division.
Statistics Canada 3
4. Labour force characteristics by age and sex
September October September October September October
2010 2010 to 2009 to 2009
October to October to
2010 October 2010 October
2010 2010
Seasonally adjusted
thousands change in thousands % change
Both sexes, 15 years and over
Population 27,809.6 27,840.4 30.8 407.3 0.1 1.5
Labour force 18,702.7 18,698.4 -4.3 319.1 0.0 1.7
Employment 17,209.7 17,212.7 3.0 375.2 0.0 2.2
Full-time 13,862.6 13,909.8 47.2 218.6 0.3 1.6
Part-time 3,347.1 3,302.9 -44.2 156.5 -1.3 5.0
Unemployment 1,493.0 1,485.7 -7.3 -56.0 -0.5 -3.6
Participation rate 67.3 67.2 -0.1 0.2 ... ...
Unemployment rate 8.0 7.9 -0.1 -0.5 ... ...
Employment rate 61.9 61.8 -0.1 0.4 ... ...
Part-time rate 19.4 19.2 -0.2 0.5 ... ...
Youths, 15 to 24 years
Population 4,409.3 4,409.8 0.5 10.7 0.0 0.2
Labour force 2,821.0 2,827.4 6.4 17.0 0.2 0.6
Employment 2,401.6 2,402.7 1.1 20.3 0.0 0.9
Full-time 1,250.1 1,251.1 1.0 -44.6 0.1 -3.4
Part-time 1,151.6 1,151.5 -0.1 64.8 0.0 6.0
Unemployment 419.4 424.7 5.3 -3.3 1.3 -0.8
Participation rate 64.0 64.1 0.1 0.2 ... ...
Unemployment rate 14.9 15.0 0.1 -0.2 ... ...
Employment rate 54.5 54.5 0.0 0.3 ... ...
Part-time rate 48.0 47.9 -0.1 2.3 ... ...
Men, 25 years and over
Population 11,447.7 11,462.5 14.8 196.6 0.1 1.7
Labour force 8,443.1 8,411.5 -31.6 150.6 -0.4 1.8
Employment 7,841.1 7,834.5 -6.6 235.2 -0.1 3.1
Full-time 7,213.3 7,220.3 7.0 191.1 0.1 2.7
Part-time 627.8 614.3 -13.5 44.2 -2.2 7.8
Unemployment 602.1 576.9 -25.2 -84.7 -4.2 -12.8
Participation rate 73.8 73.4 -0.4 0.1 ... ...
Unemployment rate 7.1 6.9 -0.2 -1.1 ... ...
Employment rate 68.5 68.3 -0.2 0.8 ... ...
Part-time rate 8.0 7.8 -0.2 0.3 ... ...
Women, 25 years and over
Population 11,952.7 11,968.0 15.3 199.9 0.1 1.7
Labour force 7,438.5 7,459.5 21.0 151.5 0.3 2.1
Employment 6,967.0 6,975.5 8.5 119.7 0.1 1.7
Full-time 5,399.2 5,438.4 39.2 72.2 0.7 1.3
Part-time 1,567.7 1,537.1 -30.6 47.6 -2.0 3.2
Unemployment 471.6 484.1 12.5 31.9 2.7 7.1
Participation rate 62.2 62.3 0.1 0.2 ... ...
Unemployment rate 6.3 6.5 0.2 0.3 ... ...
Employment rate 58.3 58.3 0.0 0.0 ... ...
Part-time rate 22.5 22.0 -0.5 0.3 ... ...
... not applicable
Note: Related CANSIM table 282-0087.
4 Statistics Canada
5. Employment by class of worker and industry (based on NAICS)1
September October September October September October
2010 2010 to 2009 to 2009
October to October to
2010 October 2010 October
2010 2010
Seasonally adjusted
thousands change in thousands % change
Class of worker
Employees 14,519.4 14,546.4 27.0 470.8 0.2 3.3
Self-employed 2,690.3 2,666.2 -24.1 -95.7 -0.9 -3.5
Public/private sector employees
Public 3,562.2 3,551.5 -10.7 133.6 -0.3 3.9
Private 10,957.2 10,995.0 37.8 337.3 0.3 3.2
All industries 17,209.7 17,212.7 3.0 375.2 0.0 2.2
Goods-producing sector 3,772.6 3,808.4 35.8 80.9 0.9 2.2
Agriculture 297.6 306.1 8.5 -16.1 2.9 -5.0
Natural resources 334.9 329.6 -5.3 30.4 -1.6 10.2
Utilities 150.3 151.9 1.6 2.5 1.1 1.7
Construction 1,243.3 1,264.1 20.8 71.9 1.7 6.0
Manufacturing 1,746.6 1,756.5 9.9 -8.0 0.6 -0.5
Services-producing sector 13,437.0 13,404.3 -32.7 294.3 -0.2 2.2
Trade 2,697.0 2,668.1 -28.9 37.4 -1.1 1.4
Transportation and warehousing 819.1 819.1 0.0 -1.0 0.0 -0.1
Finance, insurance, real estate and leasing 1,103.4 1,108.4 5.0 -10.3 0.5 -0.9
Professional, scientific and technical services 1,288.0 1,285.1 -2.9 85.5 -0.2 7.1
Business, building and other support services 680.3 679.2 -1.1 46.1 -0.2 7.3
Educational services 1,222.3 1,216.3 -6.0 10.9 -0.5 0.9
Health care and social assistance 2,066.0 2,056.2 -9.8 95.7 -0.5 4.9
Information, culture and recreation 757.9 780.0 22.1 -3.3 2.9 -0.4
Accommodation and food services 1,055.5 1,046.9 -8.6 3.8 -0.8 0.4
Other services 764.7 759.7 -5.0 -24.9 -0.7 -3.2
Public administration 982.9 985.3 2.4 54.3 0.2 5.8
1. North American Industry Classification System.
Note: Related to CANSIM tables 282-0088 and 282-0089.
Statistics Canada 5
6. Labour force characteristics by province
September October September October September October
2010 2010 to 2009 to 2009
October to October to
2010 October 2010 October
2010 2010
Seasonally adjusted
thousands change in thousands % change
Newfoundland and Labrador
Population 432.0 432.0 0.0 2.1 0.0 0.5
Labour force 263.8 259.8 -4.0 3.4 -1.5 1.3
Employment 228.3 226.0 -2.3 13.1 -1.0 6.2
Full-time 195.2 194.2 -1.0 12.9 -0.5 7.1
Part-time 33.1 31.8 -1.3 0.2 -3.9 0.6
Unemployment 35.5 33.8 -1.7 -9.8 -4.8 -22.5
Participation rate 61.1 60.1 -1.0 0.5 ... ...
Unemployment rate 13.5 13.0 -0.5 -4.0 ... ...
Employment rate 52.8 52.3 -0.5 2.8 ... ...
Prince Edward Island
Population 117.9 118.2 0.3 1.8 0.3 1.5
Labour force 80.8 81.5 0.7 1.8 0.9 2.3
Employment 69.8 71.0 1.2 0.4 1.7 0.6
Full-time 57.0 58.1 1.1 0.9 1.9 1.6
Part-time 12.7 12.9 0.2 -0.5 1.6 -3.7
Unemployment 11.0 10.5 -0.5 1.4 -4.5 15.4
Participation rate 68.5 69.0 0.5 0.5 ... ...
Unemployment rate 13.6 12.9 -0.7 1.5 ... ...
Employment rate 59.2 60.1 0.9 -0.6 ... ...
Nova Scotia
Population 777.2 777.4 0.2 3.7 0.0 0.5
Labour force 504.5 499.4 -5.1 -0.3 -1.0 -0.1
Employment 459.1 450.5 -8.6 -3.5 -1.9 -0.8
Full-time 368.8 365.2 -3.6 -8.5 -1.0 -2.3
Part-time 90.3 85.3 -5.0 5.0 -5.5 6.2
Unemployment 45.5 48.9 3.4 3.2 7.5 7.0
Participation rate 64.9 64.2 -0.7 -0.4 ... ...
Unemployment rate 9.0 9.8 0.8 0.7 ... ...
Employment rate 59.1 57.9 -1.2 -0.8 ... ...
New Brunswick (correction)
Population * 625.5 625.9 0.4 3.6 0.1 0.6
Labour force * 401.7 401.6 -0.1 -2.1 0.0 -0.5
Employment * 362.3 362.1 -0.2 -7.9 -0.1 -2.1
Full-time * 305.5 306.7 1.2 -5.8 0.4 -1.9
Part-time * 56.9 55.5 -1.4 -2.0 -2.5 -3.5
Unemployment * 39.4 39.5 0.1 5.8 0.3 17.2
Participation rate 64.2 64.2 0.0 -0.7 ... ...
Unemployment rate 9.8 9.8 0.0 1.5 ... ...
Employment rate 57.9 57.9 0.0 -1.6 ... ...
Quebec
Population 6,533.4 6,540.3 6.9 81.6 0.1 1.3
Labour force 4,283.8 4,293.7 9.9 110.6 0.2 2.6
Employment 3,953.4 3,949.6 -3.8 113.5 -0.1 3.0
Full-time 3,191.8 3,189.8 -2.0 46.3 -0.1 1.5
Part-time 761.6 759.8 -1.8 67.2 -0.2 9.7
Unemployment 330.4 344.1 13.7 -2.9 4.1 -0.8
Participation rate 65.6 65.6 0.0 0.8 ... ...
Unemployment rate 7.7 8.0 0.3 -0.3 ... ...
Employment rate 60.5 60.4 -0.1 1.0 ... ...
... not applicable
* please note that these labels were corrected at 8:25 a.m. on November 5, 2010
Note: Related CANSIM table 282-0087.
6 Statistics Canada
7. Labour force characteristics by province
September October September October September October
2010 2010 to 2009 to 2009
October to October to
2010 October 2010 October
2010 2010
Seasonally adjusted
thousands change in thousands % change
Ontario
Population 10,853.6 10,866.8 13.2 159.2 0.1 1.5
Labour force 7,307.3 7,287.3 -20.0 107.2 -0.3 1.5
Employment 6,662.0 6,659.2 -2.8 127.9 0.0 2.0
Full-time 5,356.4 5,385.8 29.4 89.5 0.5 1.7
Part-time 1,305.5 1,273.4 -32.1 38.5 -2.5 3.1
Unemployment 645.3 628.1 -17.2 -20.7 -2.7 -3.2
Participation rate 67.3 67.1 -0.2 0.0 ... ...
Unemployment rate 8.8 8.6 -0.2 -0.4 ... ...
Employment rate 61.4 61.3 -0.1 0.3 ... ...
Manitoba
Population 939.8 940.9 1.1 14.0 0.1 1.5
Labour force 659.0 659.6 0.6 16.7 0.1 2.6
Employment 623.7 625.3 1.6 19.2 0.3 3.2
Full-time 502.4 504.6 2.2 15.1 0.4 3.1
Part-time 121.2 120.7 -0.5 4.1 -0.4 3.5
Unemployment 35.4 34.3 -1.1 -2.5 -3.1 -6.8
Participation rate 70.1 70.1 0.0 0.7 ... ...
Unemployment rate 5.4 5.2 -0.2 -0.5 ... ...
Employment rate 66.4 66.5 0.1 1.1 ... ...
Saskatchewan
Population 794.1 794.8 0.7 11.8 0.1 1.5
Labour force 557.8 557.7 -0.1 9.8 0.0 1.8
Employment 526.8 525.8 -1.0 6.0 -0.2 1.2
Full-time 426.1 435.6 9.5 10.5 2.2 2.5
Part-time 100.7 90.1 -10.6 -4.6 -10.5 -4.9
Unemployment 30.9 32.0 1.1 3.9 3.6 13.9
Participation rate 70.2 70.2 0.0 0.2 ... ...
Unemployment rate 5.5 5.7 0.2 0.6 ... ...
Employment rate 66.3 66.2 -0.1 -0.2 ... ...
Alberta
Population 2,939.7 2,943.4 3.7 56.3 0.1 2.0
Labour force 2,135.8 2,150.8 15.0 23.3 0.7 1.1
Employment 2,004.2 2,021.2 17.0 46.1 0.8 2.3
Full-time 1,652.2 1,655.2 3.0 26.7 0.2 1.6
Part-time 352.0 366.0 14.0 19.5 4.0 5.6
Unemployment 131.6 129.5 -2.1 -22.9 -1.6 -15.0
Participation rate 72.7 73.1 0.4 -0.6 ... ...
Unemployment rate 6.2 6.0 -0.2 -1.2 ... ...
Employment rate 68.2 68.7 0.5 0.3 ... ...
British Columbia
Population 3,796.4 3,800.7 4.3 73.2 0.1 2.0
Labour force 2,508.2 2,507.0 -1.2 48.6 0.0 2.0
Employment 2,320.3 2,321.8 1.5 60.1 0.1 2.7
Full-time 1,807.1 1,814.5 7.4 31.0 0.4 1.7
Part-time 513.1 507.3 -5.8 29.1 -1.1 6.1
Unemployment 187.9 185.1 -2.8 -11.6 -1.5 -5.9
Participation rate 66.1 66.0 -0.1 0.0 ... ...
Unemployment rate 7.5 7.4 -0.1 -0.6 ... ...
Employment rate 61.1 61.1 0.0 0.4 ... ...
... not applicable
Note: Related CANSIM table 282-0087.
Statistics Canada 7