Weitere ähnliche Inhalte Ähnlich wie Community of Practice Trends Q1 2013 Ähnlich wie Community of Practice Trends Q1 2013 (7) Mehr von CARE Economic Development Unit Mehr von CARE Economic Development Unit (20) 1. June 14, 2013
1
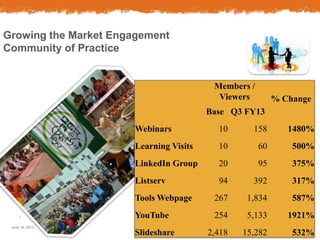
Growing the Market Engagement
Community of Practice
Members /
Viewers % Change
Base Q3 FY13
Webinars 10 158 1480%
Learning Visits 10 60 500%
LinkedIn Group 20 95 375%
Listserv 94 392 317%
Tools Webpage 267 1,834 587%
YouTube 254 5,133 1921%
Slideshare 2,418 15,282 532%
2. Online Content Available
June 14, 2013
2
Q1 - 2012 Q2 - 2012 Q3 - 2012 Q4 - 2012 Q1 - 2013
SharePoint Publications 70% 96% 115% 138% 140%
YouTube Videos 260% 300% 460% 500% 500%
Slideshare Presentations 183% 250% 292% 300%
Flickr Photos 34% 34% 34%
0%
100%
200%
300%
400%
500%
600%
PercentageChange Growth in Content
3. Online Staff Engagement
June 14, 2013
3
0%
500%
1000%
1500%
2000%
2500%
Q4 - 2011 Q1 - 2012 Q2 - 2012 Q3 - 2012 Q4 - 2012 Q1 - 2013
Increase in Views/Downloads
YouTube (views)
Slideshare (views)
Flickr (views)
Membership Growth
Channel Previous Quarter Q1 2013 % Change
SEAD Chat subscribers 360 392 9%
LinkedIn
Members 70 95 36%
Contributors 28 32 14%
Discussions 69 91 32%
Comments 97 145 49%
4. Market Analysis and Value Chain Program Design E-Course
June 14, 2013
4
0 10 20 30 40 50 60 70
Finishers
Learners
Interested but stagnant
Signed on once
Never started
E-Course Statistics as of Q1 2013
0
20
40
60
80
100
120
140
160
Q1 - 2012 Q3 - 2012 Q4 - 2012 Q1 - 2013NumberofStudents
E-Course Trends by Quarter
Never started
Signed on once
Interested but stagnant
Learners
Finishers