1. SPRING 2011 | RETAIL
UNITED STATES
HIGHLIGHTS
Retail Real Estate Faring Better,
But Many Challenges Still Exist
ROSS J. MOORE Chief Economist | USA
MARKET INDICATORS
Compared to the dismal conditions of two years ago, the retail leasing market is considerably
Spring Fall
2011 2011* better as the first half of 2011 comes to a close. Yet, for many retailers and landlords, the retail
landscape still remains very challenging. While retail sales have been inching higher for much
VACANCY of the past year, the gains have been exceptionally uneven with discount and high end retailers
thriving, while mid-range retailers continue to struggle in the face of lackluster job growth,
NET ABSORPTION
stagnant wages, restrictive credit conditions, higher input costs, falling house values and
CONSTRUCTION sharply higher gas prices. However, the economy continues to grow, new entrants are entering
the market and many existing retailers are poised for growth.
RENTAL RATE
*Projected, relative to prior period LATEST CONSUMER CONFIDENCE INDEX FALLS TO 60.8 IN MAY
FROM 66.0 IN APRIL
Reflecting the fragile nature of the U.S. consumer, the Conference Board’s Consumer
Confidence Index (CCI) still remains well below its long-term average. For the first five months
of 2011 the CCI has vacillated between 60 and 70. While this represents a considerable
improvement from the lows experienced in 2009, it is still below 90 that is regarded as a
U.S. RETAIL MARKET
SUMMARY STATISTICS, Q1 2011 healthy level.
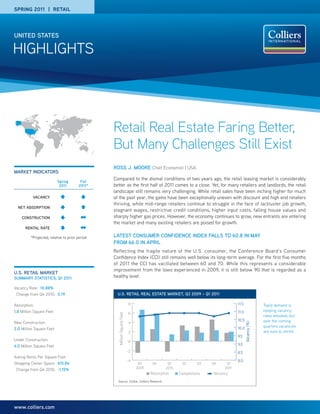
Vacancy Rate: 10.88%
Change from Q4 2010: 0.19 U.S. RETAIL REAL ESTATE MARKET, Q3 2009 – Q1 2011
Absorption: 8 11.5 Tepid demand is
1.8 Million Square Feet 11.0 keeping vacancy
6
Million Square Feet
rates elevated, but
10.5 over the coming
New Construction: 4
Vacancy (%)
10.0 quarters vacancies
2.0 Million Square Feet
2 are sure to shrink.
9.5
Under Construction: 0
4.0 Million Square Feet 9.0
-2 8.5
Asking Rents Per Square Foot
-4 8.0
Shopping Center Space: $15.86 Q3 Q4 Q1 Q2 Q3 Q4 Q1
Change from Q4 2010: -1.15% 2009 2010 2011
Absorption Completions Vacancy
Source: CoStar, Colliers Research
www.colliers.com
2. HIGHLIGHTS | SPRING 2011 | RETAIL | UNITED STATES
UNITED STATES | SHOPPING CENTER MARKET STATISTICS
INVENTORY* NEW UNDER VACANCY VACANCY ABSORPTION QUOTED RENT YTD CHANGE
MAR. 31, 2011 SUPPLY CONSTRUCTION RATE (%) RATE (%) Q1 2011 (USD PSF) IN RENT
MARKET (SF) Q1 2011 (SF) (SF) DEC. 31, 2010 MAR. 31, 2011 (SF) MAR. 31, 2011 (%)
Atlanta, GA 141,927,000 0 329,571 14.70 14.40 401,566 13.33 -1.2
Bakersfield, CA 8,902,000 0 35,000 8.30 8.50 31,173 15.27 1.2
Baltimore, MD 47,368,000 20,904 28,555 7.50 7.90 -99,930 18.58 0.5
Boise, ID 12,494,000 8,000 6,000 12.00 11.90 11,413 12.27 -0.4
Boston, MA 86,977,000 7,200 135,000 7.00 6.90 169,961 15.48 -3.0
Charleston, SC 12,770,000 11,500 4,860 11.00 10.00 135,652 13.62 -0.1
Charlotte, NC 52,259,000 70,000 0 11.90 12.10 -80,779 13.00 -0.8
Chicago, IL 164,143,000 47,000 0 12.40 12.20 217,640 15.87 2.5
Cincinnati, OH 35,099,000 0 0 14.30 14.40 -47,692 10.88 -3.3
Cleveland, OH 49,571,000 20,966 0 12.40 12.90 -127,812 11.25 -2.2
Columbia, SC 15,512,000 0 0 8.30 8.20 5,675 11.42 -3.4
Columbus, OH 29,726,000 67,600 15,318 13.60 13.70 82,926 12.70 4.3
Dallas/Ft. Worth, TX 151,862,000 6,400 195,595 13.10 13.30 -108,591 13.14 1.0
Denver, CO 70,221,000 206,930 280,303 10.50 10.40 314,098 14.10 -1.9
Detroit, MI 69,313,000 7,250 33,644 16.10 15.90 31,584 12.56 1.2
Fresno, CA 24,904,000 0 0 11.20 11.50 -110,011 13.26 -2.9
Ft. Lauderdale-Broward Co., FL 48,363,000 0 0 10.50 11.00 -84,391 17.34 -0.4
Greenville/Spartanburg, SC 29,238,000 187,545 28,800 11.90 11.50 230,911 9.44 -1.8
Hartford, CT 41,858,000 90,500 18,742 8.60 8.70 27,413 13.70 0.9
Hawaii 17,296,045 0 0 4.10 3.90 2,173 32.58 1.6
Houston, TX 151,704,000 48,600 124,211 10.40 10.30 155,333 14.07 -1.0
Indianapolis, IN 39,741,000 9,000 0 12.90 12.90 -138,163 11.76 -1.0
Jacksonville, FL 35,476,000 0 23,495 13.60 13.00 108,301 13.74 -0.4
Kansas City, MO-KS 39,386,000 0 11,060 15.10 14.60 8,368 11.79 0.6
Las Vegas, NV 49,962,000 0 29,400 15.40 15.90 -208,755 17.33 -3.7
Little Rock, AK 14,963,000 0 0 8.20 8.20 -33,883 9.20 5.9
Long Island, NY 50,013,000 284960 44907 4.70 4.90 317,357 24.04 -0.7
Los Angeles – Inland Empire, CA 84,842,000 32,554 69,383 11.60 11.80 -216,872 18.05 1.0
Los Angeles, CA 146,699,000 4,745 101,507 6.90 6.70 -123,454 23.11 -3.3
Louisville, KY 27,729,000 405 5,500 12.70 11.60 301,718 10.88 -2.8
Memphis, TN 30,607,000 313 0 12.50 13.00 -38,858 10.66 -2.1
Miami/Dade County, FL 44,299,000 0 52,780 6.50 6.10 153,626 21.65 -2.0
Milwaukee, WI 33,572,000 9,140 0 11.50 11.90 -14,006 12.06 -2.1
Minneapolis, MN 53,827,000 1,479 190,000 9.60 9.70 -114,756 13.51 -2.2
Nashville, TN 30,068,000 0 0 10.70 10.60 89,907 13.62 -0.4
New Jersey - Northern 91,183,000 37,974 227,956 8.70 8.90 -70,824 19.72 -0.2
Oakland/East Bay, CA 41,526,000 4,500 39,078 7.30 7.10 89,027 21.65 -3.0
Oklahoma City, OK 29,157,000 25000 257541 11.20 11.2 -7823 10.12 0.3
Omaha, NB 16,180,000 43000 0 12.10 12.2 23315 11.04 -4.3
Orange County, CA 63,238,000 0 15,000 6.60 6.20 199,313 22.54 -3.0
Orlando, FL 62,960,000 18,038 36,218 11.80 12.00 -55,940 15.34 -0.8
Palm Beach County, FL 35,726,000 0 0 11.30 11.20 108,839 17.53 -1.7
Philadelphia, PA 149,415,000 54,824 578,604 9.70 9.60 142,191 14.38 -1.0
Phoenix, AZ 103,779,000 1,504 51,284 15.30 16.00 -430,105 14.89 -3.0
Portland, OR 33,932,000 24,000 276,286 8.10 8.50 -32,818 18.20 -0.8
Raleigh/Durham/Chapel Hill, NC 37,847,000 345,933 145,165 8.90 8.50 417,597 14.33 -5.4
Reno, NV 10,337,000 0 0 14.60 14.60 11,608 15.89 -1.1
Sacramento, CA 50,407,000 0 0 13.80 13.80 -31,821 17.55 -2.2
San Diego, CA 54,688,000 34,288 3,500 7.70 7.70 45,320 21.25 -0.8
San Francisco, CA 10,181,000 0 0 4.80 5.10 -45,140 28.43 -5.9
San Jose/South Bay, CA 31,666,000 32,067 137,177 7.30 7.20 13,033 26.22 -3.1
Savannah, GA 6,747,000 0 36,023 8.00 7.80 18,423 14.75 2.0
Seattle/Puget Sound, WA 56,006,000 8,288 45,987 10.40 10.70 -74,620 18.25 -0.7
St. Louis, MO-KS 52,864,000 14,947 231,535 11.00 10.80 157,975 12.41 -0.9
Stockton, CA 18,982,000 0 0 11.10 11.30 -20,722 15.35 -1.7
Tampa/St. Petersburg, FL 87,569,000 85,781 0 11.00 11.00 122,147 13.27 -0.9
Washington, DC 83,843,000 144,734 51,353 7.40 7.50 -54,994 22.67 1.3
Westchester County, NY 31,712,978 0 152,900 6.40 6.40 -5,649 18.62 0.0
U.S. TOTAL/AVERAGE 3,070,924,045 2,017,869 4,049,238 10.69 10.88 1,767,174 15.86 -1.15
*Community and Neighborhood Centers. Source: CoStar, Colliers Research
P. 2 | COLLIERS INTERNATIONAL
3. HIGHLIGHTS | SPRING 2010 | RETAIL | UNITED STATES
Consumer confidence is a key variable which U.S. RETAIL REAL ESTATE INVESTMENT PERFORMANCE, 1999-2011
can act as an important barometer for retail-
ers and landlords. The soft labor market and 50 46.8
still-uncertain economic backdrop are both 40
40.0
preventing consumers from increasing their 33.4
30.4 29.0
30 27.2
spending behavior. Until consumers feel more 21.1
23.0
20.0
confident about job security and see a drop in 20 18.0 17.1
Annual Total Returns (%)
13.7 11.8 13.4 13.5 12.6
9.6
gas and food prices, it is hard to foresee the 10 7.8 6.7 4.51**
CCI moving above the 60 to 70 level. At these 1.0*
0
levels, most consumers will be hesitant to
-4.1
make big purchases and will be preoccupied -10
-10.9
with a search for value at the best possible -20 -11.8 -15.8
price.
-30
Private Equity Public Equity
UNEMPLOYMENT IS EXPECTED -40
-48.4
TO REMAIN ELEVATED THROUGH -50
1999 2000 2001 2002 2003 2004 2005 2006 2007 2008 2009 2010 2011
AT LEAST 2015
U.S. unemployment is forecast to finish the *YTD Q1 returns only **YTD March returns only
Source: National Council of Real Estate Investment Fiduciaries, National Association of Real Estate Investment Trusts
year at 8.6 percent and is not expected to
drop below 7.0 percent until 2015 (IHS Global
Insight). The May jobs report shows the
national unemployment rate was 9.1 percent, With so many headwinds, the retail landscape the Federal Reserve shows that outstanding
with many states and metros still registering remains a broad mix of winners and losers. commercial loans and industrial leases have
double-digit unemployment. The latest data Bankruptcies continue to be a feature of an increased for the seventh consecutive month,
shows stubbornly high unemployment rates in uncertain market landscape. In the past year after shrinking for much of 2008, 2009 and
states such as Nevada, California, Michigan the market has had to digest many retailers 2010. Publicly traded retailers have also seen
and Florida in particular. Major metropolitan seeking Chapter 11 bankruptcy protection, a surge in their share price, allowing many to
areas with double-digit unemployment rates including Borders Group, Blockbuster Video, raise new equity and once again have access
include Charlotte, Detroit, Las Vegas, Los Great Atlantic & Pacific Tea (A&P), Sbarro to the capital markets. However, small busi-
Angeles, Memphis, Miami, Sacramento, San Pizza and recently, the Perkins & Marie nesses—often family-owned—continue to
Jose and Tampa. Callender’s restaurant chains. These bank- face a very restrictive lending environment,
ruptcies are primarily due to competition from restricting new concepts and franchise
A weak labor market is not the only factor wholesale clubs, the entry of drug stores in opportunities.
negatively impacting consumer spending. new retail categories and the continued
The latest Commerce Department data shows expansion of supercenters. Rising input costs, After a surge in store closings in 2008 and
personal incomes are up 4.4 percent for the technology and changing spending habits have 2009, retailers’ shutting stores appears to ave
year ending April; however, real disposable also contributed. These most recent bankrupt- moderated. Data from the International
incomes are up a more modest 1.2 percent. cies come on the heels of Circuit City and Council of Shopping Centers (ICSC) indicates
With a relatively weak labor market, incomes Linens ’n Things,
after inflation are unlikely to grow any more both of which filed
than 1.0 or 2.0 percent. This is a significant for Chapter 11 RETAIL SPACE DELIVERIES, 2000-2011
headwind, and not one that is expected to protection in 2008,
300
disappear anytime soon. but also have yet to
lease up many of the 250
Simultaneously, based on the last few months, empty stores scat-
the savings rate appears to have leveled out t e re d a c ro ss t h e
Million Square Feet
200
near 5.0 percent. For the past year the country.
150
savings rate has ranged between 5.0 and 6.0
percent. According to statistics from the U.S. One positive change 100
Bureau of Economic Analysis, the personal over the past 12
savings rate in the U.S. hovered in the 0.0 months has been the 50
percent to 1.0 percent range from 2005 to gradual return of
early 2008. While this newfound prudence is credit in the wake of 0
2000 2001 2002 2003 2004 2005 2006 2007 2008 2009 2010 2011*
something that is good for consumers in the the global financial *Future deliveries based on current under-construction buildings
long run, it is yet another factor behind crisis of 2008/2009. Source: CoStar
reduced consumer spending. May 2011 data from
COLLIERS INTERNATIONAL | P. 3
4. HIGHLIGHTS | SPRING 2011 | RETAIL | UNITED STATES
shopping centers being anchored by more
YEAR-TO-DATE SALES ENDING APRIL 2011 – U.S. CONSUMER
stable retailers such as grocery and drug
ANNUAL stores, vacancies remain elevated by historic
2011 2010 CHANGE (%) standards.
All Stores 1,471,037 1,361,222 8.1
Motor Vehicle and Parts Dealers 268,412 234,189 14.6 With retail vacancies staying stubbornly high,
Gasoline Stations 166,213 142,195 16.9 a significant number of markets still have
retail vacancy rates above the 12-percent
All Stores less Automotive 1,036,412 984,838 5.2
mark. Phoenix, Detroit and Las Vegas in
Food and Beverage Stores 195,947 187,111 4.7
particular have vacancies over 15 percent, but
Grocery Stores 177,249 168,767 5.0
in descending order all of the following
Health and Personal Care Stores 90,433 85,523 5.7 markets have vacancis of 12 percent or
All Stores Less Automotive, Food, Pharmacies 750,032 712,204 5.3 higher: Reno (14.6%), Kansas City (14.6%),
Building Material and Garden Equipment 87,287 84,913 2.8 At l a n t a ( 1 4 .4 % ) , C i n c i nn a t i ( 1 4 .4 % ) ,
Stores Sacramento (13.8%), Columbus (13.7%),
General Merchandise Stores 191,726 186,735 2.7 Dallas/Ft. Worth (13.3%), Jacksonville
Department Stores (excluding leased 53,224 54,393 -2.1 (13.0%), Memphis (13.0%), Cleveland (12.9%),
departments) Indianapolis (12.9%), Chicago (12.2%), Omaha
Clothing and Accessories Stores 66,150 62,752 5.4 (12.2%) and Charlotte (12.1%). Cities that
Furniture, Home Furnishings, Electronics and 58,759 58,601 0.3 have seen vacancies drop below 12 percent in
Appliance Stores the last year include Bakersfield (8.5%),
Furniture and Home Furnishing Stores 27,757 27,720 0.1 Fresno (11.5%), Greenville/Spartanburg
Electronics and Appliance Stores 31,002 30,881 0.4 (11.5%), St. Louis 10.8%), and Houston
Sporting Goods, Hobby, Book and Music Stores 25,935 24,769 4.7
(10.3%).
Miscellaneous Store Retailers 35,778 33,211 7.7
Some of the strongest U.S. markets in terms
Nonstore Retailers 126,681 111,267 13.9
of low vacancy are those that are land-
Food Services and Drinking Places 157,716 149,956 5.2 constrained and have seen a pronounced
Source: U.S. Census Bureau. All values are expressed in millions of U.S. dollars and are not seasonally adjusted. bounce-back in their local economy. San
Francisco, a city of just 49 square miles with
that a total of 146,000 stores closed in both Honolulu (Waikiki), Seattle, Greenwich, only a handful of neighborhood/community
2008 and 2009, while preliminary data Washington, D.C., San Francisco, San Jose centers, serves as a poster child for this
suggests 2010 closings fell to approximately (Santana Row) and Miami continue to perform scenario with a vacancy rate of just 5.1%.
130,000. This number is expected to stay better than their suburban counterparts. That being said, there were a number of
near this level, highlighting the challenging markets that recorded vacancy levels of 7.0%
nature of retail. The average rent for Manhattan’s Fifth Avenue or less—namely Los Angeles (6.7%), Miami/
surged over the past year, rising by $900.00 Dade County (6.1%), Boston (6.9%), Hawaii
URBAN RETAIL to register $2,150.00 per square foot. New (3.9%), Long Island (4.9%), Orange County
York’s Madison Avenue also jumped higher, (6.2%) and Westchester County (6.4%).
Urban retail continues to be a bright spot
increasing by $118.00 to average $708.00 per
relative to suburban retail—however, even the
square foot. Storefront retail rents on Los OCCUPANCY GROWTH/
country’s premier streets are finding leasing
Angeles’ Rodeo Drive largely held steady at ABSORPTION TRENDS
markets fairly challenging. New York, and in
$425.00 per square foot. Miami’s Lincoln
particular Fifth Avenue, is a clear exception, In terms of occupancy growth, positive net
Road shopping district (South Beach) saw
buoyed by a bounce-back in the financial absorption was recorded in 32 of the 58
rents increase by $35.00, with current aver-
services sector and a surge in tourism. markets tracked, with the balance returning
age asking rents standing at $135.00 per
Beyond New York, however, landlords space to the market. For the 58 markets, first-
square foot. Post Street, in San Francisco’s
continue to struggle to push rents higher. quarter absorption totaled 1.9 million square
Union Square shopping district, saw rents
Supporting urban retail and keeping vacancy feet. This compares with 4.6 million square
increase by 6.3% to $340.00 per square foot.
low is the lack of new construction, with only feet in the fourth quarter and a contraction of
modest new supply coming on line, often in 2.2 million square feet in the same period a
the form of mixed use. Critical to many down- VACANCY SURVEY year ago.
town retail leasing markets is the preference First-quarter data indicates a current national
by many new non-U.S. retailers to locate in vacancy rate of 10.88 percent for neighbor- In contrast to a few years ago, very few
more familiar urban environments. Vibrant hood/community centers—an increase of 19 markets are posting significant occupancy
urban retail markets such as New York, basis points during the quarter, broadly in line losses, with the exception of Phoenix, where
Boston, Los Angeles (West), Chicago, with Q1 2010. Despite many of these occupied space contracted by 430,000 square
P. 4 | COLLIERS INTERNATIONAL
5. HIGHLIGHTS | SPRING 2010 | RETAIL | UNITED STATES
feet. Of the five markets registering significant positive net absorption,
METRO AREAS INDICATING DOMINANT FORM OF DEVELOPMENT
Raleigh-Durham led the with way with occupied space increasing by
418,000 square feet, followed by Atlanta (402,000 square feet), Long
Island (318,000 square feet), Denver (314,000 square feet) and St. 2011
Louis (302,000 square feet).
Neighborhood
CONSTRUCTION OUTLOOK Mixed Use Center
20% 16%
The outlook for retail construction remains extremely subdued. During
the first quarter, just 2.0 million square feet was brought to the market. Lifestyle
9%
This was broadly in line with the prior quarter and only marginally up
from a year ago. Compared to the 2005–2007 period, however, Power
current construction is just a fraction of what it was—approximately 10 Center
Freestanding 9%
percent. 33%
Looking toward the balance of 2011 and into 2012, there is little likeli- Community Center
hood of development increasing anytime soon. Only 4.0 million square 7%
feet of development was underway at the end of the first quarter, Streetfront/Urban In ll
compared with 6.9 million square feet a year ago. Construction financ- 5%
Source: Colliers Research.
ing remains very difficult to secure, and rents remain too low to justify Based on 55 U.S. metropolitan areas.
new construction. Of the new retail development taking place, most
will be power or outlet centers, mixed-use or stand-alone. 2010
RENTAL RATE TRENDS
Mixed Use Streetfront/
Despite a general improvement in leasing conditions, rents continue to 20% Urban In ll
10%
drift lower. During the first quarter, shopping center (neighborhood Lifestyle
and community) rents fell a further 1.2 percent to average $15.86 per 15%
Power
square foot. This is the tenth consecutive quarter rents have declined Center
and are now 14.3 percent below levels recorded in the third quarter of 5%
2008. This masks the fact that many markets have seen rents fall by Community
Freestanding Center: 2%
more than twice this amount and even more once concessions are 20%
Enclosed: 2%
taken into account. Neighborhood
Center
27%
EXPANDING CONCEPTS
A more challenging economy has not been without some winners.
Deep discount retailers are expanding aggressively and new entrants Source: Colliers Research.
in the high-fashion, low price-point sector are opening new stores Based on 41 U.S. metropolitan areas.
wherever possible. Discounters including dollar stores, Costco,
Winners and Sam’s Club have thrived over the past several years.
Drug stores, restaurants, fast food and grocery stores remain the most
active retail categories. Changing demographics continue to help the
drug store sector even during the recent downturn in the economy.
Drug stores are viewed as recession-resistant for two reasons: first,
the aging boomer generation ensures more demand for healthcare;
and second, advances in medicine—as well as strong marketing from
pharmaceutical companies—has helped to significantly boost prescrip-
tion drug consumption.
Just as consumers are moving toward the discounter ranks, the same
is true for dining. Continued steady same-store sale increases
recorded by McDonald’s highlight the growth of the entire fast food
sector. Within the fast-food dining sector, burger operators such as
In-N-Out, Smashburger and Five Guys are particular standouts. Fast
food users are the third-most active user group in our national survey.
COLLIERS INTERNATIONAL | P. 5
6. HIGHLIGHTS | SPRING 2011 | RETAIL | UNITED STATES
RETAILERS RANKED BY ACTIVITY LOOKING AHEAD
The overall retail landscape should broadly improve with the economy,
2011 even if recovery is sluggish. Job growth is frustratingly slow, but job
creation is focused on high-skill, high-pay jobs. This partly explains the
dichotomy that exists in retail today where high-end retailers such as
Fast Food
10% Saks, Neiman Marcus and Nordstrom are posting double-digit same-
Restaurants Supermarket/ store sales growth, while discounters such as Dollar Tree, Dollar
13% Food Stores General and Family Dollar are also recording robust sales.
17%
Drug Stores
Online sales are also becoming a significant feature of the retail sector,
Discount
Retailers 9% and an accepted sales channel for almost all retailers, including depart-
23% ment stores.; for instance, Macy’s May sales numbers were highlighted
Banks by a 38 percent increase in online sales year-over-year.
9%
Other
12% One key trend that will significantly reduce demand in coming quar-
Apparel: 4% ters is the move to reduce store size by many big box retailers, such
Brand Retailers: 2%
Gourmet as Best Buy. Many traditional big retailers have indicated they no
Foods: 2%
longer believe the ideal store size is 30,000 to 50,000 square feet.
Source: Colliers Research.
Based on 55 U.S. metropolitan areas.
Their preference going forward will likely be 15,000 to 30,000
square-foot boxes as online sales continue to grow. The recent rise in
2010 gas prices is also spurring growth in online shopping. While prices are
unlikely to stay at levels experienced in April, May and June, a return
to cheap gas is also probably not a reasonable prospect; as a result,
Restaurants
13% retailers increasingly view online sales as one way to combat higher
Supermarket/ Fast Food driving costs.
Food Stores 11%
18%
Lastly, Apple is to a degree redefining the shopping experience, and
Drug Stores
9% best reflects some of the changes underway in retail. Apple Stores,
Discount with sales now averaging $4,400.00 per square foot, have quickly
Retailers
Banks: 5% become the gold standard in retailing, and almost every center that has
21%
an Apple Store is quickly viewed as a premier retail destination. This
Brand Retailers: 4%
Other raising of the bar by Apple should be viewed as a window into the
15% Discount Apparel: 3%
Home Improvement: 3% future of retail, and retail space. Not every retail property should look
Quick Casual like an Apple Store, but the Apple experience is something that retail
Restaurants: 3% property owners should probably try to emulate in varying degrees.
Source: Colliers Research.
Now as ever, retail is constantly changing; the consumer is still much-
Based on 41 U.S. metropolitan areas. challenged and is very selective in where they shop.
S&P RETAIL INDEX (RLX), NOV. 2007 – MAY 2011 RETAIL SALES AND FOOD SERVICES, EXCLUDING MOTOR SALES AND PARTS
550 15
500
10
450
Annual Percentage Change
400
5
350
Index
300 0
250
-5
200
150 -10
N D J F MAM J J A S O N D J F MAM J J A S O N D J F MAM J J A S O N D J F MAM 2005 2006 2007 2008 2009 2010 2011
2007 2008 2009 2010 2011
Source: U.S. Census Bureau
P. 6 | COLLIERS INTERNATIONAL