Call Girls In Vasant Vihar Delhi 💯Call Us 🔝8264348440🔝
Colliers North American Office Highlights 2Q 2013
1. HIGHLIGHTS
NORTH AMERICA
WWW.COLLIERS.COM
Q2 2013 | OFFICE
MARKET INDICATORS
Relative to prior period
NORTH AMERICAN OFFICE MARKET
Summary Statistics, Q2 2013
US
Q2
2013
US
Q3
2013*
Canada
Q2
2013
Canada
Q3
2013*
VACANCY
NET ABSORPTION
CONSTRUCTION
RENTAL RATE**
*Projected | **CBD Class A rents
Construction is the change in Under Construction
US CAN NA
VACANCY RATE (%) 14.35 7.24 13.86
Change From Q1 2013 (%) -0.13 0.32 -0.10
ABSORPTION (MSF) 15.7 (0.3) 15.5
NEW CONSTRUCTION (MSF) 8.7 1.1 9.8
UNDER CONSTRUCTION (MSF) 58.7 17.0 75.7
ASKING RENTS PER SF US CAN
Downtown Class A ($) 41.56 51.70
Change from Q1 2013 (%) 0.82 1.91
Suburban Class A ($) 26.44 32.29
Change from Q1 2013 (%) 0.41 0.33
Recovery Broadens Despite Headwinds
ANDREA B. CROSS Office Research Manager | USA
KEY TAKEAWAYS
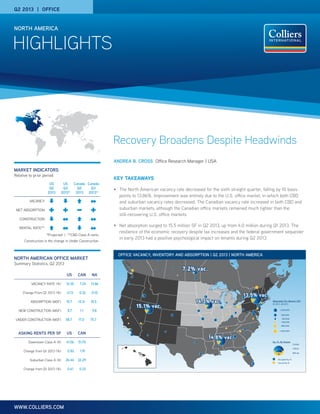
• The North American vacancy rate decreased for the sixth straight quarter, falling by 10 basis
points to 13.86%. Improvement was entirely due to the U.S. office market, in which both CBD
and suburban vacancy rates decreased. The Canadian vacancy rate increased in both CBD and
suburban markets, although the Canadian office markets remained much tighter than the
still-recovering U.S. office markets.
• Net absorption surged to 15.5 million SF in Q2 2013, up from 4.0 million during Q1 2013. The
resilience of the economic recovery despite tax increases and the federal government sequester
in early 2013 had a positive psychological impact on tenants during Q2 2013.
Sq. Ft. By Region
Absorption Per Market (SF)
Q1 2013 -Q2 2013
1,000,000
500,000
100,000
-100,000
-500,000
-1,000,000
2 billion
1 billion
200 mil.
Occupied Sq. Ft.
Vacant Sq. Ft.
OFFICE VACANCY, INVENTORY AND ABSORPTION | Q2 2013 | NORTH AMERICA
2. P. 2 | COLLIERS INTERNATIONAL
HIGHLIGHTS | Q2 2013 | OFFICE | NORTH AMERICA
KEY TAKEAWAYS (continued)
• The primary ICEE (intellectual capital, energy and education) markets remained strong through 1H 2013, posting 6.2 million SF of net absorption
compared with 3.1 million SF of absorption in the primary FIRE (finance, insurance and real estate) markets. However, after slightly negative
absorption in Q1 2013, the FIRE markets recovered significantly in Q2 2013—a key trend to monitor as the economic recovery broadens. FIRE
markets absorbed 3.2 million SF in Q2 2013, compared with 4.1 million SF in ICEE markets.
• Construction activity remains very low by historical standards, and concentrated in markets with the strongest demand. In the U.S., 75 million SF
were under construction as of June 2013, with 27% of this space in the medical office category. This measured supply response will remain a key
supply-side driver of the office market recovery.
• Transaction volume increased by a robust 36% year-over-year in Q2 2013 to $21.0 billion. Investors are moving further out along the risk spectrum,
and the share of cross-border investors is growing amid global economic weakness.
Macroeconomic Trends
The U.S. economic recovery gained steam through 1H 2013, adding more
than 1.2 million jobs. Average monthly job creation accelerated to 202,000,
compared with average net monthly job creation of 183,000 in 2012,
175,000 in 2011 and 85,000 in 2010. The acceleration in the rate of job
growth underscores the resilience of the recovery, occurring despite
sequestration in the U.S. and economic slowdowns in many other
countries. As of June 2013, the economy has recovered about 75% of jobs
lost during the recession. As the effects of the sequester dissipate into
next year, the economic recovery should gain steam, resulting in stronger
GDP and employment growth. Total employment is on track to reach the
recent peak of about 138.1 million jobs by mid-2014.
The recovery in office-using employment has been stronger than the
overall employment recovery. As of mid-2013, the primary office-using
employment sectors had recovered 90% of jobs lost during the recession.
The professional and business services sector has been the main driver of
office-using employment growth, and has accounted for about one-quarter
of total jobs added during June. Fueled by the rapid expansion of the
technology industry and robust hiring of temporary workers, this sector
-10%
-8%
-6%
-4%
-2%
0%
2%
4%
Total Employment Financial activities
Professional and Business Services Office-Using Employment
MONTHS
0 10 20 30 40 50 60 70
NOTE: Latest data as of June 2013. X-axis indicates number of months elapsed since each sector’s previous
cyclical employment peak. Information services employment excluded because sector peaked in 2001
Sources: Bureau of Labor Statistics, Colliers International
CHANGE IN U.S. EMPLOYMENT FROM CYCLICAL PEAK
-270.0
-193.7
-96.0
-57.8
-28.2
-27.5
14.2
18.1
36.1
53.0
202.9
246.3
-300.0 -200.0 -100.0 0.0 100.0 200.0 300.0
Calgary, AB
Montréal, QC
Vancouver, BC
Ottawa, ON
Regina, SK
Victoria, BC
Edmonton, AB
Halifax, NS
Waterloo Region, ON
Saskatoon, SK
Winnipeg, MB
Toronto, ON
SF (Thousands)
CBD OFFICE ABSORPTION BY MARKET | Q2 2013 | CANADA
0.00
0.00
0.00
0.04
0.08
0.13
0.19
0.36
0.94
2.20
2.52
4.48
0.0 0.5 1.0 1.5 2.0 2.5 3.0 3.5 4.0 4.5 5.0
Edmonton, AB
Saskatoon, SK
Victoria, BC
Waterloo Region, ON
Regina, SK
Winnipeg, MB
Halifax, NS
Ottawa, ON
Montréal, QC
Vancouver, BC
Calgary, AB
Toronto, ON
SF (Millions)
CBD OFFICE UNDER CONSTRUCTION BY MARKET | Q2 2013 | CANADA
3. HIGHLIGHTS | Q2 2013 | OFFICE | NORTH AMERICA
COLLIERS INTERNATIONAL | P. 3
METROPOLITAN AREA
JUNE 2013
(%)
JUNE 2012
(%)
CHANGE
(BPS)
1 Riverside-San Bernardino 12.7 10.2 -250
2 Sacramento 10.7 8.5 -220
3 San Diego 9.3 7.3 -200
4 San Francisco-Oakland 8.5 6.5 -200
5 San Jose 8.9 6.9 -200
6 Seattle-Tacoma 7.9 5.9 -200
7 Orlando 8.8 6.9 -190
8 Tampa 9.1 7.2 -190
9 Jacksonville 8.7 7.0 -170
10 Las Vegas 11.8 10.1 -170
LARGEST YEAR-OVER-YEAR DECREASE IN UNEMPLOYMENT RATE | USA
NOTE: Data not seasonally adjusted; rankings are of metro areas with population of 1 mil. or more
Sources: Bureau of Labor Statistics, Colliers International
0
10
20
30
40
50
60
70
80
2000
2001
2002
2003
2004
2005
2006
2007
2008
2009
2010
2011
2012
2013
Source: National Associaton of Home Builders
NAHB/WELLS FARGO HOUSING MARKET INDEX (HMI) | JULY 2013
100
120
140
160
180
200
220
1990
1995
2000
2005
2010
NAR COMPOSITE HOUSING AFFORDABILITY INDEX | MAY 2013
Source: National Association of Realtors
has been one of the fastest-growing since the end of the recession, with
the current employment level about 500,000 positions higher than the
pre-recession peak. Even excluding temporary employment, job growth
has been robust—a positive sign for office space demand. The financial
activities sector has been much slower to recover, having regained only
31% of jobs lost during the recession as of mid-year. Nonetheless, the
trend is positive, with year-over-year job growth of more than 1% for
16 consecutive months through June 2013. We expect this sector to
continue to recover at a slow rate, driven by ongoing improvement in the
housing market. Faster growth in this sector will be prevented by stricter
regulation of financial institutions (such as the recent adoption of the
Basel III capital rules by the Federal Reserve), as well as rising mortgage
rates, which are already dampening refinancing activity.
Canada’s economic recovery is well ahead of the U.S.: According to a
recent analysis by Economic Modeling Specialists Intl. (EMSI), all but one
of Canada’s census metropolitan areas (CMAs) have regained all of the
jobs lost from 2008–2009, and the largest eight CMAs have regained
between 135% and 700% of jobs shed during that period. The Canadian
economy slowed during the first half of the year, averaging a net increase
of 14,000 jobs per month compared with a monthly average of 27,000
during the second half of 2012. However, the improving economic outlook
in the U.S. is boosting confidence among Canadian firms. The Conference
Board of Canada’s Index of Business Confidence, a quarterly survey of
1,500 Canadian firms, increased to 101.5 in the second quarter, its highest
level in more than a year; about 37% of respondents anticipated that
economic conditions will improve during the next six months.
BROADER RECOVERY
As noted in our Q1 2013 report, the U.S. economic recovery is broadening
to include more markets and employment sectors, a trend reflected in this
quarter’s office market data. The housing recovery has been a key element,
as increased sales and construction have boosted payrolls in related
sectors, and in some of the hardest-hit markets during the recession. The
National Association of Home Builders/Wells Fargo Housing Market Index
(HMI) exceeded 50 in June 2013 for the first time in more than seven years,
and jumped to 57 in July, even amid rising mortgage rates. (An HMI reading
above 50 indicates that more builders view operating conditions as good
rather than poor.) Former housing bubble markets such as the Inland
Empire, Sacramento, Las Vegas, San Diego and Tampa were among the
major markets posting the largest year-over-year decreases in
unemployment rate in June 2013. Although this decrease was partially
attributable to workers dropping out of the labor force upon the expiration of
their unemployment benefits, improving labor market conditions also
contributed to this trend.
Despite recent increases in new home sales and construction, the housing
market recovery still has significant room to run; single-family housing
starts totaled a seasonally-adjusted annual rate (SAAR) of 591,000 in
June 2013, only slightly more than half the average SAAR during the last
30 years. Housing completions (both single- and multifamily) totaled a
4. P. 4 | COLLIERS INTERNATIONAL
HIGHLIGHTS | Q2 2013 | OFFICE | NORTH AMERICA
METROPOLITAN AREA
Q2 2013
VACANCY RATE
(%)
Q1 2013
VACANCY RATE
(%)
CHANGE
(BPS)
1 Fairfield, CA 24.20 25.54 -134
2 San Francisco Peninsula 12.91 14.10 -119
3 Albuquerque 20.22 21.17 -96
4 Columbia, SC 19.39 20.35 -95
5 Oakland 15.17 16.07 -90
6 Cincinnati 17.72 18.61 -89
7 Orlando 13.47 14.27 -81
8 Jacksonville 12.78 13.57 -79
9 Grand Rapids 23.38 24.13 -74
10 Orange County 15.19 15.92 -73
LARGEST QUARTERLY VACANCY RATE DECREASE | NORTH AMERICA
Sources: Colliers International
VACANCY
The trend was positive in Q2 2013, with the North American vacancy rate decreasing by 10 basis
points to 13.86% from the previous quarter. The U.S. vacancy rate decreased by 14 basis points
during the period but remained nearly double the Canadian vacancy rate, which increased by 33 basis
points during the quarter to a still-low 7.24%. Among the markets tracked by Colliers, 56 registered
quarterly decreases in vacancy rate, 30 registered increases, and one was unchanged. Of the
markets with increases in vacancy rate, eight were in Canada, all of which still posted sub-9%
vacancy rates as of Q2 2013.
SAAR of just 755,000 in July, well below IHS Global Insight’s projection of 1.4 million new housing
units required annually to accommodate current growth in the number of primary households, demand
from second-home buyers, and demolitions. Even with recent mortgage rate and price increases,
affordability remains elevated relative to historical levels. Thus, the market should be able to withstand
additional increases in financing costs, supporting further direct and indirect job creation and demand
for office space. We will continue to monitor risk factors, such as the increasing use of adjustable-rate
mortgages by buyers on the margin and price spikes in select markets, for signs of overheating, but
currently we maintain a positive outlook on housing and its effect on office market demand.
Behind the Statistics & Beyond the
Basics
Scope of Colliers’ Office Outlook Report: Colliers tracks office space in 87 markets in the U.S. and
Canada totaling nearly 6.4 billion square feet. The 75 U.S. markets account for the lion’s share of this
space, with about 5.9 billion square feet of tracked inventory. Our coverage includes 22 markets with
more than 100 million square feet of space, which combined account for 3.8 billion square feet, or
about 60% of our office market inventory. The largest U.S. markets are New York, Washington, D.C.,
Chicago, Dallas and Atlanta; Toronto is the only Canadian market with more than 100 million square
feet of space.
North American Downtown Markets:
Excluding renewals, of the leases signed
this quarter in your CBD/downtown, did
most tenants...?
Hold Steady
62.0%
Expand
18.3%
Contract
19.7%
North American Downtown Markets:
What was the trend in Free Rent (in months)
offered by CBD landlords this quarter?
Same 80.9%
Less
8.8%
More
10.3%
North American Downtown Markets:
What was the trend for tenant improvement
allowances offered by CBD landlords
this quarter?
Same 79.4%
Less
7.4%
More
13.2%
North American Suburban Markets:
Excluding renewals, of the leases signed
this quarter, did most tenants...?
Hold Steady
64.8%
Expand
28.2%
Contract
7.0%
5. HIGHLIGHTS | Q2 2013 | OFFICE | NORTH AMERICA
COLLIERS INTERNATIONAL | P. 5
MARKET SQUARE FEET
1 Boston 1,656,001
2 Boise 1,384,937
3 Chicago 1,110,774
4 San Jose/Silicon Valley 1,078,743
5 Orange County 1,034,700
6 San Francisco 1,011,487
7 Denver 987,871
8 Minneapolis 911,539
9 Atlanta 870,958
10 Kansas City 842,288
11 San Diego 817,506
12 St. Louis 816,212
HIGHEST ABSORPTION | 1H 2013 | NORTH AMERICA
Source: Colliers International
functions is also critical. Thus, markets such as Raleigh-Durham and
Atlanta, which combine a high concentration of top-tier research
universities and a relatively low cost of doing business, are well positioned
to accommodate additional growth in office demand from manufacturing.
Although the overall trend in absorption is positive, tenant densification
will continue to temper improvement in the office market during the
economic recovery and expansion—and not just in the most expensive
MSAs. In Kansas City for example, the GSA is relocating 800 employees
into a 150,000 square-foot space downtown, about half the size of the
space currently occupied by those employees in South Kansas City. In
addition to federal government downsizing, technological advances are
reducing the need for some support staff and equipment. New technologies
also allow companies to monitor workstation usage during the day, helping
them to become more efficient in their space usage. As employers’ support
of mobile devices such as tablets and smartphones enables more
employees to work remotely, these monitoring systems will assist
companies in maximizing their desk utilization rates, resulting in a net
decrease in required office space relative to historic levels.
ABSORPTION
Absorption accelerated this quarter, bringing the YTD total to 19.4 million
square feet. Among the markets tracked by Colliers, 63 posted positive
absorption in 1H 2013, and just 24 posted negative absorption, including 6
of the 12 Canadian markets. ICEE markets continued to lead, including
Boston, San Jose, Orange County, San Francisco and Denver. However, it
is noteworthy that several markets that have been lagging during the re-
covery were among the top markets for net absorption in 1H 2013, includ-
ing Chicago, Orange County and Atlanta. Another notable trend we’re
seeing is that technology and energy companies—unable to find employees
with the desired skill sets in their typical industry hubs—are relocating to
or expanding into other metropolitan areas. This should result in a broader
recovery in office market conditions going forward.
A less obvious benefit of the onshoring of manufacturing activities is its
positive impact on office demand. Today’s increasingly automated and
efficient supply chain requires a skilled workforce to handle highly complex
engineering, design and other production functions. Firms often prefer to
locate these workers near production facilities in order to facilitate
communication and improve efficiency. Thus, we expect growth in office
demand near returning and expanding manufacturing facilities to
accommodate their white-collar employees. Markets (such as Phoenix,
Houston and Dallas) in low-cost, right-to-work states will likely be the
primary beneficiaries of this trend going forward. Proximity to educational
institutions that provide the skilled workforce to handle these complex
The housing market recovery was apparent in the vacancy rate statistics.
Several markets with the largest decrease in vacancy rate saw particularly
significant housing corrections during the recession and rebounding
housing markets in recent quarters. Orlando, Jacksonville, Orange County,
Miami, Fort Lauderdale, San Diego, the Inland Empire and Sacramento all
posted quarter-over-quarter vacancy rate decreases of at least 35 basis
points. These markets also have posted double-digit year-over-year price
appreciation in recent quarters, spurring construction activity. Further
increases in housing construction should drive growth in office market
demand in these markets.
15.36 15.14 15.03 14.96 14.88 14.83 14.63 14.49 14.35
-
2.0
4.0
6.0
8.0
10.0
12.0
14.0
16.0
-
2.0
4.0
6.0
8.0
10.0
12.0
14.0
16.0
18.0
20.0
Q2
2011 2012 2013
Q3 Q4 Q1 Q2 Q3 Q4 Q1 Q2
Vacancy%
Absorption MSF Completions MSF Vacancy %
U.S. OFFICE MARKET | Q2 2011–Q2 2013
Source: Colliers International
CONSTRUCTION ACTIVITY
According to Dodge Pipeline data, U.S. office construction activity totaled
75 million square feet as of mid-year 2013, with 27% of this space
composed of medical office properties. Construction remains highly
concentrated in markets with the strongest economic growth and tenant
demand in recent years, including Houston, Boston, Dallas-Fort Worth,
San Francisco and San Jose. Texas alone accounts for nearly 20% of
construction under way, followed by California at about 11%, more than
half of which is in San Francisco and San Jose. Unsurprisingly,
construction activity in the primary North American ICEE markets tracked
by Colliers is more than double that of the primary FIRE markets: 28.7
million square feet and 14.5 million square feet, respectively. Looking at
the 87 markets that Colliers covers, supply-side pressure remains low,
with the amount of square footage under construction in Q2 2013
representing just 1.2% of existing inventory. Because of the relatively slow
recovery in the U.S., space under construction represented less than 1%
of existing stock, compared with 3.9% in Canada where the economic
expansion is further along.
6. P. 6 | COLLIERS INTERNATIONAL
HIGHLIGHTS | Q2 2013 | OFFICE | NORTH AMERICA
Much of the space under way is build-to-suit in response to a lack of
suitable space available in the market. Increasingly, new and renovated
office space is being used as a recruiting tool as the competition for skilled
workers in the technology and energy industries intensifies. For example,
energy firms in Houston are seeking out newly constructed, LEED-
certified buildings to attract talent from both within and outside the
metropolitan area. The market for highly skilled energy industry workers
will likely tighten further as horizontal drilling and fracking enable
continued growth in natural resource production. Also, with fewer students
pursuing energy-related degrees in the 1980s and 1990s following the oil
bust, the energy industry faces an even greater challenge than most other
industries in replacing its aging workforce, which will maintain tight labor
market conditions going forward. These factors place even greater
importance on the workspace as a recruitment tool. The technology
industry faces a similar challenge in attracting employees to support
further growth, illustrated by fierce competition for the engineers,
designers and other skilled workers that were recently laid off by Zynga.
The result of this trend will likely be a bifurcation in market conditions. As
tenants in industries with tight labor markets favor newer buildings
constructed to meet the specific demands of their talent, space in
properties less suited to the demands of these workers will languish.
Although still low in most markets, speculative construction is picking up
in markets with the strongest demand. Developers recently announced
planned groundbreakings on the 22 Waugh and Two Hughes Landing
projects in Houston. Also, Hines recently broke ground on 1601 Wewatta,
a speculative Class A building in the LoDo area of Denver. With vacancy
rates still elevated in many office markets, we expect speculative
construction activity to continue to be focused on the strongest submarkets
in select metropolitan areas. We also expect construction to commence on
more projects that were put on hold during the recession as rising rents
and demand for high-quality space support development activity. For
example, Oliver McMillan recently announced that it will build 86,000
square feet of office space for growing apparel company Spanx at the
former site of the Streets of Buckhead project, a large mixed-use
development in Atlanta that stalled during the recession.
Rising construction costs also continue to restrain development activity.
As noted in Colliers’ previous quarterly reports, costs increased throughout
the recession, and this trend has continued during the current recovery.
According to Engineering News-Record’s Construction Cost Index,
construction costs were up 2.5% year-over-year in July 2013 and more
than 20% from July 2007. Wages for both common and skilled labor as
well as materials costs increased on a year-over-year basis, making
upward cost pressures an ongoing concern for investors and developers.
Capital Markets &
Transaction Activity
U.S. office transaction volume surged by 21% quarter-over-quarter and
36% year-over-year to $20.2 billion in Q2 2013, as fears regarding
sequestration and other factors that constrained investment activity in Q1
2013 were alleviated. This total was the highest second-quartertransaction
volume since 2007. The large amount of available capital supported
several high-dollar transactions, including several $1 billion+ deals, mostly
in Manhattan, after just one between the fall of 2008 and year-end 2012,
according to Real Capital Analytics. Also, Texas is attracting a growing
PROPERTY TYPE SQUARE FOOTAGE (THOU.) TOTAL (%)
High Rise 4,764 6.3
Mid Rise 20,634 27.5
Low Rise 29,405 39.2
Medical Office 20,231 27.0
TOTAL 75,034
OFFICE SPACE UNDER CONSTRUCTION BY TYPE | USA
Sources: Dodge Pipeline, Colliers International
U.S. Office
Space Under
Construction
by census division
7.5%
West North Central
5,609 SF (Mil.)
14.6%
Mid Atlantic
10,978 SF (Mil.)
6.2%
New England
4,625 SF (Mil.)
20.7%
South Atlantic
15,532 SF (Mil.)
3.5%
East South Central
2,485 SF (Mil.)
22.0%
West South Central
16,501 SF (Mil.)
5.2%
Mountain
3,870 SF (Mil.)
12.7%
Pacific
9,558 SF (Mil.)
7.8%
East North Central
5,876 SF (Mil.)
7.8%
East North Central
5,876 SF (Mil.)
20
15
10
5
SF (mil.)
SF (mil.)
SF (mil.)
SF (mil.)
OFFICE SPACE UNDER CONSTRUCTION BY U.S. CENSUS DIVISION
Sources: Dodge Pipeline, Colliers International
-100%
-50%
0%
50%
100%
150%
200%
0
20,000
40,000
60,000
80,000
100,000
120,000
140,000
160,000
180,000
2008 2009 2010 2011 2012 2013
U.S. (left axis) Canada (left axis) Year-Over-Year Change (right axis)
OFFICE TRANSACTION VOLUME | Q2 2013 | NORTH AMERICA
Source: Real Capital Analytics
7. HIGHLIGHTS | Q2 2013 | OFFICE | NORTH AMERICA
COLLIERS INTERNATIONAL | P. 7
PEAK-T0-TROUGH LOSS RECOVERED | MAY 2013
INDEX
CBD Office – Major 89.8%
CBD Office – All 77.5%
Total Office 49.6%
Suburban Office – Major 43.9%
CBD Office – Non-Major 38.8%
Suburban Office – All 22.1%
Suburban Office – Non-Major 4.2%
Source: Moody’s/RCA CPPI
6.4% 6.4%
7.1%
7.3%
7.5% 7.5%
7.7%
5.0%
5.5%
6.0%
6.5%
7.0%
7.5%
8.0%
CBD
M
ajorM
etros
TotalOffi
ce
Single
Tenant
Suburban
M
edicalOffi
ceNon-M
ajorM
etros
OFFICE CAP RATES BY LOCATION AND PROPERTY TYPE | Q2 2013
Source: Real Capital Analytics
amount of investor interest due to its robust economic growth, as indicated
by Cousins Properties’ recent acquisition of a 10-building office complex
in Houston and an office tower in Fort Worth for a total of more than
$1 billion. Investors are moving further out on the risk spectrum in terms
of property location and asset type in search of higher yields, a trend that
we expect to continue as the economic recovery broadens to include more
markets and industries. Greater risk tolerance and sustained economic
growth should fuel increased transaction activity during 2H 2013.
The office CMBS delinquency rate continues to trend downward amid
improving market fundamentals and an increase in resolutions. According
to Trepp, the percentage of office CMBS that were 30 or more days
delinquent decreased to 9.97% in June, down almost 50 basis points from
one year earlier. However, we believe that significant risk lies in 10-year
CMBS issued between 2005 and 2007 at peak pricing. Although overall
CMBS delinquency rates have been trending down, delinquency rates on
CMBS from the 2005–2007 vintages remain much higher than for the
preceding years as well as for more recent vintages. According to Wells
Fargo, the overall CMBS 30+ day delinquency rate in May 2013 was
14.59% for the 2007 vintage, compared with 4.16% for the 2004 vintage
and 0.01% for the 2012 vintage. Approximately $400 billion in CMBS is set
to mature between 2015 and 2017, and rising interest rates and limited or
no NOI growth pose a major challenge to borrowers seeking to refinance
loans issued in 2005–2007, most of which were interest-only.
Signs of a likely reduction in the Fed’s bond-buying programs later this
year led to an interest-rate spike in May and June, fostering considerable
fears regarding future commercial real estate values. However, we believe
that the reduction in bond purchases is positive, as it signals that the
economy is healthy enough to grow without artificial stimulus from the
Fed. Even with the recent interest rate spike, the spread between average
office cap rates and the 10-year Treasury is still historically wide, at
400–500 basis points, meaning that there is a cushion to absorb higher
interest rates. Office investment still offers an attractive risk-adjusted
return and continues to draw investors from the multifamily sector as well
as other asset classes. Also, we expect continued economic improvement
and recovery in office market fundamentals to support higher NOI, helping
to offset the increase in interest rates.
8. P. 8 | COLLIERS INTERNATIONAL
HIGHLIGHTS | Q2 2013 | OFFICE | NORTH AMERICA
UNITED STATES | DOWNTOWN OFFICE | ALL INVENTORY
MARKET
EXISTING
INVENTORY (SF)
JUN 30, 2013
NEW SUPPLY
Q2 2013
(SF)
YEAR-TO-DATE
NEW SUPPLY
(SF)
UNDER
CONSTRUCTION
(SF)
VACANCY
RATE (%)
JUN 30, 2013
ABSORPTION
Q2 2013
(SF)
ABSORPTION
YEAR-TO-DATE
(SF)
NORTHEAST
Baltimore, MD 28,438,076 - - - 12.81 93,458 64,357
Boston, MA 60,897,211 - 111,224 3,298,000 12.42 138,299 434,833
Hartford, CT 9,769,060 - - - 20.47 7,164 24,136
New York, NY – Downtown Manhattan 109,940,493 - - 5,035,850 15.93 (646,702) (353,608)
New York, NY – Midtown Manhattan 228,738,768 - - - 12.31 756,367 186,096
New York, NY – Midtown South Manhattan 160,771,982 - - 4,491,000 9.24 (533,244) (1,033,898)
Philadelphia, PA 42,977,061 - - - 11.99 (527,736) (459,838)
Pittsburgh, PA 32,425,158 - - 800,000 10.37 27,253 (43,121)
Stamford, CT 18,642,434 - - - 21.37 (38,872) 38,912
Washington, DC 142,257,834 450,000 492,685 1,894,691 10.00 520,949 (113,029)
White Plains, NY 7,705,456 - - - 17.18 21,958 (103,089)
Northeast Total 842,563,533 450,000 603,909 15,519,541 12.08 (181,106) (1,358,249)
SOUTH
Atlanta, GA 50,230,076 - - 450,000 17.41 85,856 47,896
Birmingham, AL 4,281,964 - - - 18.15 62,081 24,661
Charleston, SC 2,132,469 - - 52,000 7.41 (14,911) (12,434)
Charlotte, NC 22,420,730 - - - 8.37 (31,875) (30,364)
Columbia, SC 4,471,273 - - - 12.39 41,366 81,548
Dallas, TX 34,363,467 - - - 27.17 139,856 (48,951)
Ft. Lauderdale-Broward, FL 8,126,178 - - - 15.05 40,488 115,488
Ft. Worth, TX 10,008,250 - - 132,029 14.16 (33,247) (81,649)
Greenville, SC 3,143,679 - - 235,000 16.02 (51,523) (10,599)
Houston, TX 40,241,247 - - - 14.12 (129,286) (551,739)
Jacksonville, FL 15,994,027 - - - 14.53 (7,026) (17,705)
Little Rock, AR 6,371,039 - - - 11.61 46,976 38,526
Louisville, KY 43,929,128 - - 479,483 11.47 87,121 (25,975)
Memphis, TN 6,075,773 26,000 26,000 - 19.33 (121,924) (144,522)
Miami-Dade, FL 18,509,277 - - - 17.56 59,370 158,757
Nashville, TN 11,615,337 - 20,000 - 13.60 (59,831) 102,946
Orlando, FL 12,801,183 - - - 11.81 36,146 (17,511)
Raleigh/Durham/Chapel Hill, NC 13,622,634 38,122 38,122 579,279 5.83 (3,684) 46,395
Richmond, VA 17,060,794 - - 112,000 11.04 (24,264) (149,963)
Savannah, GA 802,240 - - - 14.29 (7,672) (6,940)
Tampa Bay, FL 8,530,939 - - - 13.62 48,023 (12,002)
West Palm Beach/Palm Beach County, FL 10,066,100 - - - 17.15 (6,852) (32,051)
South Total 344,797,804 64,122 84,122 2,039,791 14.96 155,188 (526,188)
9. HIGHLIGHTS | Q2 2013 | OFFICE | NORTH AMERICA
COLLIERS INTERNATIONAL | P. 9
UNITED STATES | DOWNTOWN OFFICE | ALL INVENTORY
MARKET
EXISTING
INVENTORY (SF)
JUN 30, 2013
NEW SUPPLY
Q2 2013
(SF)
YEAR-TO-DATE
NEW SUPPLY
(SF)
UNDER
CONSTRUCTION
(SF)
VACANCY
RATE (%)
JUN 30, 2013
ABSORPTION
Q2 2013
(SF)
ABSORPTION
YEAR-TO-DATE
(SF)
MIDWEST
Chicago, IL 159,396,601 - - 861,000 12.96 307,408 360,994
Cincinnati, OH 18,117,227 - - - 16.93 178,373 201,717
Cleveland, OH 34,195,860 550,000 550,000 - 19.48 395,217 119
Columbus, OH 19,452,521 - 342,000 280,000 11.28 (184) 154,919
Detroit, MI 25,830,715 - - - 19.41 3,557 86,607
Grand Rapids, MI 5,157,140 - - - 20.28 57,895 69,276
Indianapolis, IN 23,395,488 - - - 9.08 (9,028) (27,224)
Kansas City, MO 34,370,304 - - 215,000 13.94 34,981 118,159
Milwaukee, WI 19,031,024 - - 93,035 12.92 49,923 90,965
Minneapolis, MN 32,104,268 - - - 14.66 (123,315) (156,198)
Omaha, NE 6,358,954 - - - 7.47 44,617 23,162
St. Louis, MO 24,122,626 - - - 17.21 208,056 307,247
St. Paul, MN 12,058,673 - - - 13.33 20,874 75,507
Midwest Total 413,591,401 550,000 892,000 1,449,035 14.25 1,168,374 1,305,250
WEST
Albuquerque, NM 3,241,080 - - - 31.48 (4) (328,725)
Bakersfield, CA 3,225,019 - 60,000 - 8.38 (13,044) 24,755
Boise, ID 3,995,022 - - 260,000 11.37 330,964 252,392
Denver, CO 34,416,272 - - 363,132 11.51 196,175 223,598
Fresno, CA 3,338,268 - - - 11.34 (2,224) 4,199
Honolulu, HI 7,119,083 - - - 13.81 (11,242) (42,723)
Las Vegas, NV 4,203,128 10,000 10,000 473,953 14.10 (108,806) (84,303)
Los Angeles, CA 32,566,100 - - 648,700 19.20 (46,500) 10,700
Oakland, CA 16,891,513 - - - 11.46 196,426 336,416
Phoenix, AZ 20,882,750 - - - 22.70 (60,371) (246,854)
Portland, OR 33,368,679 - - 55,527 9.21 153,884 253,217
Reno, NV 3,224,337 - - - 15.50 14,737 (7,611)
Sacramento, CA 18,928,930 - - - 11.39 55,597 (219,861)
San Diego, CA 10,172,525 - - - 18.08 89,125 175,082
San Francisco, CA 88,097,076 400,000 400,000 3,384,820 9.61 557,685 1,011,487
San Jose/Silicon Valley 7,601,845 - - - 22.81 65,048 66,266
Seattle/Puget Sound, WA 55,903,513 272,912 399,912 308,899 12.18 (96,538) (33,479)
Stockton, CA 8,221,819 - - - 17.68 22,921 38,812
Walnut Creek, CA 12,420,396 - - - 15.90 (4,688) (757)
West Total 367,817,355 682,912 869,912 5,495,031 13.21 1,339,145 1,432,611
U.S. TOTAL / AVERAGE 1,968,770,093 1,747,034 2,449,943 24,503,398 13.25 2,481,601 853,424
(continued)
10. P. 10 | COLLIERS INTERNATIONAL
HIGHLIGHTS | Q2 2013 | OFFICE | NORTH AMERICA
UNITED STATES | DOWNTOWN OFFICE | CLASS A
MARKET
EXISTING
INVENTORY (SF)
JUN 30, 2013
AVG. ANNUAL
QUOTED RENT
(USD PSF)
JUN 30, 2013
QUARTERLY
CHANGE
IN RENT
(%)
ANNUAL
CHANGE
IN RENT
(%)
VACANCY
RATE (%)
MAR 31, 2013
VACANCY
RATE (%)
JUN 30, 2013
ABSORPTION
Q2 2013
(SF)
ABSORPTION
YEAR-TO-DATE
(SF)
NORTHEAST
Baltimore, MD 12,878,563 23.43 -2.7 0.9 14.64 14.27 47,941 (12,948)
Boston, MA 41,412,537 48.46 3.6 6.2 13.49 13.38 43,837 (138,592)
Hartford, CT 6,660,379 22.74 -0.2 -0.7 20.99 24.54 (236,401) (204,607)
New York, NY – Downtown Manhattan 77,949,152 47.25 0.4 -0.8 17.10 18.05 742,024) (328,623)
New York, NY – Midtown Manhattan 195,449,838 67.39 1.4 -4.2 13.45 13.08 729,655 (23,935)
New York, NY – Midtown South Manhattan 33,221,396 60.92 2.4 28.9 9.39 9.27 38,743 19,901
Philadelphia, PA 32,888,160 26.06 -1.5 -1.7 10.23 12.08 (609,219) (536,402)
Pittsburgh, PA 18,284,772 24.67 2.2 9.1 6.75 6.59 31,711 101,669
Stamford, CT 13,300,792 38.66 1.0 -0.5 22.68 22.87 (25,588) 46,109
Washington, DC 87,230,016 52.81 -0.9 -0.9 11.24 11.07 547,509 70,247
White Plains, NY 4,887,012 31.58 -0.1 -1.5 21.33 20.77 26,988 (131,279)
Northeast Total 524,162,617 53.18 0.8 3.2 13.37 13.47 (146,848) (1,138,460)
SOUTH
Atlanta, GA 30,081,897 23.17 1.7 0.8 19.55 19.42 40,345 17,942
Birmingham, AL 3,322,353 21.06 0.0 0.7 12.47 10.85 53,855 16,435
Charleston, SC 957,994 32.64 2.0 8.5 3.30 5.03 (16,566) 3,397
Charlotte, NC 15,891,412 24.90 0.0 4.0 9.71 9.48 36,800 12,462
Columbia, SC 1,926,914 20.52 1.2 5.8 8.00 8.99 (19,150) 21,915
Dallas, TX 22,636,841 22.20 0.2 1.6 26.38 26.01 83,981 (86,611)
Ft. Lauderdale-Broward, FL 4,477,321 31.21 -1.2 0.4 20.40 19.81 26,225 64,527
Ft. Worth, TX 5,698,546 28.15 0.5 1.4 12.14 12.70 (32,019) (59,006)
Greenville, SC 1,871,715 19.32 -2.2 2.8 15.60 16.36 (14,104) (19,328)
Houston, TX 28,517,756 36.86 -0.5 -0.2 11.19 11.73 (154,532) (528,122)
Jacksonville, FL 6,830,482 19.92 1.8 2.5 15.12 15.12 162 (10,309)
Little Rock, AR 2,636,353 14.78 -4.1 -5.2 12.20 11.48 18,958 12,028
Louisville, KY 10,052,414 19.85 0.5 4.1 13.62 13.11 51,531 96,747
Memphis, TN 2,009,825 17.38 0.5 4.0 20.35 27.84 (129,870) (143,557)
Miami-Dade, FL 9,758,448 39.48 -1.5 -1.9 20.57 20.18 38,266 115,130
Nashville, TN 4,060,225 21.71 0.6 -0.3 16.96 14.53 98,798 241,152
Orlando, FL 5,828,365 24.38 0.5 -2.6 14.77 14.20 33,577 31,721
Raleigh/Durham/Chapel Hill, NC 5,771,598 22.88 -0.5 -2.4 7.03 6.90 42,570 95,914
Richmond, VA 5,905,865 23.23 -2.0 0.1 8.33 8.54 (12,397) (69,975)
Savannah, GA 642,460 20.59 0.0 7.5 9.43 11.42 (12,802) (24,214)
Tampa Bay, FL 4,782,093 23.13 -0.1 -0.1 16.58 15.23 64,423 673
West Palm Beach/Palm Beach County, FL 3,329,557 37.67 5.3 1.1 21.31 20.48 27,601 6,670
South Total 176,990,434 26.37 0.1 0.7 15.95 15.86 225,652 (204,409)
11. HIGHLIGHTS | Q2 2013 | OFFICE | NORTH AMERICA
COLLIERS INTERNATIONAL | P. 11
UNITED STATES | DOWNTOWN OFFICE | CLASS A
MARKET
EXISTING
INVENTORY (SF)
JUN 30, 2013
AVG. ANNUAL
QUOTED RENT
(USD PSF)
JUN 30, 2013
QUARTERLY
CHANGE
IN RENT
(%)
ANNUAL
CHANGE
IN RENT
(%)
VACANCY
RATE (%)
MAR 31, 2013
VACANCY
RATE (%)
JUN 30, 2013
ABSORPTION
Q2 2013
(SF)
ABSORPTION
YEAR-TO-DATE
(SF)
MIDWEST
Chicago, IL 61,083,777 37.12 0.1 -0.6 13.71 13.35 222,420 564,419
Cincinnati, OH 8,824,601 21.69 -0.3 -6.6 21.98 21.26 63,807 68,555
Cleveland, OH 10,454,147 22.07 1.1 2.7 16.21 16.94 384,484 88,325
Columbus, OH 8,377,149 19.20 -0.4 -3.5 11.57 11.88 (26,049) 178,155
Detroit, MI 8,195,021 22.90 0.1 -3.1 18.44 17.96 39,660 86,654
Grand Rapids, MI 1,445,108 19.37 0.1 0.2 23.87 23.61 3,802 3,802
Indianapolis, IN 9,603,552 18.85 -0.4 -1.0 11.70 11.83 (12,490) (6,091)
Kansas City, MO 10,163,363 18.88 -0.2 -0.8 19.59 19.62 (3,167) 45,814
Milwaukee, WI 5,347,141 19.99 -0.2 1.7 11.56 11.05 27,351 36,916
Minneapolis, MN 13,618,828 16.90 0.4 10.8 11.43 12.68 (170,844) (121,014)
Omaha, NE 3,417,878 20.13 5.0 1.3 4.41 4.41 - (12,064)
St. Louis, MO 10,388,420 17.96 -0.9 2.8 13.71 13.26 46,435 93,364
St. Paul, MN 2,773,960 13.38 0.2 1.6 9.79 10.17 (10,283) 743
Midwest Total 153,692,945 26.47 0.0 0.0 14.29 14.23 565,126 1,027,578
WEST
Albuquerque, NM 575,047 19.76 0.0 -1.5 26.55 26.55 - (20,753)
Bakersfield, CA 729,798 17.40 0.0 0.0 4.10 4.10 - 57,068
Boise, ID 2,177,754 19.03 -2.1 -8.1 4.10 14.12 (266,676) (241,936)
Denver, CO 21,274,480 30.70 -0.3 4.1 13.27 12.40 185,709 126,630
Fresno, CA 1,058,046 24.00 0.0 0.0 12.13 11.19 9,951 12,501
Honolulu, HI 4,966,720 34.85 -0.3 -0.9 12.49 12.47 686 (12,015)
Las Vegas, NV 807,588 31.20 0.8 1.2 6.89 15.35 (68,273) (50,489)
Los Angeles, CA 18,098,100 36.60 1.0 0.7 18.20 18.33 (24,600) (21,200)
Oakland, CA 10,198,245 31.80 3.5 0.0 10.24 8.56 171,341 270,853
Phoenix, AZ 9,468,011 22.47 -1.2 -5.2 21.67 22.04 (34,936) (50,518)
Portland, OR 13,249,724 24.61 -1.8 -0.3 8.44 7.98 61,123 104,912
Reno, NV 583,955 24.05 0.8 5.4 16.10 13.61 14,554 722
Sacramento, CA 9,062,614 31.80 -1.1 -2.6 11.30 11.29 771 (258,546)
San Diego, CA 7,257,266 28.08 -0.8 -2.1 16.80 15.99 58,194 99,629
San Francisco, CA 56,345,281 50.29 5.3 12.2 9.73 9.15 156,032 507,542
San Jose/Silicon Valley 3,365,127 31.80 0.0 -4.0 28.05 26.04 51,776 17,182
Seattle/Puget Sound, WA 20,699,527 31.68 -1.2 3.4 14.56 15.16 (120,723) (46,961)
Stockton, CA 2,790,574 21.60 9.1 4.7 25.06 25.96 (24,991) 13,740
Walnut Creek, CA 8,255,502 27.60 0.9 5.0 14.91 15.00 (7,939) 32,505
West Total 190,963,359 35.91 2.0 5.4 13.14 12.95 161,999 540,866
U.S. TOTAL / AVERAGE 1,045,809,355 41.56 0.8 0.8 13.90 13.89 805,929 225,575
(continued)
12. P. 12 | COLLIERS INTERNATIONAL
HIGHLIGHTS | Q2 2013 | OFFICE | NORTH AMERICA
UNITED STATES | SUBURBAN OFFICE | ALL INVENTORY
MARKET
EXISTING
INVENTORY (SF)
JUN 30, 2013
NEW SUPPLY
Q2 2013
(SF)
YEAR-TO-DATE
NEW SUPPLY
(SF)
UNDER
CONSTRUCTION
(SF)
VACANCY
RATE (%)
MAR 31,
2013
VACANCY
RATE (%)
JUN 30,
2013
ABSORPTION
Q2 2013
(SF)
ABSORPTION
YEAR-TO-DATE
(SF)
NORTHEAST
Baltimore, MD 87,566,421 367,764 573,964 - 12.80 12.66 450,100 357,512
Boston, MA 111,593,294 347,926 347,926 1,387,323 18.70 18.29 735,271 1,221,168
Fairfield County, CT 41,219,333 - - - 13.16 13.33 (67,268) (78,128)
Hartford, CT 12,251,551 - - - 14.02 13.43 72,978 124,377
Long Island, NY 73,301,695 - - 104,000 10.80 10.59 154,783 200,253
New Jersey – Central* 103,932,091 - - 88,724 16.75 16.75 673,930 673,930
New Jersey – Northern* 137,463,824 - - 737,600 15.81 15.54 362,711 362,711
Philadelphia, PA 110,361,669 50,000 50,000 802,755 14.92 14.60 392,810 364,009
Pittsburgh, PA 90,770,505 358,000 493,518 576,855 7.28 7.25 347,253 316,689
Washington, DC 284,135,019 411,767 637,410 6,997,084 16.14 16.21 142,265 (283,211)
Westchester County, NY 36,869,560 - - - 15.50 15.02 178,656 136,250
Northeast Total 1,089,464,962 1,535,457 2,102,818 10,694,341 14.77 14.64 3,443,489 3,395,560
SOUTH
Atlanta, GA 171,340,789 344,476 344,476 954,650 17.12 16.89 684,734 823,062
Birmingham, AL 14,628,662 - - - 17.40 17.55 (39,734) 25,857
Charleston, SC 9,363,809 - 75,000 100,000 13.29 12.98 29,345 44,081
Charlotte, NC 61,732,087 55,003 102,539 221,754 14.67 14.18 344,722 513,339
Columbia, SC 4,954,406 - - - 26.69 25.71 48,445 890
Dallas, TX 239,866,810 244,205 721,325 1,712,061 15.47 15.56 571 793,368
Ft. Lauderdale-Broward, FL 43,472,016 - - 280,000 15.03 14.64 168,820 (16,995)
Ft. Worth, TX 20,280,813 44,065 87,703 259,453 7.74 7.67 54,370 23,622
Greenville, SC 5,093,953 - - - 16.13 18.80 (135,883) (35,663)
Houston, TX 134,491,562 576,602 676,602 9,374,982 15.15 15.20 415,105 248,856
Jacksonville, FL 44,973,689 51,211 57,601 14,902 13.25 12.16 532,107 542,492
Little Rock, AR 7,577,346 - - - 12.11 13.46 (90,155) (69,911)
Memphis, TN 27,567,694 113,392 113,392 40,000 14.59 14.47 128,498 98,506
Miami-Dade, FL 63,172,528 35,298 128,185 242,887 13.60 13.04 382,915 449,144
Nashville, TN 14,841,014 - - 731,000 6.71 6.72 (63,019) (10,364)
Orlando, FL 53,981,842 - - 416,567 14.79 13.86 502,767 503,192
Raleigh/Durham/Chapel Hill, NC 64,112,623 20,671 20,671 133,593 13.24 13.00 167,946 525,049
Richmond, VA 34,573,839 - - - 10.44 10.54 (34,916) 284,682
Savannah, GA 1,467,758 - - - 19.59 19.16 6,253 9,233
Tampa Bay, FL 71,236,172 21,145 271,145 95,474 15.13 15.61 (263,194) 370,106
W. Palm Beach/Palm Beach, FL 28,662,154 - 30,000 119,250 18.05 17.78 78,001 115,088
South Total 1,117,391,566 1,506,068 2,628,639 14,696,573 14.92 14.77 2,917,698 5,237,634
*New Jersey markets reported Q1 data this quarter.
13. HIGHLIGHTS | Q2 2013 | OFFICE | NORTH AMERICA
COLLIERS INTERNATIONAL | P. 13
UNITED STATES | SUBURBAN OFFICE | ALL INVENTORY
MARKET
EXISTING
INVENTORY (SF)
JUN 30, 2013
NEW SUPPLY
Q2 2013
(SF)
YEAR-TO-DATE
NEW SUPPLY
(SF)
UNDER
CONSTRUCTION
(SF)
VACANCY
RATE (%)
MAR 31,
2013
VACANCY
RATE (%)
JUN 30,
2013
ABSORPTION
Q2 2013
(SF)
ABSORPTION
YEAR-TO-DATE
(SF)
MIDWEST
Chicago, IL 157,838,190 207,819 327,819 79,847 16.54 16.48 263,098 749,780
Cincinnati, OH 35,557,700 - 147,378 - 18.96 18.13 297,384 528,188
Cleveland, OH 88,023,988 154,974 819,457 27,280 10.30 11.48 (900,048) (162,940)
Columbus, OH 43,764,261 - 103,000 362,500 11.87 11.35 229,264 236,862
Detroit, MI 139,700,460 - - 83,882 18.73 18.49 249,230 (207,749)
Grand Rapids, MI 10,944,100 - - 145,000 25.41 24.85 61,755 101,015
Indianapolis, IN 44,280,262 - - - 9.75 9.80 (22,709) 8,862
Kansas City, MO 57,980,107 530,000 540,820 884,496 13.01 12.53 738,699 724,129
Milwaukee, WI 33,429,900 100,427 100,427 - 12.49 12.29 153,784 146,573
Minneapolis, MN 79,538,983 - - 608,700 14.57 13.55 817,437 1,067,737
Omaha, NE 21,111,750 512,972 512,972 377,500 12.42 12.43 416,983 342,368
St. Louis, MO 55,605,662 - - 735,000 10.18 9.58 332,544 508,965
Midwest Total 767,775,363 1,506,192 2,551,873 3,304,205 14.59 14.40 2,637,421 4,043,790
WEST
Albuquerque, NM 10,877,999 - - - 18.10 16.86 134,884 79,602
Bakersfield, CA 6,011,449 30,000 30,000 51,594 6.89 7.52 (21,754) (16,515)
Boise, ID 12,797,231 - - - 18.88 20.92 663,262 1,132,545
Denver, CO 103,335,682 397,979 482,065 344,252 13.75 13.86 217,765 764,273
Fairfield, CA 4,878,427 - - - 25.54 24.20 65,145 44,580
Fresno, CA 18,081,047 98,815 98,815 158,000 13.04 13.39 (43,728) (11,011)
Honolulu, HI 7,490,275 - - - 12.25 12.30 (7,200) 50,147
Las Vegas, NV 35,318,604 - 42,123 279,478 24.41 24.25 28,671 109,266
Los Angeles, CA 167,663,500 532,100 532,100 1,143,200 17.81 18.08 (18,700) 83,700
Los Angeles – Inland Empire, CA 20,493,200 22.04 21.67 76,900 83,700
Oakland, CA 16,165,151 - - - 19.68 19.05 100,589 (173,284)
Orange County, CA 81,047,500 - - 790,000 15.92 15.19 541,900 1,034,700
Phoenix, AZ 110,202,571 - 30,000 68,867 20.31 20.14 187,546 472,127
Pleasanton/Tri-Valley, CA 27,421,359 - - - 10.92 10.63 78,180 102,190
Portland, OR 42,684,995 10,916 10,916 36,300 10.43 10.34 48,165 143,296
Reno, NV 9,748,827 - - - 15.53 15.22 30,283 26,295
Sacramento, CA 75,158,085 - 148,625 209,527 16.91 16.55 270,624 806,454
San Diego, CA 71,124,181 248,882 248,882 778,558 13.11 12.78 450,811 642,424
San Francisco Peninsula 35,146,938 4,739 4,739 - 14.10 12.91 421,429 397,547
San Jose/Silicon Valley 55,865,346 1,048,564 1,366,564 1,689,796 12.33 12.53 759,464 1,012,477
Seattle/Puget Sound, WA 56,694,296 42,414 42,414 - 11.19 10.62 252,333 111,261
Walnut Creek, CA 5,562,703 - - - 15.03 14.57 25,624 42,514
West Total 973,769,366 2,414,409 3,037,243 5,549,572 15.92 15.75 4,262,193 6,068,388
U.S. TOTAL / AVERAGE 3,948,401,257 6,962,126 10,320,573 34,244,691 15.06 14.90 13,260,801 18,745,372
(continued)
14. P. 14 | COLLIERS INTERNATIONAL
HIGHLIGHTS | Q2 2013 | OFFICE | NORTH AMERICA
UNITED STATES | SUBURBAN OFFICE | CLASS A
MARKET
EXISTING
INVENTORY
(SF) JUN 30,
2013
AVG. ANNUAL
QUOTED RENT
(USD PSF)
JUN 30, 2013
QUARTERLY
CHANGE
IN RENT
(%)
ANNUAL
CHANGE
IN RENT
(%)
VACANCY
RATE (%)
MAR 31, 2013
VACANCY
RATE (%)
JUN 30, 2013
ABSORPTION
Q2 2013
(SF)
ABSORPTION
YEAR-TO-DATE
(SF)
NORTHEAST
Baltimore, MD 30,851,141 25.06 0.3 -1.6 15.61 14.90 447,189 448,426
Boston, MA 47,464,674 25.03 -0.9 -0.6 17.56 16.82 638,058 803,290
Fairfield County, CT 17,379,924 36.57 -1.3 -3.2 13.16 13.13 6,408 40,348
Hartford, CT 7,906,889 20.91 2.4 1.2 12.55 12.42 9,892 25,668
Long Island, NY 23,317,018 30.44 -0.3 1.3 12.75 11.25 348,147 316,996
New Jersey – Central* 60,412,197 26.31 0.0 15.5 17.19 17.19 807,970 807,970
New Jersey – Northern* 84,496,914 26.36 0.3 -0.5 15.11 15.08 138,287 138,287
Philadelphia, PA 68,018,576 25.27 2.0 3.2 14.20 13.56 479,801 496,354
Pittsburgh, PA 16,511,151 22.41 0.3 3.6 6.07 5.79 309,173 216,514
Washington, DC 134,720,703 31.91 -0.5 -1.8 15.69 15.81 191,862 239,435
Westchester County, NY 16,971,309 27.02 1.6 0.3 19.18 17.58 271,232 146,991
Northeast Total 508,050,496 27.82 0.1 1.2 15.28 14.97 3,648,019 3,680,279
SOUTH
Atlanta, GA 79,940,734 22.11 -0.3 0.2 16.18 15.68 688,617 912,544
Birmingham, AL 9,246,750 20.73 -0.5 -2.0 15.55 16.19 (65,266) (45,377)
Charleston, SC 3,500,470 24.37 -0.4 5.5 8.81 7.84 33,993 13,886
Charlotte, NC 19,884,200 22.91 0.5 1.8 16.12 15.13 195,094 336,565
Columbia, SC 973,189 16.72 1.6 -1.1 19.38 14.73 45,286 1,971
Dallas, TX 91,458,998 23.50 0.6 1.3 14.54 15.20 (467,794) 403,729
Ft. Lauderdale-Broward, FL 10,973,930 27.34 0.0 -1.8 18.69 17.96 79,282 64,343
Ft. Worth, TX 2,649,272 24.20 0.8 0.8 2.83 2.71 3,199 25,413
Greenville, SC 2,245,798 17.61 -1.1 0.1 13.50 10.04 77,642 58,652
Houston, TX 55,239,500 28.82 0.0 1.7 11.90 11.83 517,471 1,020,517
Jacksonville, FL 9,206,865 19.40 -1.9 -0.5 8.40 7.71 63,551 55,474
Little Rock, AR 3,027,212 19.12 -0.6 -1.5 18.26 17.34 31,370 44,873
Memphis, TN 8,115,712 21.23 1.2 -1.7 8.50 8.53 (2,502) (20,930)
Miami-Dade, FL 16,344,890 31.49 -0.6 3.1 18.35 17.78 93,080 111,031
Nashville, TN 7,288,561 23.97 0.3 5.2 5.53 6.29 (55,610) (43,412)
Orlando, FL 16,814,825 21.07 1.1 -2.3 19.22 17.95 213,715 328,229
Raleigh/Durham/Chapel Hill, NC 24,633,625 20.35 -0.1 -2.5 12.30 11.71 145,511 454,423
Richmond, VA 13,795,044 18.40 2.0 -0.2 10.96 10.85 14,555 342,371
Savannah, GA 490,035 23.24 2.8 2.6 19.37 19.49 (573) (8,314)
Tampa Bay, FL 24,325,155 23.06 0.2 0.7 13.86 14.72 (80,268) 487,063
W. Palm Beach/Palm Beach, FL 9,326,273 30.21 2.3 0.5 16.82 17.05 (21,511) 13,918
South Total 409,481,038 23.74 0.2 0.7 14.31 14.20 1,508,842 4,556,969
*New Jersey markets reported Q1 data this quarter.
15. HIGHLIGHTS | Q2 2013 | OFFICE | NORTH AMERICA
COLLIERS INTERNATIONAL | P. 15
UNITED STATES | SUBURBAN OFFICE | CLASS A
MARKET
EXISTING
INVENTORY
(SF) JUN 30,
2013
AVG. ANNUAL
QUOTED RENT
(USD PSF)
JUN 30, 2013
QUARTERLY
CHANGE
IN RENT
(%)
ANNUAL
CHANGE
IN RENT
(%)
VACANCY
RATE (%)
MAR 31, 2013
VACANCY
RATE (%)
JUN 30, 2013
ABSORPTION
Q2 2013
(SF)
ABSORPTION
YEAR-TO-DATE
(SF)
MIDWEST
Chicago, IL 77,711,164 27.18 -0.3 0.1 17.02 17.17 19,722 494,595
Cincinnati, OH 16,233,224 20.64 1.5 1.1 18.58 17.67 147,771 306,215
Cleveland, OH 14,354,514 21.23 0.7 -0.7 9.57 9.89 (46,071) 550,512
Columbus, OH 18,074,079 19.19 0.1 3.5 12.05 10.71 242,279 91,189
Detroit, MI 34,050,663 20.38 0.8 -1.9 16.34 16.26 29,913 (125,820)
Grand Rapids, MI 554,841 17.50 0.0 -9.4 42.12 42.12 - 2,226
Indianapolis, IN 12,451,342 18.25 0.0 -0.1 11.69 12.32 (12,819) 128,301
Kansas City, MO 15,325,428 20.55 0.7 -0.3 11.55 10.46 634,990 519,877
Milwaukee, WI 6,103,854 20.44 -0.6 0.4 13.98 13.90 4,954 (82,366)
Minneapolis, MN 26,015,101 13.83 0.2 4.3 15.41 15.22 49,276 229,111
Omaha, NE 4,861,660 25.95 -5.9 0.5 4.34 3.00 504,091 498,985
St. Louis, MO 26,156,707 22.01 -0.9 0.3 10.01 9.30 183,663 235,449
Midwest Total 251,892,577 21.96 0.0 0.4 14.52 14.24 1,757,769 2,848,274
WEST
Albuquerque, NM 811,008 20.85 - 1.1 13.74 13.74 - 20,771
Bakersfield, CA 2,748,627 24.00 0.0 0.0 4.93 5.48 33,047 42,376
Boise, ID 5,208,798 15.10 5.6 -12.0 16.99 18.43 168,993 609,791
Denver, CO 33,283,870 24.33 1.1 4.4 11.81 12.09 (95,784) (33,899)
Fairfield, CA 1,918,096 25.83 0.1 1.1 32.25 30.20 39,425 51,949
Fresno, CA 4,029,660 25.20 0.0 0.0 18.67 17.66 40,648 45,507
Las Vegas, NV 4,979,076 29.28 -0.8 0.4 33.60 32.20 70,108 40,828
Los Angeles, CA 102,474,400 34.32 0.7 5.5 16.83 17.02 190,200 27,600
Los Angeles – Inland Empire, CA 4,934,300 24.36 1.0 5.2 23.12 23.06 3,200 (142,100)
Oakland, CA 3,870,228 29.52 7.9 6.5 27.31 26.27 40,491 (78,953)
Orange County, CA 32,650,900 25.56 -0.5 -0.5 17.45 16.10 387,800 398,600
Phoenix, AZ 30,425,480 23.45 0.6 3.5 19.68 18.98 211,842 259,552
Pleasanton/Tri-Valley, CA 15,234,184 26.04 -0.9 - 8.44 8.46 (2,798) 49,579
Portland, OR 10,880,217 22.59 -1.1 -1.1 11.63 11.50 13,471 189,227
Reno, NV 912,364 19.21 0.7 4.9 19.49 21.11 (14,789) (33,518)
Sacramento, CA 17,141,271 21.96 -0.5 -2.1 18.85 17.83 174,233 802,332
San Diego, CA 23,786,330 33.72 0.0 4.1 11.25 10.61 372,786 245,935
San Francisco Peninsula 22,436,779 43.20 2.0 3.4 13.29 12.89 224,424 403,711
San Jose/Silicon Valley 28,454,222 40.80 4.3 2.4 14.66 15.71 600,275 802,065
Seattle/Puget Sound, WA 20,754,950 33.12 -0.6 3.8 9.93 9.21 147,198 173,766
Walnut Creek, CA 737,964 33.36 18.2 24.7 13.75 16.13 (17,614) (22,967)
West Total 367,672,724 30.59 1.2 7.1 15.56 15.36 2,587,156 3,852,152
U.S. TOTAL / AVERAGE 1,537,096,835 26.44 0.4 2.5 14.96 14.74 9,501,786 14,937,674
(continued)
16. P. 16 | COLLIERS INTERNATIONAL
HIGHLIGHTS | Q2 2013 | OFFICE | NORTH AMERICA
CANADA | DOWNTOWN OFFICE | ALL INVENTORY
MARKET
EXISTING
INVENTORY (SF)
JUN 30, 2013
NEW SUPPLY
Q2 2013
(SF)
YEAR-TO-DATE
NEW SUPPLY
(SF)
UNDER
CONSTRUCTION
(SF)
VACANCY
RATE (%)
JUN 30, 2013
ABSORPTION
Q2 2013
(SF)
ABSORPTION
YEAR-TO-DATE
(SF)
Calgary, AB 39,779,846 - - 2,520,000 5.03 (269,967) (525,725)
Edmonton, AB 11,260,840 - - - 8.02 14,191 31,107
Halifax, NS 4,679,727 2,607 2,607 190,000 11.29 18,140 10,663
Montréal, QC 49,331,103 - - 943,543 4.67 (193,746) (291,539)
Ottawa, ON 15,636,942 - - 360,000 7.28 (57,796) 4,247
Regina, SK 3,519,664 - - 80,000 5.84 (28,162) (106,971)
Saskatoon, SK 2,369,148 50,000 50,000 - 5.34 52,979 512
Toronto, ON 69,551,319 - - 4,484,698 4.02 246,297 444,761
Vancouver, BC 24,408,488 - - 2,199,812 4.41 (96,005) (129,266)
Victoria, BC 4,901,126 - - - 8.52 (27,541) (27,541)
Waterloo Region, ON 3,899,737 25,200 48,200 44,075 12.83 36,147 71,584
Winnipeg, MB 11,352,054 216,655 216,655 130,375 7.75 202,927 202,927
CANADA TOTAL 240,689,994 294,462 317,462 10,952,503 5.35 (102,536) (315,241)
CANADA | DOWNTOWN OFFICE | CLASS A
MARKET
EXISTING
INVENTORY (SF)
JUN 30, 2013
AVG. ANNUAL
QUOTED RENT
(CAD PSF)
JUN 30, 2013
QUARTERLY
CHANGE IN
RENT
(%)
ANNUAL
CHANGE
IN RENT
(%)
VACANCY
RATE (%)
MAR 31, 2013
VACANCY
RATE (%)
JUN 30, 2013
ABSORPTION
Q2 2013
(SF)
ABSORPTION
YEAR-TO-DATE
(SF)
Calgary, AB 26,727,389 61.46 3.2 -0.9 2.78 3.04 (71,719) (320,803)
Edmonton, AB 9,074,913 41.63 0.0 0.5 8.26 8.27 (255) 16,839
Halifax, NS 1,934,103 32.58 0.2 0.7 8.68 7.96 14,179 19,397
Montréal, QC 23,302,596 45.00 0.0 7.1 4.45 4.99 (124,640) 17,374
Ottawa, ON 9,645,830 50.00 -2.0 1.4 4.73 5.03 (28,365) 79,033
Regina, SK 1,392,816 44.00 4.8 8.9 2.17 2.53 (5,030) (11,096)
Saskatoon, SK 570,571 43.00 7.5 13.2 4.65 4.65 - (6,066)
Toronto, ON 40,130,328 54.31 3.6 1.6 4.48 4.54 (11,485) 50,695
Vancouver, BC 10,029,234 56.35 0.2 0.4 2.07 3.03 (96,005) (110,759)
Victoria, BC 513,808 35.00 0.0 -2.8 4.88 6.97 (10,739) (10,739)
Waterloo Region, ON 1,559,429 25.97 0.0 2.7 10.64 10.64 - 21,386
Winnipeg, MB 2,619,428 33.75 0.7 2.3 3.71 4.03 (8,359) (8,359)
CANADA TOTAL 127,500,445 51.70 1.9 2.0 4.32 4.59 (342,418) (263,098)
17. HIGHLIGHTS | Q2 2013 | OFFICE | NORTH AMERICA
COLLIERS INTERNATIONAL | P. 17
CANADA | SUBURBAN OFFICE | ALL INVENTORY
MARKET
EXISTING
INVENTORY (SF)
JUN 30, 2013
NEW SUPPLY
Q2 2013
(SF)
YEAR-TO-DATE
NEW SUPPLY
(SF)
UNDER
CONSTRUCTION
(SF)
VACANCY
RATE (%)
MAR 31, 2013
VACANCY
RATE (%)
JUN 30, 2013
ABSORPTION
Q2 2013
ABSORPTION
YEAR-TO-DATE
(SF)
Calgary, AB 25,164,191 141,834 396,884 1,039,562 9.96 9.37 274,466 929,335
Edmonton, AB 9,291,098 80,000 185,150 225,000 12.32 12.22 65,881 52,722
Halifax, NS 6,547,115 438 438 73,500 11.13 11.25 (7,943) (16,194)
Montréal, QC 24,694,665 91,821 91,821 942,519 8.60 10.76 (450,488) (471,646)
Ottawa, ON 21,106,795 - - 395,450 9.83 9.73 83,496 54,280
Regina, SK 675,313 - - 40,000 4.74 3.92 5,522 5,522
Toronto, ON 68,555,862 288,632 369,582 634,268 7.52 7.86 27,018 57,592
Vancouver, BC 29,130,276 73,791 308,452 2,321,686 9.37 10.53 (197,705) (142,707)
Victoria, BC 3,728,644 47,501 47,501 99,642 9.39 11.30 (26,413) (26,413)
Waterloo Region, ON 7,241,479 16,641 84,001 199,850 10.80 10.75 22,608 60,876
Winnipeg, MB 4,052,004 75,257 75,257 70,000 9.16 10.10 30,285 30,285
CANADA TOTAL 200,187,442 815,915 1,559,086 6,041,477 8.99 9.51 (173,273) 533,652
CANADA | DOWNTOWN OFFICE | CLASS A
MARKET
EXISTING
INVENTORY (SF)
JUN 30, 2013
AVG. ANNUAL
QUOTED RENT
(CAD PSF)
JUN 30, 2013
QUARTERLY
CHANGE IN
RENT
(%)
ANNUAL
CHANGE
IN RENT
(%)
VACANCY
RATE (%)
MAR 31, 2013
VACANCY
RATE (%)
JUN 30, 2013
ABSORPTION
Q2 2013
(SF)
ABSORPTION
YEAR-TO-DATE
(SF)
Calgary, AB 12,294,319 44.00 0.0 2.3 8.78 8.23 196,010 272,375
Halifax, NS 2,853,857 28.50 0.5 -2.5 9.46 9.18 8,656 (100)
Montréal, QC 13,530,469 28.00 3.7 3.7 7.60 10.00 (170,711) (283,235)
Ottawa, ON 11,991,451 30.58 0.4 -2.8 9.77 9.83 (12,730) (69,888)
Toronto, ON 31,893,339 30.72 -0.2 -0.3 8.59 8.91 82,285 256,108
Vancouver, BC 14,555,232 33.65 -1.0 0.6 8.77 10.64 (96,294) (41,296)
Victoria, BC 802,299 38.00 0.0 5.6 13.98 16.65 5,110 5,110
Waterloo Region, ON 3,522,767 24.07 -0.5 -0.9 10.84 11.20 1,957 34,409
CANADA TOTAL 91,443,733 32.29 0.3 0.8 8.82 9.54 14,283 173,483
18. P. 18 | COLLIERS INTERNATIONAL
HIGHLIGHTS | Q2 2013 | OFFICE | NORTH AMERICA
UNITED STATES | OFFICE INVESTMENT
MARKET
CBD
SALES PRICE
(USD PSF)
CBD
CAP RATE
(%)
SUBURBAN
SALES PRICE
(USD PSF)
SUBURBAN
CAP RATE
(%)
Albuquerque, NM 150.00 8.8 175.00 8.0
Atlanta, GA 230.00 7.3 138.50 8.0
Bakersfield, CA 84.00 - 165.00 -
Baltimore, MD 69.00 - 41.43 8.8
Boston, MA 236.00 7.1 232.00 6.3
Charleston, SC 250.00 8.0 135.00 11.0
Chicago, IL 350.00 6.5 225.00 7.5
Cincinnati, OH 120.00 9.5 135.00 9.5
Columbia, SC - 8.8 - 9.5
Columbus, OH 94.00 8.5 - 8.5
Dallas, TX 98.00 - 123.00 7.5
Denver, CO 275.00 6.5 140.00 7.5
Detroit, MI 55.54 - 59.16 8.6
Fairfield County, CT - - 105.00 6.0
Fresno, CA 125.00 9.0 150.00 8.5
Ft. Lauderdale-Broward, FL 121.00 6.9 103.00 8.5
Grand Rapids, MI - - 309.43 -
Hartford, CT - - 174.52 7.5
Houston, TX 494.00 5.8 326.00 6.3
Indianapolis, IN 165.00 8.3 140.00 7.7
Jacksonville, FL - - 276.34 7.9
Las Vegas, NV - - 112.54 -
Little Rock, AR 88.00 9.0 125.00 8.5
Long Island, NY - - 177.53 7.7
Los Angeles – Inland Empire, CA - - 200.00 7.8
Los Angeles, CA 204.00 6.0 279.00 6.4
Miami-Dade, FL - - 352.00 -
Milwaukee, WI 120.00 9.0 100.00 9.5
Minneapolis, MN 147.56 - 78.99 7.0
Nashville, TN 200.00 7.0 120.00 7.0
New Jersey – Central** - - 121.00 5.7
New Jersey – Northern** - - 128.00 5.7
New York, NY – Downtown Manhattan 301.00 5.0 - -
New York, NY – Midtown Manhattan 1,140.00 5.6 - -
New York, NY – Midtown South Manhattan 847.00 4.7 - -
Oakland, CA 164.91 7.5 - 8.5
Orange County, CA - - 350.00 6.3
Orlando, FL 210.00 8.3 131.00 8.5
Philadelphia, PA 165.00 7.0 175.00 8.0
Phoenix, AZ 46.00 8.0 91.00 7.8
Pittsburgh, PA 110.00 8.5 100.00 8.5
Pleasanton/Tri-Valley, CA - - 151.85 9.9
Portland, OR - - 276.07 -
Sacramento, CA 139.12 - 90.02 -