SlideShare ist ein Scribd-Unternehmen logo
1 von 6
Downloaden Sie, um offline zu lesen
Copyright	(c)	2017	CompTIA	Properties,	LLC, All	Rights	Reserved	|	CompTIA.org	|	research@comptia.org
$40 $43 $39 $37
$28
$29 $33 $35
$13
$13 $14 $16
$14
$14 $14 $13
$6
$7 $7 $7
2012 2013 2014 2015
TOP	5	U.S.	SECTORS	FOR	MFG. EXPORTS
$	Billions
% of
Total
1. Transportation	/	motor	vehicles $276 19%
2. Tech	products $202 14%
3. Chemicals $185 13%
4. Agriculture,	food	&	beverage $138 9%
5. Machinery $125 9%
TOP	5	U.S.	SECTORS	FOR	SERVICES	EXPORTS
$	Billions
% of
Total
1. Travel	services $205 27%
2. Tech	services $107 14%
3. Financial	services $102 14%
4. Transport	(freight,	shipping) $87 12%
5. Professional	and	mgt.	consulting $65 9%
$161
$190 $198 $203 $205 $209 $205 $202
2009 2010 2011 2012 2013 2014 2015 2016
-2.6	B
-1.3%
TECH	PRODUCTS	EXPORTS
COMPTIA	TECH	TRADE	SNAPSHOT
IMPORTS	AND	EXPORTS	OF	TECH	PRODUCTS	AND	SERVICES
Published	April	2017
(IN	BILLIONS	OF	CURRENT	DOLLARS)
Source:	International	Trade	Administration,	U.S.	Department	of	Commerce
Covers	goods	in	NAICS	334,	computer	and	electronic	product	manufacturing
OVERVIEW
v U.S. exports of tech products and services were an estimated $309
billion in 2016, a slight decrease from the previous year. Tech is
one of the largest sectors for exports in the U.S. economy.
v Exports account for approximately $1 out of every $4 generated in
the U.S. tech industry. For many tech bellwethers, exports account
for an even higher percentage of sales, with some generating more
than half of their revenue overseas.
v Tech products exports, also referred to as manufactured goods, fell
1.3 percent to $202 billion. The bright spots in this category include
semiconductors, which added $2.2 billion (+3.1 percent) and
communications equipment, up $1.9 billion (+1.7 percent).
v Tech services exports were flat for the most recently available data
compiled for 2015. Growth did occur in IT services, which added
$1.8 billion (+12.7 percent), and R&D services, which added $1.6
billion (+4.8 percent).
v Tech services exports continue to capture a larger share of total
U.S. tech exports. Since 2005, its share has more than doubled and
now exceeds 34 percent of total tech exports.
v According to the U.S. International Trade Administration’s Office of
Trade and Economic Analysis, exports of tech products directly
supported an estimated 425,465 industry jobs in 2014, the most
recent year of analysis. This translates to approximately 4 in 10
tech manufacturing industry jobs supported by exports.
TECH	SERVICES	EXPORTS
+5.5	B
+5.5%
Software	/	
Software-as-a-service
R&D	services
Information	services
Telecom	services
IT	services
$106	B $107	B
Source:	U.S.	Bureau	of	Economic	Analysis	(BEA)	
2016	data	not	yet	available	at	time	of	publication
$101	B
+1.0	B
+0.9%
Billions	of	current	dollars	
$107	B
0.0	B
0.0%
Exports	account	for	approximately	
$1	out	of	every	$4	generated	in	the	
U.S.	tech	industry
Exports	directly	support	4	in	10	
U.S.	tech	manufacturing	sector	jobs
“
”	
Source:	U.S.	International	Trade	Administration	and	Bureau	of	Economic	Analysis	(BEA)	
Manufactured	goods	export	data	covers	2016;	services	export	data	covers	2015
Copyright	(c)	2017	CompTIA	Properties,	LLC, All	Rights	Reserved	|	CompTIA.org	|	research@comptia.org
STATE AND TRADING PARTNER SUMMARY
v Fourteen states experienced positive growth of tech
products (manufactured goods) exports in 2016. The
states with the largest percent change growth year-over-
year include: Mississippi (+18.7%), West Virginia (+18.7%),
Idaho (+14.6%), Rhode Island (+12.2%), and Oregon
(+11.8%). On a dollar value basis, Texas generated the
most new export-driven revenue at $1.9 billion.
v The strong U.S. dollar has been a contributing factor to
sluggish export growth (see Appendix for more detail).
v Among metro areas, San Jose exports the greatest
volume of tech products at $14.4 billion. Los Angeles, El
Paso, New York City, and Portland round out the top five
metro area tech product exporters (see Appendix for data
covering the top 20 metro areas).
v The leading markets for U.S. tech products exports
remained largely unchanged from the previous year. The
top ten markets account for 68 percent of total tech
goods exports. The top ten countries for tech products
imports into the U.S. account for 89 percent of all imports
in this category.
LEADING	TRADING	PARTNERS	FOR	TECH	
PRODUCTS,	2016	
U.S.	TECH	PRODUCTS	EXPORTS	BY	STATE
billions	of	current	dollars	/	tech	mfg.	goods	
Source:	International	Trade	Administration,	U.S.	Department	of	Commerce
Rank State 2015 2016 %	change
1. Texas $45.3 $47.2 4.1%
2. California $43.2 $42.4 -1.9%
3. Florida $12.0 $12.0 0.2%
4. Oregon $9.0 $10.0 11.8%
5. Illinois $8.0 $7.7 -3.9%
6. Massachusetts $7.3 $7.0 -4.9%
7. New	York $6.9 $6.3 -8.6%
8. Arizona $5.6 $5.6 0.9%
9. Tennessee $5.4 $5.3 -1.7%
10. New	Jersey $4.2 $4.2 -0.2%
11. Washington $3.8 $3.8 0.2%
12. Pennsylvania $4.2 $3.5 -17.5%
13. Minnesota $3.5 $3.4 -5.1%
14. Michigan $3.0 $3.1 2.6%
15. Wisconsin $3.2 $2.9 -11.7%
16. Ohio $2.8 $2.6 -7.5%
17. North	Carolina $2.8 $2.4 -13.9%
18. Georgia $2.3 $2.4 6.4%
19. Idaho $2.0 $2.2 14.6%
20. Virginia $2.3 $2.2 -3.4%
21. New	Mexico $2.4 $2.1 -11.1%
22. Colorado $1.9 $1.9 -1.9%
23. Vermont $2.1 $1.9 -8.7%
24. Utah $2.1 $1.7 -19.0%
25. Nevada $1.5 $1.6 8.0%
26. Kentucky $1.8 $1.6 -8.6%
27. Maryland $1.6 $1.6 -4.3%
28. Indiana $1.4 $1.6 8.5%
29. New	Hampshire $1.5 $1.3 -15.8%
30. South	Carolina $1.2 $1.2 2.3%
31. Connecticut $1.2 $1.1 -6.9%
32. Mississippi $0.7 $0.9 18.7%
33. Oklahoma $0.7 $0.7 -0.7%
34. Kansas $0.7 $0.7 -9.0%
35. Missouri $0.7 $0.6 -7.0%
36. Iowa $0.6 $0.6 -0.7%
37. Alabama $0.6 $0.6 -4.5%
38. Delaware $0.7 $0.5 -24.4%
39. Maine $0.4 $0.3 -13.9%
40. Arkansas $0.5 $0.3 -44.8%
41. Nebraska $0.2 $0.2 -15.9%
42. Louisiana $0.2 $0.2 -24.1%
43. Rhode	Island $0.1 $0.2 12.2%
44. West	Virginia $0.10 $0.12 18.7%
45. South	Dakota $0.12 $0.09 -22.2%
46. North	Dakota $0.05 $0.05 -1.6%
47. District	of	Columbia $0.06 $0.04 -21.9%
48. Hawaii $0.04 $0.04 -9.1%
49. Montana $0.05 $0.03 -34.7%
50. Alaska $0.04 $0.02 -40.5%
51. Wyoming $0.02 $0.01 -32.5%
Exports	from	U.S. Imports	to	U.S.
1. Mexico 1. China
2. Canada 2. Mexico
3. China 3. Malaysia
4. Hong	Kong 4. South	Korea
5. Japan 5. Japan
6. Germany 6. Taiwan
7. Malaysia 7. Thailand
8. Netherlands 8. Viet	Nam
9. South	Korea 9. Germany
10. Taiwan 10. Canada
Exports	from	U.S. Imports	to	U.S.
1. United	Kingdom 1. India
2. Brazil 2. Canada
3. Canada 3. United	Kingdom
4. Switzerland 4. Ireland
5. Argentina 5. Philippines
6. Japan 6. Mexico
7. Germany 7. China
8. Australia 8. Germany
9. India 9. Netherlands
10. Mexico 10. Switzerland
LEADING	TRADING	PARTNERS	FOR	TECH	
SERVICES*,	2015	
The	tech	services	covered	in	this	data	include	IT	services,	telecom	services,	and	information	services.	
Software	services,	R&D	services,	certain	data	hosting	services,	engineering	services,	certain	repair	services,	
and	distribution	services	are	not	included	due	to	limitations	in	the	way	the	BEA	aggregates	trade	data.
Copyright	(c)	2017	CompTIA	Properties,	LLC, All	Rights	Reserved	|	CompTIA.org	|	research@comptia.org
TRADE SUPPORTED JOBS SUMMARY
v According to the U.S. International Trade Administration’s
Office of Trade and Economic Analysis, exports of goods
and services from the U.S. support an estimated 11.5
million jobs in 2015, the most recent year of analysis. The
methodology used to develop these estimates includes
jobs directly and indirectly supported by exports.
v Goods exports consisting of manufactured products,
agricultural products, and natural resources supported
6.7 million jobs. The export of services accounted for the
remaining 4.8 million jobs supported. Since 2009, the
estimated number of jobs supported by the export of
goods has grown by 900,000. For more detail, see
http://trade.gov/mas/ian/employment/index.asp.
v Specific to technology, the Office of Trade and Economic
Analysis reports exports tech manufactured goods
supported an estimated 425,465 industry jobs in 2014,
the most recent year of analysis. Nationally, this
translates to approximately 4 in 10 jobs in the tech
manufacturing industry support by exports.
v The Office of Trade and Economic Analysis does not
provide state-level export-supported employment figures.
One approach for converting national-level data to state-
level data is to apportion the data according to the level
of exports. The assumption is there is a relationship
between the volume of exports and the size of the
workforce needed to support producing and delivering
those products to international customers. There are
limitations to this approach given that tech manufacturers
in some states are assembling products from components
supplied from other states, which presents challenges in
where to allocate the jobs. This is typically signified by
having a very high level of tech products exports relative
to the size of the state’s tech manufacturing workforce.
This is the case in states such as Tennessee, Vermont and
Texas. Adjustments were made to the workforce
estimates in these cases.
v Jobs supported by tech services, including software,
exports are embedded in the top level categories
covering information and professional and business
services, so there is not an established baseline for tech
services jobs supported by exports. The Office of Trade
and Economic Analysis estimates 12 percent of overall
jobs in these categories are supported by exports.
Assuming this 12 percent rate roughly holds for the tech
services sectors, upwards of potentially several hundred
thousand jobs are supported by exports in the tech
services sector.
v Note regarding use of data from The Office of Trade and
Economic Analysis: ”given the data used to estimate jobs
supported by state-level exports, care should be taken in
the interpretation of the results. The figures presented
should best be thought of as representing the number of
jobs supported by the exports from a state as opposed to
the number of jobs supported by exports within a state.”
Source:	estimates	made	by	CompTIA	using	data	from	the	Office	of	
Trade	and	Economic	Analysis	covering	the	2014	time	period
TECH	MFG	INDUSTRY	JOBS	SUPPORTED	BY	EXPORTS
State
Total	
Tech	Mfg.	
Workforce
Est.	Industry	
Jobs	Supported
by	Exports
%	of	
Total
Alabama 9,005 1,452 16%
Alaska 106 66 62%
Arizona 34,742 11,070 32%
Arkansas 2,481 708 29%
California 261,608 95,216 36%
Colorado 21,481 4,449 21%
Connecticut 12,545 2,822 22%
Delaware 2,834 2,162 76%
District	of	Columbia 42 35 83%
Florida 40,656 31,212 77%
Georgia 10,343 5,119 49%
Hawaii 186 117 63%
Idaho 11,551 5,022 43%
Illinois 31,649 16,281 51%
Indiana 15,299 4,109 27%
Iowa 12,602 1,291 10%
Kansas 5,217 1,639 31%
Kentucky 5,240 4,354 83%
Louisiana 2,430 656 27%
Maine 2,295 579 25%
Maryland 17,725 3,641 21%
Massachusetts 56,605 18,138 32%
Michigan 18,111 7,095 39%
Minnesota 45,119 8,436 19%
Mississippi 2,201 1,829 83%
Missouri 9,709 1,264 13%
Montana 579 98 17%
Nebraska 4,400 543 12%
Nevada 2,811 2,336 83%
New	Hampshire 14,438 3,934 27%
New	Jersey 23,022 10,172 44%
New	Mexico 6,254 4,629 74%
New	York 56,537 15,318 27%
North	Carolina 32,126 7,092 22%
North	Dakota 1,416 110 8%
Ohio 19,387 6,028 31%
Oklahoma 4,802 1,830 38%
Oregon 36,448 18,113 50%
Pennsylvania 31,229 8,444 27%
Rhode	Island 3,302 330 10%
South	Carolina 6,380 2,804 44%
South	Dakota 2,239 309 14%
Tennessee 5,056 4,202 83%
Texas 95,802 79,612 83%
Utah 12,935 5,228 40%
Vermont 5,430 4,512 83%
Virginia 11,302 5,558 49%
Washington 19,908 8,719 44%
West	Virginia 1,207 269 22%
Wisconsin 18,371 6,468 35%
Wyoming 287 42 15%
Copyright	(c)	2017	CompTIA	Properties,	LLC, All	Rights	Reserved	|	CompTIA.org	|	research@comptia.org
0.0
10.0
20.0
30.0
40.0
50.0
60.0
70.0
80.0
1996	
est
1997	
est
1998	
est
1999	
est
2000	
est
2001	
est
2002	
est
2003	
est
2004	
est
2005	
est
2006 2007 2008 2009 2010 2011 2012 2013 2014 2015 2016	
est
$	billions	|	current	dollars
Imports Exports
SUMMARY	OF	TECH	PRODUCTS	&	SERVICES	TRADE	
BETWEEN	THE	UNITED	STATES	AND	CANADA/MEXICO
U.S.	Exports	
of	Tech	
Products to:
1996	
est
1997	
est
1998	
est
1999	
est
2000	
est
2001	
est 2002 2003 2004 2005 2006 2007 2008 2009 2010 2011 2012 2013 2014 2015 2016
Canada 19.3 21.8 22.1 22.9 27.0 22.4 19.9 20.3 23.0 25.0 25.1 25.5 25.3 21.2 25.6 27.8 28.7 28.0 27.8 25.3 24.2
Mexico 10.7 14.9 14.9 17.6 24.6 24.9 21.6 21.7 24.5 23.4 25.4 23.0 24.6 25.0 33.0 35.2 36.6 38.6 40.5 43.2 42.9
TOTAL 30.0 36.7 37.0 40.5 51.6 47.3 41.5 42.0 47.5 48.4 50.5 48.5 49.9 46.2 58.6 63.0 65.3 66.6 68.3 68.5 67.1
U.S.	Exports
of	Tech	
Services	to:
1996	
est
1997	
est
1998	
est
1999	
est
2000	
est
2001	
est
2002	
est
2003	
est
2004	
est
2005	
est 2006 2007 2008 2009 2010 2011 2012 2013 2014 2015
2016	
est
Canada 1.4 1.5 1.6 1.7 2.1 2.2 2.4 2.8 3.0 3.6 4.7 4.4 4.5 4.5 5.5 6.2 6.1 6.2 6.2 5.9 NA
Mexico 0.5 0.6 0.6 0.6 0.7 0.9 0.9 0.8 0.8 1.0 1.2 1.2 1.3 1.2 1.6 1.8 1.9 2.0 2.0 2.0 NA
TOTAL 1.9 2.1 2.2 2.3 2.8 3.1 3.3 3.6 3.8 4.6 5.9 5.6 5.8 5.7 7.1 8.0 8.0 8.2 8.2 7.9 NA
SUMMARY	OF	TRADE	WITH	CANADA	AND	MEXICO	
v Total exports of tech products (manufactured goods) and tech
services from the U.S. to Canada and Mexico reached an
estimated $74.8 billion in 2016.
v Among all trading partners in tech products, the U.S. runs the
largest surplus with Canada. U.S. exports exceeded imports by
$17.7 billion in 2016. The categories where the U.S.
experienced the largest surpluses were computers and
peripherals (+$7.4 billion) and communications equipment
(+$3.3 billion).
v Trade of tech services is nearly in balance between the U.S. and
Canada ($5.9 billion vs. $6.1 billion). In the notable categories,
the U.S. ran a surplus of $2.2 billion in software, and a deficit of
-$1.8 billion in IT services in 2015, the most recent year of
available data.
v U.S. International Trade Administration data indicates the U.S.
runs a trade deficit with Mexico in tech products
(manufactured goods), while running a surplus in tech services.
In 2016, tech products imports from Mexico exceeded exports
by $15.5 billion. It should be noted, the U.S. did have a $7.9
billion surplus in exports of semiconductors. Semiconductor
exports to Mexico increased 6.0 percent year-over-year.
v Because U.S. International Trade Administration data reflects
the total wholesale value of product, situations do occur
whereby a country may assemble a product comprised of
components produced elsewhere, but get credit for the full
value of the export. Semiconductors are an example of a
primary component in the global supply chain for many
products – from computers to cars, that may be assembled and
then re-exported.
Source:	International	Trade	Administration,	U.S.	Department	of	Commerce	|	CompTIA	estimates
Copyright	(c)	2017	CompTIA	Properties,	LLC, All	Rights	Reserved	|	CompTIA.org	|	research@comptia.org
0.0
2.0
4.0
6.0
8.0
10.0
12.0
2002 2003 2004 2005 2006 2007 2008 2009 2010 2011 2012 2013 2014 2015 2016
$	billions	|	current	dollars
Optical	media Audio	/	video
Computer	products Communications	equipment
Semiconductors Navigational,	measuring,	medical	tech
EXPORTS	OF	TECH	PRODUCTS	FROM	THE	U.S.	TO	JAPAN
SUMMARY OF TRADE WITH JAPAN
v U.S. exports of tech products (manufactured goods) and tech
services to Japan were an estimated $14.7 billion in 2016, an
increase of approximately 2.3 percent year-over-year.
v Tech products accounted for 56 percent of exports to Japan,
with tech services accounting for the remainder. In the Asia and
Pacific region, Japan is the largest market for U.S. tech services.
v Imports from Japan were an estimated $17.1 billion in 2016,
down approximately 2.5 percent from the previous year. Tech
imports from Japan are dominated by manufactured goods,
which account for 90 percent of the total.
v Exports to Japan experienced the strongest gains in
communications equipment (up 34 percent or +$349 million)
and computer products (up 14 percent or +$130 million).
Conversely, semiconductors saw the largest drop at -13.2
percent or -$249 million.
v Exports of IT services to Japan improved $149 million, an
impressive gain of nearly 24 percent.
v Despite the 27.6 percent drop in 2015, software remains the
largest component of tech services exports to Japan.
U.S.	Exports	of	
Tech	Products	to: 2002 2003 2004 2005 2006 2007 2008 2009 2010 2011 2012 2013 2014 2015 2016
Japan 10.9 10.2 10.5 9.9 10.6 9.6 8.8 7.2 7.7 8.2 9.3 8.6 8.6 8.0 8.3
U.S.	Exports of	
Tech	Services	to: 2002 2003 2004 2005 2006 2007 2008 2009 2010 2011 2012 2013 2014 2015
2016	
est
Japan NA NA NA NA 6.1	 4.2	 5.2	 6.1	 8.2	 8.3	 8.4	 8.3	 7.7	 6.4	 NA
Source:	International	Trade	Administration,	U.S.	Department	of	Commerce	|	CompTIA	estimates
Copyright	(c)	2017	CompTIA	Properties,	LLC, All	Rights	Reserved	|	CompTIA.org	|	research@comptia.org
Source:	International	Trade	Administration,	U.S.	Department	of	Commerce,	2015	data
APPENDIX
v The already strong U.S. dollar ended 2016 with another
gain against a basket of major currencies. This put the
dollar at a 14-year high, marking a 42 percent increase
since its most recent low point of 2011. A strong dollar
provides greater purchasing power, making international
travel or imports relatively cheaper. The tradeoff, though,
U.S. exports become more expensive to many overseas
buyers.
v Tech product imports (tech manufactured goods) into the
U.S. totaled $373 billion in 2016, down slightly (-0.8%)
from 2015. In the aggregate, the U.S. runs a deficit in tech
products trade. The deficit is largest for communications
equipment, followed by computing equipment. As noted
previously, the manner in which trade data is compiled
can result in situations that overstate the economic value
of exports/imports.
v The U.S. runs a surplus in tech services trade, which
totaled +$32 billion in 2015, the most recent year of
available tech services data.
v There is likely some degree of undercounting of tech
products and services exports. This stems from the
ongoing blurring of lines between constitutes tech, as
well as how tech is categorized by government data
sources. For example, an automobile company exporting
its own autonomous vehicle technology or a financial
services firm providing big data services abroad, would
not be included in the tech products and services export
figures. Rather, they would be captured within the motor
vehicles and financial services export categories.
v For additional data and detail on manufactured product
exports, see http://tse.export.gov/tse/tsehome.aspx.
v For additional data and detail on manufactured product
exports, see https://www.bea.gov/iTable/index_ita.cfm.
U.S.	TECH	PRODUCTS	EXPORTS	BY	METRO	AREA
billions	of	current	dollars	/	tech	mfg.	goods	
Metropolitan	Statistical	Area	(MSA) 2015
YoY	%	
change
San	Jose-Sunnyvale-Santa	Clara,	CA $14.4 -6.3%
Los	Angeles-Long	Beach-Anaheim,	CA $12.7 -31.4%
El	Paso,	TX $12.6 68.7%
New	York-Newark-Jersey	City,	NY-NJ-PA $9.5 7.7%
Portland-Vancouver-Hillsboro,	OR-WA $8.6 9.8%
Miami-Fort	Lauderdale-West	Palm	Beach,	FL $8.6 -13.7%
Boston-Cambridge-Newton,	MA-NH $7.4 -17.3%
Houston-The	Woodlands-Sugar	Land,	TX $6.9 -4.4%
Dallas-Fort	Worth-Arlington,	TX $6.8 1.6%
Chicago-Naperville-Elgin,	IL-IN-WI $6.7 4.9%
Austin-Round	Rock,	TX $5.8 8.9%
San	Francisco-Oakland-Hayward,	CA $5.6 -5.9%
Phoenix-Mesa-Scottsdale,	AZ $4.1 9.2%
Minneapolis-St.	Paul-Bloomington,	MN-WI $3.3 -2.5%
Seattle-Tacoma-Bellevue,	WA $3.2 -5.2%
San	Diego-Carlsbad,	CA $2.9 -3.9%
El	Centro,	CA $2.9 42.2%
Detroit-Warren-Dearborn,	MI $2.9 -13.0%
Washington-Arlington-Alexandria,	DC-VA-MD-WV $2.8 16.1%
Memphis,	TN-MS-AR $2.4 -1.4%
Atlanta-Sandy	Springs-Roswell,	GA $2.3 -2.2%
Philadelphia-Camden-Wilmington,	PA-NJ-DE-MD $2.2 -23.0%
Nashville-Davidson-Murfreesboro-Franklin,	TN $2.2 -0.1%
Milwaukee-Waukesha-West	Allis,	WI $2.0 -6.9%
Boise	City-Nampa,	ID $1.9 -14.0%
McAllen-Edinburg-Mission,	TX $1.7 -9.5%
Laredo,	TX $1.6 42.6%
Burlington-South	Burlington,	VT $1.5 NA
Rochester,	NY $1.5 -0.4%
Tampa-St.	Petersburg-Clearwater,	FL $1.5 -28.8%
Riverside-San	Bernardino-Ontario,	CA $1.5 -7.1%
Provo-Orem,	UT $1.2 -13.4%
Albuquerque,	NM $1.2 26.4%
Louisville/Jefferson	County,	KY-IN $1.1 -14.3%
San	Antonio-New	Braunfels,	TX $1.1 18.4%
Reno-Sparks,	NV $1.1 -8.2%
Baltimore-Columbia-Towson,	MD $1.1 -7.5%
Cincinnati-Middletown,	OH-KY-IN $0.9 9.3%
St.	Louis,	MO-IL $0.9 16.4%
Kansas	City,	MO-KS $0.9 4.3%
Salt	Lake	City,	UT $0.8 -1.6%
Pittsburgh,	PA $0.8 -0.7%
Raleigh-Cary,	NC $0.8 -9.0%
Harrisburg-Carlisle,	PA $0.7 NA
Manchester-Nashua,	NH $0.7 NA
Brownsville-Harlingen,	TX $0.7 -14.9%
Oxnard-Thousand	Oaks-Ventura,	CA $0.7 -4.3%
ABOUT COMPTIA
The Computing Technology Industry Association (CompTIA) is
the world's leading not-for-profit technology association.
With approximately 2,000 member companies, 3,000
academic and training partners, over 100,000 registered
users and more than 2 million IT certifications issued,
CompTIA is dedicated to serving the tech industry and tech
workforce through education and training programs, market
intelligence, social innovation, and more.
CompTIA advocates for trade policies that expand export
destinations and open new markets for the U.S. technology
sector. For more details on CompTIA’s trade work, visit
https://www.comptia.org/advocacy/policy-issues/global-
trade-and-market-access.

Weitere ähnliche Inhalte

Was ist angesagt?

It business climate v3
It business climate v3It business climate v3
It business climate v3Martin Hingley
 
Ulster Bank Northern Ireland Purchasing Managers Index (PMI) January 2017
Ulster Bank Northern Ireland Purchasing Managers Index (PMI) January 2017Ulster Bank Northern Ireland Purchasing Managers Index (PMI) January 2017
Ulster Bank Northern Ireland Purchasing Managers Index (PMI) January 2017Richard Ramsey
 
Global Innovation Index 2021 - Vietnam
Global Innovation Index 2021 - VietnamGlobal Innovation Index 2021 - Vietnam
Global Innovation Index 2021 - VietnamWiziin Inc.
 
Российские инновации сравнение с Индией, Китаем и Бразилией
Российские инновации сравнение  с Индией, Китаем и БразилиейРоссийские инновации сравнение  с Индией, Китаем и Бразилией
Российские инновации сравнение с Индией, Китаем и БразилиейDmitry Tseitlin
 
Turkey 2016-oecd-economic-survey-removing-productivity-bottlenecks
Turkey 2016-oecd-economic-survey-removing-productivity-bottlenecksTurkey 2016-oecd-economic-survey-removing-productivity-bottlenecks
Turkey 2016-oecd-economic-survey-removing-productivity-bottlenecksOECD, Economics Department
 
What's on the horizon for the U.S. Skyline?
What's on the horizon for the U.S. Skyline?What's on the horizon for the U.S. Skyline?
What's on the horizon for the U.S. Skyline?JLL
 
Case Study on Sourcing Opportunities in Mexico
Case Study on Sourcing Opportunities in MexicoCase Study on Sourcing Opportunities in Mexico
Case Study on Sourcing Opportunities in MexicoJohn William
 
U.S. construction trends and outlook (Q1 2016)
U.S. construction trends and outlook (Q1 2016)U.S. construction trends and outlook (Q1 2016)
U.S. construction trends and outlook (Q1 2016)JLL
 
Key Findings from Entrepreneurship at a Glance 2016
Key Findings from Entrepreneurship at a Glance 2016Key Findings from Entrepreneurship at a Glance 2016
Key Findings from Entrepreneurship at a Glance 2016StatsCommunications
 
Ulster Bank NI PMI, June 2014
Ulster Bank NI PMI, June 2014Ulster Bank NI PMI, June 2014
Ulster Bank NI PMI, June 2014Richard Ramsey
 
U.S. employment update and outlook: December 2014
U.S. employment update and outlook: December 2014U.S. employment update and outlook: December 2014
U.S. employment update and outlook: December 2014JLL
 
An Overview on the N10 Countries by Dragon Sourcing
An Overview on the N10 Countries by Dragon SourcingAn Overview on the N10 Countries by Dragon Sourcing
An Overview on the N10 Countries by Dragon SourcingJohn William
 
Driving Productivity Growth: The Importance of Firm-Specific Knowledge Assets
Driving Productivity Growth: The Importance of Firm-Specific Knowledge AssetsDriving Productivity Growth: The Importance of Firm-Specific Knowledge Assets
Driving Productivity Growth: The Importance of Firm-Specific Knowledge AssetsStructuralpolicyanalysis
 
U.S. employment update and outlook: November 2014
U.S. employment update and outlook: November 2014U.S. employment update and outlook: November 2014
U.S. employment update and outlook: November 2014JLL
 

Was ist angesagt? (20)

It business climate v3
It business climate v3It business climate v3
It business climate v3
 
Ulster Bank Northern Ireland Purchasing Managers Index (PMI) January 2017
Ulster Bank Northern Ireland Purchasing Managers Index (PMI) January 2017Ulster Bank Northern Ireland Purchasing Managers Index (PMI) January 2017
Ulster Bank Northern Ireland Purchasing Managers Index (PMI) January 2017
 
Global Innovation Index 2021 - Vietnam
Global Innovation Index 2021 - VietnamGlobal Innovation Index 2021 - Vietnam
Global Innovation Index 2021 - Vietnam
 
Российские инновации сравнение с Индией, Китаем и Бразилией
Российские инновации сравнение  с Индией, Китаем и БразилиейРоссийские инновации сравнение  с Индией, Китаем и Бразилией
Российские инновации сравнение с Индией, Китаем и Бразилией
 
Turkey 2016-oecd-economic-survey-removing-productivity-bottlenecks
Turkey 2016-oecd-economic-survey-removing-productivity-bottlenecksTurkey 2016-oecd-economic-survey-removing-productivity-bottlenecks
Turkey 2016-oecd-economic-survey-removing-productivity-bottlenecks
 
What's on the horizon for the U.S. Skyline?
What's on the horizon for the U.S. Skyline?What's on the horizon for the U.S. Skyline?
What's on the horizon for the U.S. Skyline?
 
Case Study on Sourcing Opportunities in Mexico
Case Study on Sourcing Opportunities in MexicoCase Study on Sourcing Opportunities in Mexico
Case Study on Sourcing Opportunities in Mexico
 
4Q17 Global ISG Index
4Q17 Global ISG Index4Q17 Global ISG Index
4Q17 Global ISG Index
 
From "Made in China" to "Innovated in China"
From "Made in China" to "Innovated in China"From "Made in China" to "Innovated in China"
From "Made in China" to "Innovated in China"
 
U.S. construction trends and outlook (Q1 2016)
U.S. construction trends and outlook (Q1 2016)U.S. construction trends and outlook (Q1 2016)
U.S. construction trends and outlook (Q1 2016)
 
Key Findings from Entrepreneurship at a Glance 2016
Key Findings from Entrepreneurship at a Glance 2016Key Findings from Entrepreneurship at a Glance 2016
Key Findings from Entrepreneurship at a Glance 2016
 
Ulster Bank NI PMI, June 2014
Ulster Bank NI PMI, June 2014Ulster Bank NI PMI, June 2014
Ulster Bank NI PMI, June 2014
 
U.S. employment update and outlook: December 2014
U.S. employment update and outlook: December 2014U.S. employment update and outlook: December 2014
U.S. employment update and outlook: December 2014
 
3Q18 Global ISG Index
3Q18 Global ISG Index3Q18 Global ISG Index
3Q18 Global ISG Index
 
1Q18 Global ISG Index
1Q18 Global ISG Index1Q18 Global ISG Index
1Q18 Global ISG Index
 
An Overview on the N10 Countries by Dragon Sourcing
An Overview on the N10 Countries by Dragon SourcingAn Overview on the N10 Countries by Dragon Sourcing
An Overview on the N10 Countries by Dragon Sourcing
 
Driving Productivity Growth: The Importance of Firm-Specific Knowledge Assets
Driving Productivity Growth: The Importance of Firm-Specific Knowledge AssetsDriving Productivity Growth: The Importance of Firm-Specific Knowledge Assets
Driving Productivity Growth: The Importance of Firm-Specific Knowledge Assets
 
U.S. employment update and outlook: November 2014
U.S. employment update and outlook: November 2014U.S. employment update and outlook: November 2014
U.S. employment update and outlook: November 2014
 
2Q18 EMEA ISG Index
2Q18 EMEA ISG Index2Q18 EMEA ISG Index
2Q18 EMEA ISG Index
 
4Q 2018 EMEA ISG Index™
4Q 2018 EMEA ISG Index™4Q 2018 EMEA ISG Index™
4Q 2018 EMEA ISG Index™
 

Ähnlich wie CompTIA Tech Trade Snapshot 2017

Software industry of pakistan 1995 2008
Software industry of pakistan 1995 2008Software industry of pakistan 1995 2008
Software industry of pakistan 1995 2008M.Nadeem Jahangir
 
Presentation-MeitY-Schemes-24Feb2021.pptx
Presentation-MeitY-Schemes-24Feb2021.pptxPresentation-MeitY-Schemes-24Feb2021.pptx
Presentation-MeitY-Schemes-24Feb2021.pptxabhishekkumar807235
 
Competitiveness Series - National Technology Trade
Competitiveness Series - National Technology TradeCompetitiveness Series - National Technology Trade
Competitiveness Series - National Technology TradeMatthew Kazmierczak
 
Cyberstates 2016
Cyberstates 2016 Cyberstates 2016
Cyberstates 2016 CompTIA
 
IT Industry in India after Liberalization
IT Industry in India after LiberalizationIT Industry in India after Liberalization
IT Industry in India after LiberalizationAli Sadhik Shaik
 
13613-Wipro-Limited.pdfpleas give pdffor
13613-Wipro-Limited.pdfpleas give pdffor13613-Wipro-Limited.pdfpleas give pdffor
13613-Wipro-Limited.pdfpleas give pdfforkushimgowda28
 
ICT Sector in Jordan 2018
ICT Sector in Jordan 2018ICT Sector in Jordan 2018
ICT Sector in Jordan 2018Nidal Bitar
 
Trendeo R&D investments worldwide, may 2018
Trendeo R&D investments worldwide, may 2018Trendeo R&D investments worldwide, may 2018
Trendeo R&D investments worldwide, may 2018Trendeo
 
Day 1 C2C - Deloitte - Government Support for ICT Development, Success strate...
Day 1 C2C - Deloitte - Government Support for ICT Development, Success strate...Day 1 C2C - Deloitte - Government Support for ICT Development, Success strate...
Day 1 C2C - Deloitte - Government Support for ICT Development, Success strate...Myles Freedman
 
Industrial investments worldwide 2019
Industrial investments worldwide 2019Industrial investments worldwide 2019
Industrial investments worldwide 2019Trendeo
 
Software and Technology Services - 2021 M&A Summary
Software and Technology Services - 2021 M&A SummarySoftware and Technology Services - 2021 M&A Summary
Software and Technology Services - 2021 M&A SummaryAlps Venture Partners
 
growth of service sector in india after post independence era...
growth of service sector in india after post independence era...growth of service sector in india after post independence era...
growth of service sector in india after post independence era...DIPANJAN ROY
 
Forbes m+a business services report q1 2021
Forbes m+a business services report q1 2021Forbes m+a business services report q1 2021
Forbes m+a business services report q1 2021Jarred Olson
 

Ähnlich wie CompTIA Tech Trade Snapshot 2017 (20)

4Q16 Global ISG Index
4Q16 Global ISG Index4Q16 Global ISG Index
4Q16 Global ISG Index
 
Software industry of pakistan 1995 2008
Software industry of pakistan 1995 2008Software industry of pakistan 1995 2008
Software industry of pakistan 1995 2008
 
Presentation-MeitY-Schemes-24Feb2021.pptx
Presentation-MeitY-Schemes-24Feb2021.pptxPresentation-MeitY-Schemes-24Feb2021.pptx
Presentation-MeitY-Schemes-24Feb2021.pptx
 
Fuente India Advantage
Fuente India AdvantageFuente India Advantage
Fuente India Advantage
 
Competitiveness Series - National Technology Trade
Competitiveness Series - National Technology TradeCompetitiveness Series - National Technology Trade
Competitiveness Series - National Technology Trade
 
IR-Presentation-Aug-2015
IR-Presentation-Aug-2015IR-Presentation-Aug-2015
IR-Presentation-Aug-2015
 
Cyberstates 2016
Cyberstates 2016 Cyberstates 2016
Cyberstates 2016
 
IT Industry in India after Liberalization
IT Industry in India after LiberalizationIT Industry in India after Liberalization
IT Industry in India after Liberalization
 
IT_Pros_national
IT_Pros_nationalIT_Pros_national
IT_Pros_national
 
13613-Wipro-Limited.pdfpleas give pdffor
13613-Wipro-Limited.pdfpleas give pdffor13613-Wipro-Limited.pdfpleas give pdffor
13613-Wipro-Limited.pdfpleas give pdffor
 
Oecd amro s2 01_thailand dr porametee vimolsiri
Oecd amro s2 01_thailand dr porametee vimolsiriOecd amro s2 01_thailand dr porametee vimolsiri
Oecd amro s2 01_thailand dr porametee vimolsiri
 
Global Cities Initiative | Detroit
Global Cities Initiative | DetroitGlobal Cities Initiative | Detroit
Global Cities Initiative | Detroit
 
SYS 13-04-2016
SYS 13-04-2016SYS 13-04-2016
SYS 13-04-2016
 
ICT Sector in Jordan 2018
ICT Sector in Jordan 2018ICT Sector in Jordan 2018
ICT Sector in Jordan 2018
 
Trendeo R&D investments worldwide, may 2018
Trendeo R&D investments worldwide, may 2018Trendeo R&D investments worldwide, may 2018
Trendeo R&D investments worldwide, may 2018
 
Day 1 C2C - Deloitte - Government Support for ICT Development, Success strate...
Day 1 C2C - Deloitte - Government Support for ICT Development, Success strate...Day 1 C2C - Deloitte - Government Support for ICT Development, Success strate...
Day 1 C2C - Deloitte - Government Support for ICT Development, Success strate...
 
Industrial investments worldwide 2019
Industrial investments worldwide 2019Industrial investments worldwide 2019
Industrial investments worldwide 2019
 
Software and Technology Services - 2021 M&A Summary
Software and Technology Services - 2021 M&A SummarySoftware and Technology Services - 2021 M&A Summary
Software and Technology Services - 2021 M&A Summary
 
growth of service sector in india after post independence era...
growth of service sector in india after post independence era...growth of service sector in india after post independence era...
growth of service sector in india after post independence era...
 
Forbes m+a business services report q1 2021
Forbes m+a business services report q1 2021Forbes m+a business services report q1 2021
Forbes m+a business services report q1 2021
 

Mehr von CompTIA

CompTIA IT Employment Tracker – December 2021
CompTIA IT Employment Tracker –  December 2021CompTIA IT Employment Tracker –  December 2021
CompTIA IT Employment Tracker – December 2021CompTIA
 
CompTIA IT Employment Tracker – November 2021
CompTIA IT Employment Tracker –  November 2021CompTIA IT Employment Tracker –  November 2021
CompTIA IT Employment Tracker – November 2021CompTIA
 
CompTIA IT Employment Tracker – October 2021
CompTIA IT Employment Tracker –  October 2021CompTIA IT Employment Tracker –  October 2021
CompTIA IT Employment Tracker – October 2021CompTIA
 
CompTIA IT Employment Tracker – September 2021
CompTIA IT Employment Tracker –  September 2021CompTIA IT Employment Tracker –  September 2021
CompTIA IT Employment Tracker – September 2021CompTIA
 
CompTIA IT Employment Tracker – July 2021
CompTIA IT Employment Tracker –  July 2021CompTIA IT Employment Tracker –  July 2021
CompTIA IT Employment Tracker – July 2021CompTIA
 
CompTIA IT Employment Tracker – June 2021
CompTIA IT Employment Tracker –  June 2021CompTIA IT Employment Tracker –  June 2021
CompTIA IT Employment Tracker – June 2021CompTIA
 
Trends in Automation 2021
Trends in Automation 2021Trends in Automation 2021
Trends in Automation 2021CompTIA
 
CompTIA IT Employment Tracker – May 2021
CompTIA IT Employment Tracker –  May 2021CompTIA IT Employment Tracker –  May 2021
CompTIA IT Employment Tracker – May 2021CompTIA
 
CompTIA IT Employment Tracker – April 2021
CompTIA IT Employment Tracker –  April 2021CompTIA IT Employment Tracker –  April 2021
CompTIA IT Employment Tracker – April 2021CompTIA
 
IT Operations and Emerging Technology
IT Operations and Emerging TechnologyIT Operations and Emerging Technology
IT Operations and Emerging TechnologyCompTIA
 
CompTIA IT Employment Tracker – March 2021
CompTIA IT Employment Tracker – March 2021CompTIA IT Employment Tracker – March 2021
CompTIA IT Employment Tracker – March 2021CompTIA
 
Help Desk Trends
Help Desk TrendsHelp Desk Trends
Help Desk TrendsCompTIA
 
CompTIA IT Employment Tracker – February 2021
CompTIA IT Employment Tracker –  February 2021CompTIA IT Employment Tracker –  February 2021
CompTIA IT Employment Tracker – February 2021CompTIA
 
CompTIA 2021 IT Industry Outlook
CompTIA 2021 IT Industry OutlookCompTIA 2021 IT Industry Outlook
CompTIA 2021 IT Industry OutlookCompTIA
 
CompTIA IT Employment Tracker - January 2021
CompTIA IT Employment Tracker - January 2021CompTIA IT Employment Tracker - January 2021
CompTIA IT Employment Tracker - January 2021CompTIA
 
CompTIA IT Employment Tracker – November 2020
CompTIA IT Employment Tracker –  November 2020CompTIA IT Employment Tracker –  November 2020
CompTIA IT Employment Tracker – November 2020CompTIA
 
CompTIA IT Employment Tracker – October 2020
CompTIA IT Employment Tracker – October 2020CompTIA IT Employment Tracker – October 2020
CompTIA IT Employment Tracker – October 2020CompTIA
 
CompTIA IT Employment Tracker – September 2020
CompTIA IT Employment Tracker –  September 2020CompTIA IT Employment Tracker –  September 2020
CompTIA IT Employment Tracker – September 2020CompTIA
 
CompTIA IT Employment Tracker – August 2020
CompTIA IT Employment Tracker –  August 2020CompTIA IT Employment Tracker –  August 2020
CompTIA IT Employment Tracker – August 2020CompTIA
 
CompTIA IT Employment Tracker – July 2020
CompTIA IT Employment Tracker –  July 2020CompTIA IT Employment Tracker –  July 2020
CompTIA IT Employment Tracker – July 2020CompTIA
 

Mehr von CompTIA (20)

CompTIA IT Employment Tracker – December 2021
CompTIA IT Employment Tracker –  December 2021CompTIA IT Employment Tracker –  December 2021
CompTIA IT Employment Tracker – December 2021
 
CompTIA IT Employment Tracker – November 2021
CompTIA IT Employment Tracker –  November 2021CompTIA IT Employment Tracker –  November 2021
CompTIA IT Employment Tracker – November 2021
 
CompTIA IT Employment Tracker – October 2021
CompTIA IT Employment Tracker –  October 2021CompTIA IT Employment Tracker –  October 2021
CompTIA IT Employment Tracker – October 2021
 
CompTIA IT Employment Tracker – September 2021
CompTIA IT Employment Tracker –  September 2021CompTIA IT Employment Tracker –  September 2021
CompTIA IT Employment Tracker – September 2021
 
CompTIA IT Employment Tracker – July 2021
CompTIA IT Employment Tracker –  July 2021CompTIA IT Employment Tracker –  July 2021
CompTIA IT Employment Tracker – July 2021
 
CompTIA IT Employment Tracker – June 2021
CompTIA IT Employment Tracker –  June 2021CompTIA IT Employment Tracker –  June 2021
CompTIA IT Employment Tracker – June 2021
 
Trends in Automation 2021
Trends in Automation 2021Trends in Automation 2021
Trends in Automation 2021
 
CompTIA IT Employment Tracker – May 2021
CompTIA IT Employment Tracker –  May 2021CompTIA IT Employment Tracker –  May 2021
CompTIA IT Employment Tracker – May 2021
 
CompTIA IT Employment Tracker – April 2021
CompTIA IT Employment Tracker –  April 2021CompTIA IT Employment Tracker –  April 2021
CompTIA IT Employment Tracker – April 2021
 
IT Operations and Emerging Technology
IT Operations and Emerging TechnologyIT Operations and Emerging Technology
IT Operations and Emerging Technology
 
CompTIA IT Employment Tracker – March 2021
CompTIA IT Employment Tracker – March 2021CompTIA IT Employment Tracker – March 2021
CompTIA IT Employment Tracker – March 2021
 
Help Desk Trends
Help Desk TrendsHelp Desk Trends
Help Desk Trends
 
CompTIA IT Employment Tracker – February 2021
CompTIA IT Employment Tracker –  February 2021CompTIA IT Employment Tracker –  February 2021
CompTIA IT Employment Tracker – February 2021
 
CompTIA 2021 IT Industry Outlook
CompTIA 2021 IT Industry OutlookCompTIA 2021 IT Industry Outlook
CompTIA 2021 IT Industry Outlook
 
CompTIA IT Employment Tracker - January 2021
CompTIA IT Employment Tracker - January 2021CompTIA IT Employment Tracker - January 2021
CompTIA IT Employment Tracker - January 2021
 
CompTIA IT Employment Tracker – November 2020
CompTIA IT Employment Tracker –  November 2020CompTIA IT Employment Tracker –  November 2020
CompTIA IT Employment Tracker – November 2020
 
CompTIA IT Employment Tracker – October 2020
CompTIA IT Employment Tracker – October 2020CompTIA IT Employment Tracker – October 2020
CompTIA IT Employment Tracker – October 2020
 
CompTIA IT Employment Tracker – September 2020
CompTIA IT Employment Tracker –  September 2020CompTIA IT Employment Tracker –  September 2020
CompTIA IT Employment Tracker – September 2020
 
CompTIA IT Employment Tracker – August 2020
CompTIA IT Employment Tracker –  August 2020CompTIA IT Employment Tracker –  August 2020
CompTIA IT Employment Tracker – August 2020
 
CompTIA IT Employment Tracker – July 2020
CompTIA IT Employment Tracker –  July 2020CompTIA IT Employment Tracker –  July 2020
CompTIA IT Employment Tracker – July 2020
 

Kürzlich hochgeladen

08448380779 Call Girls In Friends Colony Women Seeking Men
08448380779 Call Girls In Friends Colony Women Seeking Men08448380779 Call Girls In Friends Colony Women Seeking Men
08448380779 Call Girls In Friends Colony Women Seeking MenDelhi Call girls
 
EIS-Webinar-Prompt-Knowledge-Eng-2024-04-08.pptx
EIS-Webinar-Prompt-Knowledge-Eng-2024-04-08.pptxEIS-Webinar-Prompt-Knowledge-Eng-2024-04-08.pptx
EIS-Webinar-Prompt-Knowledge-Eng-2024-04-08.pptxEarley Information Science
 
presentation ICT roal in 21st century education
presentation ICT roal in 21st century educationpresentation ICT roal in 21st century education
presentation ICT roal in 21st century educationjfdjdjcjdnsjd
 
Automating Google Workspace (GWS) & more with Apps Script
Automating Google Workspace (GWS) & more with Apps ScriptAutomating Google Workspace (GWS) & more with Apps Script
Automating Google Workspace (GWS) & more with Apps Scriptwesley chun
 
🐬 The future of MySQL is Postgres 🐘
🐬  The future of MySQL is Postgres   🐘🐬  The future of MySQL is Postgres   🐘
🐬 The future of MySQL is Postgres 🐘RTylerCroy
 
Artificial Intelligence: Facts and Myths
Artificial Intelligence: Facts and MythsArtificial Intelligence: Facts and Myths
Artificial Intelligence: Facts and MythsJoaquim Jorge
 
Powerful Google developer tools for immediate impact! (2023-24 C)
Powerful Google developer tools for immediate impact! (2023-24 C)Powerful Google developer tools for immediate impact! (2023-24 C)
Powerful Google developer tools for immediate impact! (2023-24 C)wesley chun
 
Axa Assurance Maroc - Insurer Innovation Award 2024
Axa Assurance Maroc - Insurer Innovation Award 2024Axa Assurance Maroc - Insurer Innovation Award 2024
Axa Assurance Maroc - Insurer Innovation Award 2024The Digital Insurer
 
Boost Fertility New Invention Ups Success Rates.pdf
Boost Fertility New Invention Ups Success Rates.pdfBoost Fertility New Invention Ups Success Rates.pdf
Boost Fertility New Invention Ups Success Rates.pdfsudhanshuwaghmare1
 
Handwritten Text Recognition for manuscripts and early printed texts
Handwritten Text Recognition for manuscripts and early printed textsHandwritten Text Recognition for manuscripts and early printed texts
Handwritten Text Recognition for manuscripts and early printed textsMaria Levchenko
 
08448380779 Call Girls In Civil Lines Women Seeking Men
08448380779 Call Girls In Civil Lines Women Seeking Men08448380779 Call Girls In Civil Lines Women Seeking Men
08448380779 Call Girls In Civil Lines Women Seeking MenDelhi Call girls
 
Evaluating the top large language models.pdf
Evaluating the top large language models.pdfEvaluating the top large language models.pdf
Evaluating the top large language models.pdfChristopherTHyatt
 
Scaling API-first – The story of a global engineering organization
Scaling API-first – The story of a global engineering organizationScaling API-first – The story of a global engineering organization
Scaling API-first – The story of a global engineering organizationRadu Cotescu
 
A Domino Admins Adventures (Engage 2024)
A Domino Admins Adventures (Engage 2024)A Domino Admins Adventures (Engage 2024)
A Domino Admins Adventures (Engage 2024)Gabriella Davis
 
Driving Behavioral Change for Information Management through Data-Driven Gree...
Driving Behavioral Change for Information Management through Data-Driven Gree...Driving Behavioral Change for Information Management through Data-Driven Gree...
Driving Behavioral Change for Information Management through Data-Driven Gree...Enterprise Knowledge
 
IAC 2024 - IA Fast Track to Search Focused AI Solutions
IAC 2024 - IA Fast Track to Search Focused AI SolutionsIAC 2024 - IA Fast Track to Search Focused AI Solutions
IAC 2024 - IA Fast Track to Search Focused AI SolutionsEnterprise Knowledge
 
Boost PC performance: How more available memory can improve productivity
Boost PC performance: How more available memory can improve productivityBoost PC performance: How more available memory can improve productivity
Boost PC performance: How more available memory can improve productivityPrincipled Technologies
 
Apidays Singapore 2024 - Building Digital Trust in a Digital Economy by Veron...
Apidays Singapore 2024 - Building Digital Trust in a Digital Economy by Veron...Apidays Singapore 2024 - Building Digital Trust in a Digital Economy by Veron...
Apidays Singapore 2024 - Building Digital Trust in a Digital Economy by Veron...apidays
 
Exploring the Future Potential of AI-Enabled Smartphone Processors
Exploring the Future Potential of AI-Enabled Smartphone ProcessorsExploring the Future Potential of AI-Enabled Smartphone Processors
Exploring the Future Potential of AI-Enabled Smartphone Processorsdebabhi2
 
The 7 Things I Know About Cyber Security After 25 Years | April 2024
The 7 Things I Know About Cyber Security After 25 Years | April 2024The 7 Things I Know About Cyber Security After 25 Years | April 2024
The 7 Things I Know About Cyber Security After 25 Years | April 2024Rafal Los
 

Kürzlich hochgeladen (20)

08448380779 Call Girls In Friends Colony Women Seeking Men
08448380779 Call Girls In Friends Colony Women Seeking Men08448380779 Call Girls In Friends Colony Women Seeking Men
08448380779 Call Girls In Friends Colony Women Seeking Men
 
EIS-Webinar-Prompt-Knowledge-Eng-2024-04-08.pptx
EIS-Webinar-Prompt-Knowledge-Eng-2024-04-08.pptxEIS-Webinar-Prompt-Knowledge-Eng-2024-04-08.pptx
EIS-Webinar-Prompt-Knowledge-Eng-2024-04-08.pptx
 
presentation ICT roal in 21st century education
presentation ICT roal in 21st century educationpresentation ICT roal in 21st century education
presentation ICT roal in 21st century education
 
Automating Google Workspace (GWS) & more with Apps Script
Automating Google Workspace (GWS) & more with Apps ScriptAutomating Google Workspace (GWS) & more with Apps Script
Automating Google Workspace (GWS) & more with Apps Script
 
🐬 The future of MySQL is Postgres 🐘
🐬  The future of MySQL is Postgres   🐘🐬  The future of MySQL is Postgres   🐘
🐬 The future of MySQL is Postgres 🐘
 
Artificial Intelligence: Facts and Myths
Artificial Intelligence: Facts and MythsArtificial Intelligence: Facts and Myths
Artificial Intelligence: Facts and Myths
 
Powerful Google developer tools for immediate impact! (2023-24 C)
Powerful Google developer tools for immediate impact! (2023-24 C)Powerful Google developer tools for immediate impact! (2023-24 C)
Powerful Google developer tools for immediate impact! (2023-24 C)
 
Axa Assurance Maroc - Insurer Innovation Award 2024
Axa Assurance Maroc - Insurer Innovation Award 2024Axa Assurance Maroc - Insurer Innovation Award 2024
Axa Assurance Maroc - Insurer Innovation Award 2024
 
Boost Fertility New Invention Ups Success Rates.pdf
Boost Fertility New Invention Ups Success Rates.pdfBoost Fertility New Invention Ups Success Rates.pdf
Boost Fertility New Invention Ups Success Rates.pdf
 
Handwritten Text Recognition for manuscripts and early printed texts
Handwritten Text Recognition for manuscripts and early printed textsHandwritten Text Recognition for manuscripts and early printed texts
Handwritten Text Recognition for manuscripts and early printed texts
 
08448380779 Call Girls In Civil Lines Women Seeking Men
08448380779 Call Girls In Civil Lines Women Seeking Men08448380779 Call Girls In Civil Lines Women Seeking Men
08448380779 Call Girls In Civil Lines Women Seeking Men
 
Evaluating the top large language models.pdf
Evaluating the top large language models.pdfEvaluating the top large language models.pdf
Evaluating the top large language models.pdf
 
Scaling API-first – The story of a global engineering organization
Scaling API-first – The story of a global engineering organizationScaling API-first – The story of a global engineering organization
Scaling API-first – The story of a global engineering organization
 
A Domino Admins Adventures (Engage 2024)
A Domino Admins Adventures (Engage 2024)A Domino Admins Adventures (Engage 2024)
A Domino Admins Adventures (Engage 2024)
 
Driving Behavioral Change for Information Management through Data-Driven Gree...
Driving Behavioral Change for Information Management through Data-Driven Gree...Driving Behavioral Change for Information Management through Data-Driven Gree...
Driving Behavioral Change for Information Management through Data-Driven Gree...
 
IAC 2024 - IA Fast Track to Search Focused AI Solutions
IAC 2024 - IA Fast Track to Search Focused AI SolutionsIAC 2024 - IA Fast Track to Search Focused AI Solutions
IAC 2024 - IA Fast Track to Search Focused AI Solutions
 
Boost PC performance: How more available memory can improve productivity
Boost PC performance: How more available memory can improve productivityBoost PC performance: How more available memory can improve productivity
Boost PC performance: How more available memory can improve productivity
 
Apidays Singapore 2024 - Building Digital Trust in a Digital Economy by Veron...
Apidays Singapore 2024 - Building Digital Trust in a Digital Economy by Veron...Apidays Singapore 2024 - Building Digital Trust in a Digital Economy by Veron...
Apidays Singapore 2024 - Building Digital Trust in a Digital Economy by Veron...
 
Exploring the Future Potential of AI-Enabled Smartphone Processors
Exploring the Future Potential of AI-Enabled Smartphone ProcessorsExploring the Future Potential of AI-Enabled Smartphone Processors
Exploring the Future Potential of AI-Enabled Smartphone Processors
 
The 7 Things I Know About Cyber Security After 25 Years | April 2024
The 7 Things I Know About Cyber Security After 25 Years | April 2024The 7 Things I Know About Cyber Security After 25 Years | April 2024
The 7 Things I Know About Cyber Security After 25 Years | April 2024
 

CompTIA Tech Trade Snapshot 2017

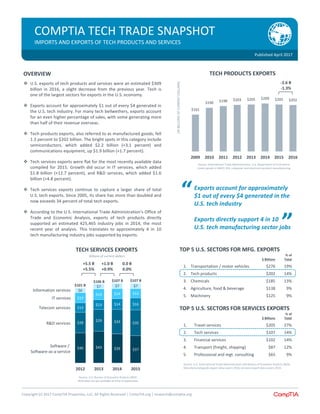
  • 1. Copyright (c) 2017 CompTIA Properties, LLC, All Rights Reserved | CompTIA.org | research@comptia.org $40 $43 $39 $37 $28 $29 $33 $35 $13 $13 $14 $16 $14 $14 $14 $13 $6 $7 $7 $7 2012 2013 2014 2015 TOP 5 U.S. SECTORS FOR MFG. EXPORTS $ Billions % of Total 1. Transportation / motor vehicles $276 19% 2. Tech products $202 14% 3. Chemicals $185 13% 4. Agriculture, food & beverage $138 9% 5. Machinery $125 9% TOP 5 U.S. SECTORS FOR SERVICES EXPORTS $ Billions % of Total 1. Travel services $205 27% 2. Tech services $107 14% 3. Financial services $102 14% 4. Transport (freight, shipping) $87 12% 5. Professional and mgt. consulting $65 9% $161 $190 $198 $203 $205 $209 $205 $202 2009 2010 2011 2012 2013 2014 2015 2016 -2.6 B -1.3% TECH PRODUCTS EXPORTS COMPTIA TECH TRADE SNAPSHOT IMPORTS AND EXPORTS OF TECH PRODUCTS AND SERVICES Published April 2017 (IN BILLIONS OF CURRENT DOLLARS) Source: International Trade Administration, U.S. Department of Commerce Covers goods in NAICS 334, computer and electronic product manufacturing OVERVIEW v U.S. exports of tech products and services were an estimated $309 billion in 2016, a slight decrease from the previous year. Tech is one of the largest sectors for exports in the U.S. economy. v Exports account for approximately $1 out of every $4 generated in the U.S. tech industry. For many tech bellwethers, exports account for an even higher percentage of sales, with some generating more than half of their revenue overseas. v Tech products exports, also referred to as manufactured goods, fell 1.3 percent to $202 billion. The bright spots in this category include semiconductors, which added $2.2 billion (+3.1 percent) and communications equipment, up $1.9 billion (+1.7 percent). v Tech services exports were flat for the most recently available data compiled for 2015. Growth did occur in IT services, which added $1.8 billion (+12.7 percent), and R&D services, which added $1.6 billion (+4.8 percent). v Tech services exports continue to capture a larger share of total U.S. tech exports. Since 2005, its share has more than doubled and now exceeds 34 percent of total tech exports. v According to the U.S. International Trade Administration’s Office of Trade and Economic Analysis, exports of tech products directly supported an estimated 425,465 industry jobs in 2014, the most recent year of analysis. This translates to approximately 4 in 10 tech manufacturing industry jobs supported by exports. TECH SERVICES EXPORTS +5.5 B +5.5% Software / Software-as-a-service R&D services Information services Telecom services IT services $106 B $107 B Source: U.S. Bureau of Economic Analysis (BEA) 2016 data not yet available at time of publication $101 B +1.0 B +0.9% Billions of current dollars $107 B 0.0 B 0.0% Exports account for approximately $1 out of every $4 generated in the U.S. tech industry Exports directly support 4 in 10 U.S. tech manufacturing sector jobs “ ” Source: U.S. International Trade Administration and Bureau of Economic Analysis (BEA) Manufactured goods export data covers 2016; services export data covers 2015
  • 2. Copyright (c) 2017 CompTIA Properties, LLC, All Rights Reserved | CompTIA.org | research@comptia.org STATE AND TRADING PARTNER SUMMARY v Fourteen states experienced positive growth of tech products (manufactured goods) exports in 2016. The states with the largest percent change growth year-over- year include: Mississippi (+18.7%), West Virginia (+18.7%), Idaho (+14.6%), Rhode Island (+12.2%), and Oregon (+11.8%). On a dollar value basis, Texas generated the most new export-driven revenue at $1.9 billion. v The strong U.S. dollar has been a contributing factor to sluggish export growth (see Appendix for more detail). v Among metro areas, San Jose exports the greatest volume of tech products at $14.4 billion. Los Angeles, El Paso, New York City, and Portland round out the top five metro area tech product exporters (see Appendix for data covering the top 20 metro areas). v The leading markets for U.S. tech products exports remained largely unchanged from the previous year. The top ten markets account for 68 percent of total tech goods exports. The top ten countries for tech products imports into the U.S. account for 89 percent of all imports in this category. LEADING TRADING PARTNERS FOR TECH PRODUCTS, 2016 U.S. TECH PRODUCTS EXPORTS BY STATE billions of current dollars / tech mfg. goods Source: International Trade Administration, U.S. Department of Commerce Rank State 2015 2016 % change 1. Texas $45.3 $47.2 4.1% 2. California $43.2 $42.4 -1.9% 3. Florida $12.0 $12.0 0.2% 4. Oregon $9.0 $10.0 11.8% 5. Illinois $8.0 $7.7 -3.9% 6. Massachusetts $7.3 $7.0 -4.9% 7. New York $6.9 $6.3 -8.6% 8. Arizona $5.6 $5.6 0.9% 9. Tennessee $5.4 $5.3 -1.7% 10. New Jersey $4.2 $4.2 -0.2% 11. Washington $3.8 $3.8 0.2% 12. Pennsylvania $4.2 $3.5 -17.5% 13. Minnesota $3.5 $3.4 -5.1% 14. Michigan $3.0 $3.1 2.6% 15. Wisconsin $3.2 $2.9 -11.7% 16. Ohio $2.8 $2.6 -7.5% 17. North Carolina $2.8 $2.4 -13.9% 18. Georgia $2.3 $2.4 6.4% 19. Idaho $2.0 $2.2 14.6% 20. Virginia $2.3 $2.2 -3.4% 21. New Mexico $2.4 $2.1 -11.1% 22. Colorado $1.9 $1.9 -1.9% 23. Vermont $2.1 $1.9 -8.7% 24. Utah $2.1 $1.7 -19.0% 25. Nevada $1.5 $1.6 8.0% 26. Kentucky $1.8 $1.6 -8.6% 27. Maryland $1.6 $1.6 -4.3% 28. Indiana $1.4 $1.6 8.5% 29. New Hampshire $1.5 $1.3 -15.8% 30. South Carolina $1.2 $1.2 2.3% 31. Connecticut $1.2 $1.1 -6.9% 32. Mississippi $0.7 $0.9 18.7% 33. Oklahoma $0.7 $0.7 -0.7% 34. Kansas $0.7 $0.7 -9.0% 35. Missouri $0.7 $0.6 -7.0% 36. Iowa $0.6 $0.6 -0.7% 37. Alabama $0.6 $0.6 -4.5% 38. Delaware $0.7 $0.5 -24.4% 39. Maine $0.4 $0.3 -13.9% 40. Arkansas $0.5 $0.3 -44.8% 41. Nebraska $0.2 $0.2 -15.9% 42. Louisiana $0.2 $0.2 -24.1% 43. Rhode Island $0.1 $0.2 12.2% 44. West Virginia $0.10 $0.12 18.7% 45. South Dakota $0.12 $0.09 -22.2% 46. North Dakota $0.05 $0.05 -1.6% 47. District of Columbia $0.06 $0.04 -21.9% 48. Hawaii $0.04 $0.04 -9.1% 49. Montana $0.05 $0.03 -34.7% 50. Alaska $0.04 $0.02 -40.5% 51. Wyoming $0.02 $0.01 -32.5% Exports from U.S. Imports to U.S. 1. Mexico 1. China 2. Canada 2. Mexico 3. China 3. Malaysia 4. Hong Kong 4. South Korea 5. Japan 5. Japan 6. Germany 6. Taiwan 7. Malaysia 7. Thailand 8. Netherlands 8. Viet Nam 9. South Korea 9. Germany 10. Taiwan 10. Canada Exports from U.S. Imports to U.S. 1. United Kingdom 1. India 2. Brazil 2. Canada 3. Canada 3. United Kingdom 4. Switzerland 4. Ireland 5. Argentina 5. Philippines 6. Japan 6. Mexico 7. Germany 7. China 8. Australia 8. Germany 9. India 9. Netherlands 10. Mexico 10. Switzerland LEADING TRADING PARTNERS FOR TECH SERVICES*, 2015 The tech services covered in this data include IT services, telecom services, and information services. Software services, R&D services, certain data hosting services, engineering services, certain repair services, and distribution services are not included due to limitations in the way the BEA aggregates trade data.
  • 3. Copyright (c) 2017 CompTIA Properties, LLC, All Rights Reserved | CompTIA.org | research@comptia.org TRADE SUPPORTED JOBS SUMMARY v According to the U.S. International Trade Administration’s Office of Trade and Economic Analysis, exports of goods and services from the U.S. support an estimated 11.5 million jobs in 2015, the most recent year of analysis. The methodology used to develop these estimates includes jobs directly and indirectly supported by exports. v Goods exports consisting of manufactured products, agricultural products, and natural resources supported 6.7 million jobs. The export of services accounted for the remaining 4.8 million jobs supported. Since 2009, the estimated number of jobs supported by the export of goods has grown by 900,000. For more detail, see http://trade.gov/mas/ian/employment/index.asp. v Specific to technology, the Office of Trade and Economic Analysis reports exports tech manufactured goods supported an estimated 425,465 industry jobs in 2014, the most recent year of analysis. Nationally, this translates to approximately 4 in 10 jobs in the tech manufacturing industry support by exports. v The Office of Trade and Economic Analysis does not provide state-level export-supported employment figures. One approach for converting national-level data to state- level data is to apportion the data according to the level of exports. The assumption is there is a relationship between the volume of exports and the size of the workforce needed to support producing and delivering those products to international customers. There are limitations to this approach given that tech manufacturers in some states are assembling products from components supplied from other states, which presents challenges in where to allocate the jobs. This is typically signified by having a very high level of tech products exports relative to the size of the state’s tech manufacturing workforce. This is the case in states such as Tennessee, Vermont and Texas. Adjustments were made to the workforce estimates in these cases. v Jobs supported by tech services, including software, exports are embedded in the top level categories covering information and professional and business services, so there is not an established baseline for tech services jobs supported by exports. The Office of Trade and Economic Analysis estimates 12 percent of overall jobs in these categories are supported by exports. Assuming this 12 percent rate roughly holds for the tech services sectors, upwards of potentially several hundred thousand jobs are supported by exports in the tech services sector. v Note regarding use of data from The Office of Trade and Economic Analysis: ”given the data used to estimate jobs supported by state-level exports, care should be taken in the interpretation of the results. The figures presented should best be thought of as representing the number of jobs supported by the exports from a state as opposed to the number of jobs supported by exports within a state.” Source: estimates made by CompTIA using data from the Office of Trade and Economic Analysis covering the 2014 time period TECH MFG INDUSTRY JOBS SUPPORTED BY EXPORTS State Total Tech Mfg. Workforce Est. Industry Jobs Supported by Exports % of Total Alabama 9,005 1,452 16% Alaska 106 66 62% Arizona 34,742 11,070 32% Arkansas 2,481 708 29% California 261,608 95,216 36% Colorado 21,481 4,449 21% Connecticut 12,545 2,822 22% Delaware 2,834 2,162 76% District of Columbia 42 35 83% Florida 40,656 31,212 77% Georgia 10,343 5,119 49% Hawaii 186 117 63% Idaho 11,551 5,022 43% Illinois 31,649 16,281 51% Indiana 15,299 4,109 27% Iowa 12,602 1,291 10% Kansas 5,217 1,639 31% Kentucky 5,240 4,354 83% Louisiana 2,430 656 27% Maine 2,295 579 25% Maryland 17,725 3,641 21% Massachusetts 56,605 18,138 32% Michigan 18,111 7,095 39% Minnesota 45,119 8,436 19% Mississippi 2,201 1,829 83% Missouri 9,709 1,264 13% Montana 579 98 17% Nebraska 4,400 543 12% Nevada 2,811 2,336 83% New Hampshire 14,438 3,934 27% New Jersey 23,022 10,172 44% New Mexico 6,254 4,629 74% New York 56,537 15,318 27% North Carolina 32,126 7,092 22% North Dakota 1,416 110 8% Ohio 19,387 6,028 31% Oklahoma 4,802 1,830 38% Oregon 36,448 18,113 50% Pennsylvania 31,229 8,444 27% Rhode Island 3,302 330 10% South Carolina 6,380 2,804 44% South Dakota 2,239 309 14% Tennessee 5,056 4,202 83% Texas 95,802 79,612 83% Utah 12,935 5,228 40% Vermont 5,430 4,512 83% Virginia 11,302 5,558 49% Washington 19,908 8,719 44% West Virginia 1,207 269 22% Wisconsin 18,371 6,468 35% Wyoming 287 42 15%
  • 4. Copyright (c) 2017 CompTIA Properties, LLC, All Rights Reserved | CompTIA.org | research@comptia.org 0.0 10.0 20.0 30.0 40.0 50.0 60.0 70.0 80.0 1996 est 1997 est 1998 est 1999 est 2000 est 2001 est 2002 est 2003 est 2004 est 2005 est 2006 2007 2008 2009 2010 2011 2012 2013 2014 2015 2016 est $ billions | current dollars Imports Exports SUMMARY OF TECH PRODUCTS & SERVICES TRADE BETWEEN THE UNITED STATES AND CANADA/MEXICO U.S. Exports of Tech Products to: 1996 est 1997 est 1998 est 1999 est 2000 est 2001 est 2002 2003 2004 2005 2006 2007 2008 2009 2010 2011 2012 2013 2014 2015 2016 Canada 19.3 21.8 22.1 22.9 27.0 22.4 19.9 20.3 23.0 25.0 25.1 25.5 25.3 21.2 25.6 27.8 28.7 28.0 27.8 25.3 24.2 Mexico 10.7 14.9 14.9 17.6 24.6 24.9 21.6 21.7 24.5 23.4 25.4 23.0 24.6 25.0 33.0 35.2 36.6 38.6 40.5 43.2 42.9 TOTAL 30.0 36.7 37.0 40.5 51.6 47.3 41.5 42.0 47.5 48.4 50.5 48.5 49.9 46.2 58.6 63.0 65.3 66.6 68.3 68.5 67.1 U.S. Exports of Tech Services to: 1996 est 1997 est 1998 est 1999 est 2000 est 2001 est 2002 est 2003 est 2004 est 2005 est 2006 2007 2008 2009 2010 2011 2012 2013 2014 2015 2016 est Canada 1.4 1.5 1.6 1.7 2.1 2.2 2.4 2.8 3.0 3.6 4.7 4.4 4.5 4.5 5.5 6.2 6.1 6.2 6.2 5.9 NA Mexico 0.5 0.6 0.6 0.6 0.7 0.9 0.9 0.8 0.8 1.0 1.2 1.2 1.3 1.2 1.6 1.8 1.9 2.0 2.0 2.0 NA TOTAL 1.9 2.1 2.2 2.3 2.8 3.1 3.3 3.6 3.8 4.6 5.9 5.6 5.8 5.7 7.1 8.0 8.0 8.2 8.2 7.9 NA SUMMARY OF TRADE WITH CANADA AND MEXICO v Total exports of tech products (manufactured goods) and tech services from the U.S. to Canada and Mexico reached an estimated $74.8 billion in 2016. v Among all trading partners in tech products, the U.S. runs the largest surplus with Canada. U.S. exports exceeded imports by $17.7 billion in 2016. The categories where the U.S. experienced the largest surpluses were computers and peripherals (+$7.4 billion) and communications equipment (+$3.3 billion). v Trade of tech services is nearly in balance between the U.S. and Canada ($5.9 billion vs. $6.1 billion). In the notable categories, the U.S. ran a surplus of $2.2 billion in software, and a deficit of -$1.8 billion in IT services in 2015, the most recent year of available data. v U.S. International Trade Administration data indicates the U.S. runs a trade deficit with Mexico in tech products (manufactured goods), while running a surplus in tech services. In 2016, tech products imports from Mexico exceeded exports by $15.5 billion. It should be noted, the U.S. did have a $7.9 billion surplus in exports of semiconductors. Semiconductor exports to Mexico increased 6.0 percent year-over-year. v Because U.S. International Trade Administration data reflects the total wholesale value of product, situations do occur whereby a country may assemble a product comprised of components produced elsewhere, but get credit for the full value of the export. Semiconductors are an example of a primary component in the global supply chain for many products – from computers to cars, that may be assembled and then re-exported. Source: International Trade Administration, U.S. Department of Commerce | CompTIA estimates
  • 5. Copyright (c) 2017 CompTIA Properties, LLC, All Rights Reserved | CompTIA.org | research@comptia.org 0.0 2.0 4.0 6.0 8.0 10.0 12.0 2002 2003 2004 2005 2006 2007 2008 2009 2010 2011 2012 2013 2014 2015 2016 $ billions | current dollars Optical media Audio / video Computer products Communications equipment Semiconductors Navigational, measuring, medical tech EXPORTS OF TECH PRODUCTS FROM THE U.S. TO JAPAN SUMMARY OF TRADE WITH JAPAN v U.S. exports of tech products (manufactured goods) and tech services to Japan were an estimated $14.7 billion in 2016, an increase of approximately 2.3 percent year-over-year. v Tech products accounted for 56 percent of exports to Japan, with tech services accounting for the remainder. In the Asia and Pacific region, Japan is the largest market for U.S. tech services. v Imports from Japan were an estimated $17.1 billion in 2016, down approximately 2.5 percent from the previous year. Tech imports from Japan are dominated by manufactured goods, which account for 90 percent of the total. v Exports to Japan experienced the strongest gains in communications equipment (up 34 percent or +$349 million) and computer products (up 14 percent or +$130 million). Conversely, semiconductors saw the largest drop at -13.2 percent or -$249 million. v Exports of IT services to Japan improved $149 million, an impressive gain of nearly 24 percent. v Despite the 27.6 percent drop in 2015, software remains the largest component of tech services exports to Japan. U.S. Exports of Tech Products to: 2002 2003 2004 2005 2006 2007 2008 2009 2010 2011 2012 2013 2014 2015 2016 Japan 10.9 10.2 10.5 9.9 10.6 9.6 8.8 7.2 7.7 8.2 9.3 8.6 8.6 8.0 8.3 U.S. Exports of Tech Services to: 2002 2003 2004 2005 2006 2007 2008 2009 2010 2011 2012 2013 2014 2015 2016 est Japan NA NA NA NA 6.1 4.2 5.2 6.1 8.2 8.3 8.4 8.3 7.7 6.4 NA Source: International Trade Administration, U.S. Department of Commerce | CompTIA estimates
  • 6. Copyright (c) 2017 CompTIA Properties, LLC, All Rights Reserved | CompTIA.org | research@comptia.org Source: International Trade Administration, U.S. Department of Commerce, 2015 data APPENDIX v The already strong U.S. dollar ended 2016 with another gain against a basket of major currencies. This put the dollar at a 14-year high, marking a 42 percent increase since its most recent low point of 2011. A strong dollar provides greater purchasing power, making international travel or imports relatively cheaper. The tradeoff, though, U.S. exports become more expensive to many overseas buyers. v Tech product imports (tech manufactured goods) into the U.S. totaled $373 billion in 2016, down slightly (-0.8%) from 2015. In the aggregate, the U.S. runs a deficit in tech products trade. The deficit is largest for communications equipment, followed by computing equipment. As noted previously, the manner in which trade data is compiled can result in situations that overstate the economic value of exports/imports. v The U.S. runs a surplus in tech services trade, which totaled +$32 billion in 2015, the most recent year of available tech services data. v There is likely some degree of undercounting of tech products and services exports. This stems from the ongoing blurring of lines between constitutes tech, as well as how tech is categorized by government data sources. For example, an automobile company exporting its own autonomous vehicle technology or a financial services firm providing big data services abroad, would not be included in the tech products and services export figures. Rather, they would be captured within the motor vehicles and financial services export categories. v For additional data and detail on manufactured product exports, see http://tse.export.gov/tse/tsehome.aspx. v For additional data and detail on manufactured product exports, see https://www.bea.gov/iTable/index_ita.cfm. U.S. TECH PRODUCTS EXPORTS BY METRO AREA billions of current dollars / tech mfg. goods Metropolitan Statistical Area (MSA) 2015 YoY % change San Jose-Sunnyvale-Santa Clara, CA $14.4 -6.3% Los Angeles-Long Beach-Anaheim, CA $12.7 -31.4% El Paso, TX $12.6 68.7% New York-Newark-Jersey City, NY-NJ-PA $9.5 7.7% Portland-Vancouver-Hillsboro, OR-WA $8.6 9.8% Miami-Fort Lauderdale-West Palm Beach, FL $8.6 -13.7% Boston-Cambridge-Newton, MA-NH $7.4 -17.3% Houston-The Woodlands-Sugar Land, TX $6.9 -4.4% Dallas-Fort Worth-Arlington, TX $6.8 1.6% Chicago-Naperville-Elgin, IL-IN-WI $6.7 4.9% Austin-Round Rock, TX $5.8 8.9% San Francisco-Oakland-Hayward, CA $5.6 -5.9% Phoenix-Mesa-Scottsdale, AZ $4.1 9.2% Minneapolis-St. Paul-Bloomington, MN-WI $3.3 -2.5% Seattle-Tacoma-Bellevue, WA $3.2 -5.2% San Diego-Carlsbad, CA $2.9 -3.9% El Centro, CA $2.9 42.2% Detroit-Warren-Dearborn, MI $2.9 -13.0% Washington-Arlington-Alexandria, DC-VA-MD-WV $2.8 16.1% Memphis, TN-MS-AR $2.4 -1.4% Atlanta-Sandy Springs-Roswell, GA $2.3 -2.2% Philadelphia-Camden-Wilmington, PA-NJ-DE-MD $2.2 -23.0% Nashville-Davidson-Murfreesboro-Franklin, TN $2.2 -0.1% Milwaukee-Waukesha-West Allis, WI $2.0 -6.9% Boise City-Nampa, ID $1.9 -14.0% McAllen-Edinburg-Mission, TX $1.7 -9.5% Laredo, TX $1.6 42.6% Burlington-South Burlington, VT $1.5 NA Rochester, NY $1.5 -0.4% Tampa-St. Petersburg-Clearwater, FL $1.5 -28.8% Riverside-San Bernardino-Ontario, CA $1.5 -7.1% Provo-Orem, UT $1.2 -13.4% Albuquerque, NM $1.2 26.4% Louisville/Jefferson County, KY-IN $1.1 -14.3% San Antonio-New Braunfels, TX $1.1 18.4% Reno-Sparks, NV $1.1 -8.2% Baltimore-Columbia-Towson, MD $1.1 -7.5% Cincinnati-Middletown, OH-KY-IN $0.9 9.3% St. Louis, MO-IL $0.9 16.4% Kansas City, MO-KS $0.9 4.3% Salt Lake City, UT $0.8 -1.6% Pittsburgh, PA $0.8 -0.7% Raleigh-Cary, NC $0.8 -9.0% Harrisburg-Carlisle, PA $0.7 NA Manchester-Nashua, NH $0.7 NA Brownsville-Harlingen, TX $0.7 -14.9% Oxnard-Thousand Oaks-Ventura, CA $0.7 -4.3% ABOUT COMPTIA The Computing Technology Industry Association (CompTIA) is the world's leading not-for-profit technology association. With approximately 2,000 member companies, 3,000 academic and training partners, over 100,000 registered users and more than 2 million IT certifications issued, CompTIA is dedicated to serving the tech industry and tech workforce through education and training programs, market intelligence, social innovation, and more. CompTIA advocates for trade policies that expand export destinations and open new markets for the U.S. technology sector. For more details on CompTIA’s trade work, visit https://www.comptia.org/advocacy/policy-issues/global- trade-and-market-access.