Q3 2017 | Austin Office | Research & Forecast Report
•
1 gefällt mir•137 views

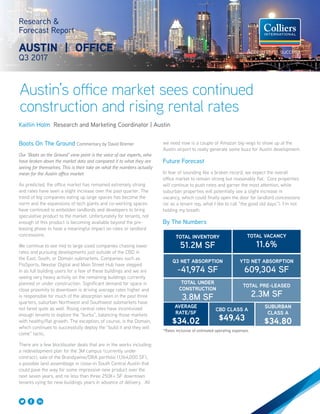
Austin’s office market sees continued construction and rising rental rates www.colliers.com/texas/austinoffice

Empfohlen
Empfohlen
Weitere ähnliche Inhalte
Was ist angesagt?
Was ist angesagt? (20)
Ähnlich wie Q3 2017 | Austin Office | Research & Forecast Report
Ähnlich wie Q3 2017 | Austin Office | Research & Forecast Report (20)
Mehr von Colliers International | Houston
Mehr von Colliers International | Houston (20)
Kürzlich hochgeladen
Kürzlich hochgeladen (20)
Q3 2017 | Austin Office | Research & Forecast Report
- 1. Research & Forecast Report AUSTIN | OFFICE Q3 2017 Kaitlin Holm Research and Marketing Coordinator | Austin TOTAL INVENTORY 51.2M SF TOTAL VACANCY 11.6% Q3 NET ABSORPTION -41,974 SF YTD NET ABSORPTION 609,304 SF TOTAL UNDER CONSTRUCTION 3.8M SF TOTAL PRE-LEASED 2.3M SF CBD CLASS A $49.43 SUBURBAN CLASS A $34.80 AVERAGE RATE/SF $34.02 *Rates inclusive of estimated operating expenses. Boots On The Ground Commentary by David Bremer Our “Boots on the Ground” view point is the voice of our experts, who have broken down the market data and compared it to what they are seeing for themselves. This is their take on what the numbers actually mean for the Austin office market. As predicted, the office market has remained extremely strong and rates have seen a slight increase over the past quarter. The trend of big companies eating up large spaces has become the norm and the expansions of tech giants and co-working spaces have continued to embolden landlords and developers to bring speculative product to the market. Unfortunately for tenants, not enough of this product is becoming available beyond the pre- leasing phase to have a meaningful impact on rates or landlord concessions. We continue to see mid to large sized companies chasing lower rates and pursuing developments just outside of the CBD in the East, South, or Domain submarkets. Companies such as FloSports, Nexstar Digital and Main Street Hub have stepped in as full building users for a few of these buildings and we are seeing very heavy activity on the remaining buildings currently planned or under construction. Significant demand for space in close proximity to downtown is driving average rates higher and is responsible for much of the absorption seen in the past three quarters, suburban Northwest and Southwest submarkets have not fared quite as well. Rising central rates have incentivized enough tenants to explore the “burbs”, balancing those markets with healthy/flat growth. The exception, of course, is the Domain, which continues to successfully deploy the “build it and they will come” tactic. There are a few blockbuster deals that are in the works including: a redevelopment plan for the 3M campus (currently under contract), sale of the Brandywine/DRA portfolio (1,164,000 SF), a possible land assemblage in close-in South Central Austin that could pave the way for some impressive new product over the next seven years, and no less than three 250K+ SF downtown tenants vying for new buildings years in advance of delivery. All Austin’s office market sees continued construction and rising rental rates we need now is a couple of Amazon big-wigs to show up at the Austin airport to really generate some buzz for Austin development. Future Forecast In fear of sounding like a broken record, we expect the overall office market to remain strong but reasonably flat. Core properties will continue to push rates and garner the most attention, while suburban properties will potentially see a slight increase in vacancy, which could finally open the door for landlord concessions (or as a tenant rep, what I like to call “the good old days”). I’m not holding my breath. By The Numbers
- 2. 2 Austin Office Overview In the third quarter of 2017, Austin’s office market saw 41,974 SF of negative net absorption. This sets the year-to-date absorption at 609,304 SF of positive net absorption. A majority of the positive absorption happened in class B buildings with a total of 154,351 SF of positive net absorption. Class A buildings in Austin saw 74,003 SF of negative net absorption and class C properties saw 122,322 SF of negative net absorption. There is currently 3,801,853 SF of office space under construction and 2,305,799 SF, or 60.6%, of that is pre-leased. The fourth quarter of 2017 is expected to see 1,223,152 SF of deliveries and 601,577 SF, or 49.2%, of that is pre-leased. Building 1 at 7601 Southwest Parkway was the only building that delivered in the third quarter. The 87,500 SF building was 33.4% pre-leased when it delivered in July. As of now, the fourth quarter is expected to see twenty two new buildings deliver, but some projects may get pushed into the new year. The citywide average rental rate decreased marginally over the quarter from $34.03 per SF in Q2 2017 to $34.02 per SF in Q2 2017. Class A rental rates in Austin’s CBD decreased by 0.8% over the quarter to $49.43 per SF from $49.84 per SF in the second quarter of 2017. Overall suburban Class A rental rates increased, from $33.57 per SF to $34.80, over the quarter. In July, the Austin-Round Rock, TX MSA was ranked #9 on WalletHub’s “2017’s Most & Least Educated Cities in America”, which ranks MSAs across country based on where the most educated Americans are putting their degrees to work. Austin was the highest ranked in Texas and also beat out other major tech cities such as Seattle-Tacoma-Bellevue, WA (#11), Raleigh, NC (#15), and San Diego-Carlsbad, CA (#21). When recruiting the top talent with the best education, it helps to have the #8 ranked Public University in America in your city. The University of Texas - Austin was ranked #8 out of over 500 public and state colleges by Niche and has been providing the city of Austin with highly educated employees who strengthen the Austin area economy. Vacancy & Availability Austin’s citywide vacancy rate stayed the same over the past two quarters remaining at 11.6%. The CBD class A vacancy rate increased from 9.3% in Q2 to 11.0% in Q3. The suburban class A vacancy rate dropped quarter over quarter from 12.2% to 11.8%. Overall suburban vacancy decreased quarter over quarter from 12.2% in Q2 to 11.8% in Q3. Submarkets that saw a decrease in vacancy over the quarter include Central, East, North/Domain, Northwest, Round Rock, South, and Southwest. The Round Rock submarket saw the largest decrease in vacancy, falling from 9.3% to 5.0% over the quarter. 2 Austin Research & Forecast Report | Q3 2017 | Office | Colliers International Market Indicators Relative to prior period Annual Change Quarterly Change Quarterly Forecast* VACANCY NET ABSORPTION NEW CONSTRUCTION UNDER CONSTRUCTION *Projected Summary Statistics Austin Office Market Q3 2016 Q2 2017 Q3 2017 Vacancy Rate 12.0% 11.6% 11.6% Net Absorption (Million Square Feet) .184 .229 -.189 New Construction (Million Square Feet) .353 .264 2.40 Under Construction (Million Square Feet) 1.151 1.584 3.80 Class A Vacancy Rate CBD Suburban 7.7% 13.1% 9.3% 12.2% 11.0% 11.8% Gross Asking Rents Per Square Foot Per Year Average $34.68 $34.03 $34.02 CBD Class A $49.62 $49.84 $49.43 Suburban Class A $35.53 $34.57 $34.80 0.0 5.0 10.0 15.0 20.0 25.0 -200,000 0 200,000 400,000 600,000 800,000 1,000,000 1,200,000 Net Absorption New Supply Vacancy ANNUAL ABSORPTION, NEW SUPPLY, AND VACANCY
- 3. $0.00 $5.00 $10.00 $15.00 $20.00 $25.00 $30.00 $35.00 $40.00 $45.00 $50.00 CBD Rents Suburban Rents 0.0% 2.0% 4.0% 6.0% 8.0% 10.0% 12.0% 14.0% 16.0% CBD Vacancy Suburban Vacancy 0.0% 2.0% 4.0% 6.0% 8.0% 10.0% 12.0% 14.0% 16.0% -200,000 0 200,000 400,000 600,000 800,000 1,000,000 1,200,000 Net Absorption New Supply Vacancy Absorption & Demand Austin’s office market posted 41,974 square feet of negative net absorption in Q3 2017. The three submarkets that experienced the largest positive net absorption gains over the quarter include Northwest, Central and Round Rock. A majority of the positive net absorption in the third quarter happened in the class A North/Domain submarket, totalling 96,755 square feet of positive net absorption. Some of this can be attributed to Social Solutions moving into their 25,231 square foot space at Braker Pointe III (10801 North MoPac Expressway). The second highest positive net absorption occurred in class B space in the Northwest submarket, with 66,183 square feet absorbed in the third quarter. The South submarket had the most tenants sign leases for spaces 10,000 square feet or larger. There were four leases signed in Q3 in the South submarket including Nexstar taking 17,900 square feet at Mirabeau at 2330 South Lamar Boulevard. The submarket with the most square feet leased in Q3 was the CBD with 283,695 square feet. The most notable is Facebook’s 231,506 square foot lease at Third and Shoal (208 Nueces Street). Third and Shoal is set to deliver in Q3 of 2018. Rental Rates According to CoStar, our data provider, Austin’s citywide average rental rate decreased marginally over the quarter from $34.03 per SF to $34.02 per SF. As expected, the highest rates across the Austin office market in the first quarter were in CBD class A buildings where rental rates averaged $49.43 per SF. Rental rates were also high in the Central submarket and West Central submarket where class A rental rates reached $43.96 per SF and $42.82 per SF, respectively. Citywide class B rental rates increased in Q3 to $28.50 per square foot from $28.18 in Q2. Class B rental rates in the CBD increased by 6.9% over the quarter from $40.28 per square foot to $43.08 per square foot. 3 Austin Research & Forecast Report | Q3 2017 | Office | Colliers International UNEMPLOYMENT 8/16 8/17 AUSTIN 3.4% 3.4% TEXAS 4.9% 4.5% U.S. 5.1% 4.5% JOB GROWTH Annual Change # of Jobs Added AUSTIN 2.1% 21.1K TEXAS 2.4% 286.3K U.S. 1.5% 2.1M CBD vs. Suburban CLASS A OFFICE VACANCY CLASS A OFFICE RENTS Job Growth & Unemployment (not seasonally adjusted) QUARTERLY ABSORPTION, NEW SUPPLY, AND VACANCY
- 4. 44 Austin Research & Forecast Report | Q3 2017 | Office | Colliers International Q3 2017 Top Office Lease Transactions BUILDING NAME/ADDRESS SUBMARKET SF TENANT LEASE DATE 208 Nueces St CBD 231,506 Facebook September-17 1601 S MoPac Expy Southwest 72,824 LifeSize1 September-17 203 Colorado St CBD 41,409 Parsley Energy July-17 2100 S Interstate 35 S South 26,876 (2nd Floor) July-17 2500 Bee Caves Rd Southwest 26,000 (3rd Floor)2 August-17 13801 Burnet Rd North/Domain 23,000 (1st Floor) September-17 6200 Bridgepoint Pky Northwest 22,820 iFly August-17 8300 N MoPac Expy Northwest 19,725 (3rd Floor) August-17 2330 S Lamar Blvd South 17,900 Nexstar3 August-17 4401 Westgate Blvd South 14,403 Altrua Healthshare July-17 7300 Ranch Road 2222 Northwest 11,192 Orion Consulting July-17 211 E 7th St CBD 10,780 Silver Car August-17 2010 S Lamar Blvd South 10,678 JE Dunn September-17 Leasing Activity Austin’s office leasing activity recorded 529,113 SF in Q3 2017. Major transactions this quarter included Facebook taking several floors at 208 Nueces St (Third and Shoal), moving into 231,506 SF there once construction has finished. 1 Renewal 2 Sublease 3 Colliers Deal Q3 2017 Significant Sales Transactions – (100,000 SF or greater) BUILDING ADDRESS SUBMARKET RBA (SF) YEAR BUILT BUYER SELLER SALE PRICE $/SF CLOSED 201 W 5th St CBD 179,351 2016 Intercontinental Real Estate Corporation Lincoln Property Company $119,000,000 $664 Sep-17 101 W Louis Henna Blvd1,2 North/Domain 163,803 1984 Harbert Moore Frontera, LLC UCM/MDC-RR Office LP $23,500,000 $143 Jul-17 10431 Morado Cir1 Northwest 107,002 1997 Vanderbilt Partners DivcoWest $26,710,568 $250 Jul-17 Sales Activity Austin’s office investment sales activity included three transactions. Intercontinental Real Estate Corporation purchased the 5th & Colorado office building, located at 201 West 5th Street. The eighteen story building was purchased from Lincoln Property Company for $119,000,000 ($664/SF). This building was 94% leased at the time of the transaction. Sources: CoStar and Real Capital Analytics 1 Part of a portfolio 2 Sale Price is Approximate LEADING THE NATION Austin ranked No. 1 as 2017 Best Places to Live in the United States according to U.S. News & World Report. The list ranked the country’s 100 largest metropolitan areas based on affordability, job prospects and quality of life
- 5. 5 Austin Research & Forecast Report | Q3 2017 | Office | Colliers International This is placeholder text. Place your text here. Chart Title–One Line Chart Title SUBHEAD 1 SUBHEAD 1 SUBHEAD 1 SUBHEAD 1 Body INVENTORY DIRECT VACANCY SUBLEASE VACANCY VACANCY VACANCY RATE (%) NET ABSORPTION (SF) RENTAL RATE CLASS # OF BLDGS TOTAL (SF) (SF) RATE (%) (SF) RATE (%) TOTAL (SF) Q3-2017 Q2-2017 Q3-2017 Q2-2017 AVG ($/ SF) CBD A 30 7,601,467 885,090 11.6% 88,741 1.2% 973,831 12.8% 10.3% -189,661 229,076 $49.43 B 35 2,723,333 162,842 6.0% 30,744 1.1% 193,586 7.1% 7.7% 16,432 42,808 $43.08 C 10 605,277 22,178 3.7% 16,945 2.8% 39,123 6.5% 4.1% -14,265 -968 $28.35 Total 75 10,930,077 1,070,110 9.8% 136,430 1.2% 1,206,540 11.0% 9.3% -187,494 270,916 $47.85 SUBURBAN A 180 20,177,568 1,661,870 8.2% 559,483 2.8% 2,221,353 11.0% 11.6% 115,658 58,490 $34.80 B 332 16,917,558 2,066,304 12.2% 175,089 1.0% 2,241,393 13.2% 14.1% 137,919 -72,020 $27.04 C 61 3,206,989 297,189 9.3% 1,000 0.0% 298,189 9.3% 5.9% -108,057 30,005 $21.87 Total 573 40,302,115 4,025,363 10.0% 735,572 1.8% 4,760,935 11.8% 12.2% 145,520 16,475 $31.25 OVERALL A 210 27,779,035 2,546,960 9.2% 648,224 2.3% 3,195,184 11.5% 11.2% -74,003 287,566 $37.99 B 367 19,640,891 2,229,146 11.3% 205,833 1.0% 2,434,979 12.4% 13.2% 154,351 -29,212 $28.50 C 71 3,812,266 319,367 8.4% 17,945 0.5% 337,312 8.8% 5.6% -122,322 29,037 $22.37 Total 648 51,232,192 5,095,473 9.9% 872,002 1.7% 5,967,475 11.6% 11.6% -41,974 287,391 $34.02 INVENTORY DIRECT VACANCY SUBLEASE VACANCY VACANCY VACANCY RATE (%) NET ABSORPTION (SF) RENTAL RATE CLASS # OF BLDGS. TOTAL (SF) (SF) RATE (%) (SF) RATE (%) TOTAL (SF) Q3-2017 Q2-2017 Q3-2017 Q2-2017 AVG ($/SF) CEDAR PARK A 2 232,274 28,765 12.4% 4,078 1.8% 32,843 14.1% 2.2% -27,714 0 $33.54 B 3 142,000 21,515 15.2% 9,405 6.6% 30,920 21.8% 8.5% -18,810 0 $25.70 Total 5 374,274 50,280 13.4% 13,483 3.6% 63,763 17.0% 4.6% -46,524 0 $31.40 CENTRAL . A 4 520,288 15,028 2.9% 4,317 0.8% 19,345 3.7% 6.2% 12,839 6,830 $43.96 B 35 1,944,551 118,694 6.1% 5,967 0.3% 124,661 6.4% 8.8% 45,980 10,746 $26.79 C 15 884,728 13,690 1.5% 0 0.0% 13,690 1.5% 2.1% 4,745 -8,530 $23.33 Total 54 3,349,567 147,412 4.4% 10,284 0.3% 157,696 4.7% 6.6% 63,564 9,046 $28.93 EAST A 3 162,582 38,611 23.7% 0 0.0% 38,611 23.7% 29.4% 9,238 -1,413 $40.55 B 15 1,385,953 454,820 32.8% 0 0.0% 454,820 32.8% 33.0% 2,141 -4,421 $32.96 C 5 202,765 24,000 11.8% 0 0.0% 24,000 11.8% 11.8% 0 5,050 $19.98 Total 23 1,751,300 517,431 29.5% 0 0.0% 517,431 29.5% 30.2% 11,379 -784 $36.55 FAR NORTHEAST B 1 23,408 0 0.0% 0 0.0% 0 0.0% 0.0% 0 0 - Total 1 23,408 0 0.0% 0 0.0% 0 0.0% 0.0% 0 0 - FAR NORTHWEST A 15 2,208,393 203,505 9.2% 41,913 1.9% 245,418 11.1% 10.2% -19,342 80,091 $29.75 B 9 347,418 31,562 9.1% 0 0.0% 31,562 9.1% 9.9% 2,844 1,445 $24.08 C 2 77,864 2,400 3.1% 0 0.0% 2,400 3.1% 3.1% 0 -2,400 $15.00 Total 26 2,633,675 237,467 9.0% 41,913 1.6% 279,380 10.6% 10.0% -16,498 79,136 $29.14 Austin Suburban Office Market Summary Austin Office Market Summary (CBD, Suburban, & Overall)
- 6. 6 Austin Research & Forecast Report | Q3 2017 | Office | Colliers International Austin Suburban Office Market Summary - Continued INVENTORY DIRECT VACANCY SUBLEASE VACANCY VACANCY VACANCY RATE (%) NET ABSORPTION (SF) RENTAL RATE CLASS # OF BLDGS. TOTAL (SF) (SF) RATE (%) (SF) RATE (%) TOTAL (SF) Q3-2017 Q2-2017 Q3-2017 Q2-2017 AVG ($/SF) NORTH/DOMAIN A 15 2,177,806 83,527 3.8% 15,234 0.7% 98,761 4.5% 90.0% 96,755 -3,711 $30.52 B 29 1,646,935 166,988 10.1% 30,990 1.9% 197,978 12.0% 12.9% 14,410 -7,276 $23.90 C 2 102,925 76,801 0.0% 0 0.0% 76,801 74.6% 0.0% -76,801 0 - Total 46 3,927,666 327,316 8.3% 46,224 1.2% 373,540 9.5% 10.4% 34,364 -10,987 $28.07 NORTHEAST A 5 413,863 20,508 5.0% 31,230 7.5% 51,738 12.5% 6.4% -25,061 -732 $24.96 B 20 1,370,755 147,452 10.8% 7,673 0.6% 155,125 11.3% 10.6% -9,996 -27,521 $22.45 C 8 276,413 80,799 29.2% 0 0.0% 80,799 29.2% 29.2% 0 25,670 $19.90 Total 33 2,061,031 248,759 12.1% 38,903 1.9% 287,662 14.0% 12.3% -35,057 -2,583 $22.94 NORTHWEST A 73 6,924,554 592,567 8.6% 176,053 2.5% 768,620 11.1% 12.0% 61,870 -134,830 $36.01 B 99 4,423,304 526,876 11.9% 75,717 1.7% 602,593 13.6% 15.1% 66,183 -22,522 $29.01 C 5 428,563 153 0.0% 1,000 0.2% 1,153 0.3% 0.8% 2,411 0 $22.96 Total 177 11,776,421 1,119,596 9.5% 252,770 2.1% 1,372,366 11.7% 12.8% 130,464 -157,352 $33.24 ROUND ROCK A 3 308,130 3,901 1.3% 0 0.0% 3,901 1.3% 9.6% 25,574 2,283 $32.04 B 13 508,163 44,680 8.8% 0 0.0% 44,680 8.8% 11.8% 15,156 -10,423 $24.76 C 3 147,466 0 0.0% 0 0.0% 0 0.0% 0.0% 0 0 - Total 19 963,759 48,581 5.0% 0 0.0% 48,581 5.0% 9.3% 40,730 -8,140 $25.62 SOUTH A 5 395,493 35,809 9.1% 10,618 2.7% 46,427 11.7% 11.3% -1,689 0 $36.23 B 23 1,131,499 126,599 11.2% 1,226 0.1% 127,825 11.3% 11.9% 6,355 10,304 $29.88 C 12 682,703 43,426 6.4% 0 0.0% 43,426 6.4% 6.1% -1,797 9,399 $25.00 Total 40 2,209,695 205,834 9.3% 11,844 0.5% 217,678 9.9% 10.0% 2,869 19,703 $30.46 SOUTHEAST B 10 1,173,424 214,612 18.3% 1,709 0.1% 216,321 18.4% 18.3% -1,029 3,723 $23.26 C 5 259,292 37,283 14.4% 0 0.0% 37,283 14.4% 0.0% -37,283 0 $15.00 Total 15 1,432,716 251,895 17.6% 1,709 0.1% 253,604 17.7% 15.0% -38,312 3,723 $23.18 SOUTHWEST A 50 6,243,735 615,335 9.9% 276,040 4.4% 891,375 14.3% 14.1% -12,045 102,714 $37.89 B 72 2,735,000 208,554 7.6% 42,402 1.6% 250,956 9.2% 9.7% 14,685 -25,073 $30.48 C 3 94,138 14,145 15.0% 0 0.0% 14,145 15.0% 17.8% 2,603 0 $26.30 Total 125 9,072,873 838,034 9.2% 318,442 3.5% 1,156,476 12.7% 12.8% 5,243 77,641 $35.91 WEST CENTRAL A 5 590,450 24,314 4.1% 0 0.0% 24,314 4.1% 3.3% -4,767 7,258 $42.82 B 3 85,148 3,952 4.6% 0 0.0% 3,952 4.6% 4.6% 0 -1,002 $31.35 C 1 50,132 4,492 9.0% 0 0.0% 4,492 9.0% 5.1% -1,935 816 - Total 9 725,730 32,758 4.5% 0 0.0% 32,758 4.5% 3.6% -6,702 7,072 $41.67
- 7. 7 Austin Research & Forecast Report | Q3 2017 | Office | Colliers International Office Development Pipeline 3,801,853 square feet of office space was under construction during Q3 2017. 7601 Southwest Parkway was the only building to deliver in Q3, totaling 87,500 square feet. Twenty proposed buildings were given the green light to begin construction this quarter. BUILDING NAME ADDRESS SUBMARKET SF PRE- LEASED DEVELOPER EST. DELIVERY Walsh Tarlton Overlook 2530 Walsh Tarlton Ln Southwest 55,500 0.0% JTM Development Oct-17 3114 S Congress Ave 3114 S Congress Ave South 32,000 100.00% Unknown Oct-17 La Palma Plaza 12030 N Lamar Blvd North/Domain 25,400 0.0% Unknown Oct-17 Medical Towers at Bee Cave -- Bldg #1 3944 Ranch Road 620 S Southwest 22,900 100.00% Hat Trick Development Oct-17 9811 Vikki 9811 Vikki Ter Southwest 22,000 64.10% Unknown Oct-17 3503 Wild Cherry Dr 3503 Wild Cherry Dr Southwest 46,200 0.00% Unknown Oct-17 Sadler East, Building #2 1251 Sadler Dr Hays County 18,000 0.00% Unknown Oct-17 Medical Office Building I 15801 TX 71 Southwest 12,000 64.20% Unknown Oct-17 Medical Office Building II 15801 TX 71 Southwest 10,300 0.00% Unknown Oct-17 Shoal Creek Walk 835 W 6th St CBD 218,180 63.4% Schlosser Development Oct-17 Overlook at Barton Creek 317 Grace Ln Southwest 60,168 0.0% Unknown Nov-17 MoPac Centre 8611 N MoPac Expy Central 95,863 12.9% Eurus Capital Nov-17 UpCycle 2416 E 6th St East 81,711 0.2% EverWest Real Estate Partners Nov-17 Medical Towers at Bee Cave Bldg #2 3944 Ranch Road 620 S Southwest 42,000 76.19% Hat Trick Development Nov-17 16401 R R 620 16401 R R 620 Round Rock 14,935 100.00% Unknown Nov-17 801 Barton Springs Rd 801 Barton Springs Rd South 90,500 2.8% Generational Commercial Properties Dec-17 Oracle Campus Building 1 South Lakeshore Blvd Southeast 225,000 100.00% Ryan Companies Dec-17 Building 3 1200 Sheldon Cv Northeast 50,826 100.00% Unknown Dec-17 Mirabeau 2330 S Lamar Blvd South 34,169 94.32% Ellis Winstanley Dec-17 Covered Bridge Village 8701 W State Highway 71 Southwest 13,000 0.00% Unknown Dec-17 Fourth & Office 1800 E 4th St East 42,000 20.22% Capsa Ventures Dec-17 908 W Whitestone Blvd 908 W Whitestone Blvd Cedar Park 10,500 76.19% Unknown Dec-17 Oracle Campus 2300 Cloud Way Southeast 550,750 100.00% Ryan Companies Jan-18 Harrison Building 3205 Industrial Ter North/Domain 10,800 0.00% Unknown Jan-18 Springdale General 1023 Springdale Rd East 165,000 40.6% Unknown Mar-18 Broadmoor - Charles Schwab Austin Campus-2 2309 Gracy Farms Ln North/Domain 265,790 100.00% Unknown Mar-18 901 E 6th St 901 E 6th St East 132,000 0.00% Pegalo Properties Jun-18 QUOTED GROSS RENTAL RATES FOR EXISTING TOP PERFORMING OFFICE BUILDINGS BUILDING NAME ADDRESS SUBMARKET RBA (SF) YEAR BUILT % LEASED AVAIL. SF RENT ($/SF) OWNER Frost Bank Tower 401 Congress Ave CBD 535,078 2003 88.6% 129,433 $69.38 CalSTRS One Eleven 111 Congress Ave CBD 518,385 1985 88.0% 89,015 $58.16 Cousins Properties Inc One American Center 600 Congress Ave CBD 503,951 1984 99.2% 88,693 $55.86 CalSTRS 300 West Sixth 300 W 6th St CBD 454,225 2001 98.9% 18,120 $63.78 CalSTRS 301 Congress 301 Congress Ave CBD 446,839 1985 91.1% 60,439 $59.52 PGIM Real Estate 100 Congress 100 Congress Ave CBD 411,536 1985 93.0% 63,573 $65.41 Invesco 816 Congress 816 Congress Ave CBD 433,024 1983 96.6% 29,161 $55.52 Cousins Properties, Inc. 7700 W Parmer Ln - Bldg. B 7700 W Parmer Ln - Bldg.B Far Northwest 335,138 1999 98.4% 5,373 $36.41 Accesso Partners, LLC Austin Centre 701 Brazos St CBD 326,335 1986 93.0% 82,857 $51.92 Sidra Real Estate, Inc. Cielo Center 1250 Capital of TX Hwy S Southwest 270,711 1984 84.9% 45,993 $35.00 Brandywine Realty Trust Note: Avail. SF includes direct and sublet space as well as any future available space listed. Source: CoStar Property
- 8. 8 North American Research & Forecast Report | Q4 2014 | Office Market Outlook | Colliers International Copyright © 2015 Colliers International. The information contained herein has been obtained from sources deemed reliable. While every reasonable effort has been made to ensure its accuracy, we cannot guarantee it. No responsibility is assumed for any inaccuracies. Readers are encouraged to consult their professional advisors prior to acting on any of the material contained in this report. Colliers International | Market 000 Address, Suite # 000 Address, Suite # +1 000 000 0000 colliers.com/<<market>> 8 North American Research & Forecast Report | Q4 2014 | Office Market Outlook | Colliers International Copyright © 2017 Colliers International. The information contained herein has been obtained from sources deemed reliable. While every reasonable effort has been made to ensure its accuracy, we cannot guarantee it. No responsibility is assumed for any inaccuracies. Readers are encouraged to consult their professional advisors prior to acting on any of the material contained in this report. Colliers International | Austin 111 Congress Avenue, Suite 750 Austin, Texas 78701 +1 512 539 3000 colliers.com/texas/austin FOR MORE INFORMATION Kaitlin Holm Research and Marketing Coordinator | Austin +1 512 539 3021 kaitlin.holm@colliers.com Q3 2017 Austin Office Highlights