
Empfohlen
Weitere ähnliche Inhalte
Was ist angesagt?
Was ist angesagt? (20)
Ähnlich wie Economic Update (July 2011)
Ähnlich wie Economic Update (July 2011) (20)
Kürzlich hochgeladen
Kürzlich hochgeladen (20)
Economic Update (July 2011)
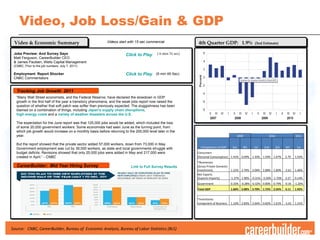
- 1. Video, Job Loss/Gain & GDP 4th Quarter GDP: 1.9% (3nd Estimate) Source: CNBC, CareerBuilder, Bureau of Economic Analysis, Bureau of Labor Statistics (BLS) Video & Economic Summary Videos start with 15 sec commercial Tracking Job Growth 2011 Jobs Preview: And Survey Says ( 6 min 31 sec) Matt Ferguson, CareerBuilder CEO & James Paulsen, Wells Capital Management (CNBC, Prior to the job numbers, July 7, 2011) Employment Report Shocker (9 min 49 Sec) CNBC Commentators Click to Play “ Many Wall Street economists, and the Federal Reserve, have declared the slowdown in GDP growth in the first half of the year a transitory phenomena, and the weak jobs report now raised the question of whether that soft patch was softer than previously expected. The sluggishness has been blamed on a combination of things, including Japan's supply chain disruptions , high energy costs and a variety of weather disasters across the U.S. The expectation for the June report was that 125,000 jobs would be added, which included the loss of some 20,000 government workers. Some economists had seen June as the turning point, from which job growth would increase on a monthly basis before returning to the 200,000 level later in the year. But the report showed that the private sector added 57,000 workers, down from 73,000 in May. Government employment was cut by 39,000 workers, as state and local governments struggle with budget deficits. Revisions showed that only 25,000 jobs were added in May and 217,000 were created in April.” - CNBC Click to Play CareerBuilder: Mid Year Hiring Survey Link to Full Survey Results 2009 2010 2011 Components of GDP 3rd 4th 1st 2nd 3rd 4th 1st Consumers 1.41% 0.69% 1.33% 1.54% 1.67% 2.79 1.52% (Personal Consumption) *Businesses 1.22% 2.70% 3.04% 2.88% 1.80% -2.61 1.46% (Gross Private Domestic Investment) Net Exports (Exports-Imports) -1.37% 1.90% -0.31% -3.50% -1.70% 3.27 0.14% Government 0.33% -0.28% -0.32% 0.80% 0.79% -0.34 -1.20% Total GDP 1.60% 5.00% 3.70% 1.72% 2.56% 3.11 1.92% *Inventories 1.10% 2.83% 2.64% 0.82% 1.61% -3.42 1.31% component of Business
- 2. US Employment Situation Number of people employed as a temporary employee divided by total non farm payroll employment June 2009 Recession Officially Ended July 2009 Temp Penetration Trend Turns Positive Oct 2009 1 st Job Growth >100,000 (Household Survey) Nov 2009 1 st Job Growth (Payroll Survey) Temp Employment Temporary help services lost 12,000 jobs. Why is the Temp Penetration Rate Important? “ Temporary Help Employment is a Leading Indicator for Nonfarm Employment—Staffing job trends lead nonfarm employment by three months when the economy is emerging from a recession and by six months during periods of normal economic growth . ” American Staffing Association Temp Penetration Rate: % -. 01% Job Loss/Gain: + 18,000 Jobs Unemployment Rate: 9.2% +0.1% I Unemployment Rate: Bachelor’s Degree or higher Source: Bureau of Labor Statistics, American Staffing Association Feb March April May June 4.3% 4.4% 4.5% 4.5% 4.4% Nonfarm Payroll – Job Growth Details Jobs Added/Lost Private Sector 57,000 Government Sector -39,000 Total 18,000 Job Loses Change from Previous Month Government -39,000 Financial Activities -15,000 Construction -9,000 Job Gains Change from Previous Month Leisure & Hospitality 34,000 Professional & Business Services 12,000 Manufacturing 6,000 Retail Trade 5,200 Education & Health Services 0 - Education -17,400 - Healthcare 13,500 - Social Assistance 3,900
- 3. Projections & Sector Comparison A Gloomy Report on Jobs (New York Times) Unemployment Rate Projections Survey of Economists (Wall Street Journal) Source: Wall Street Journal, New York Times Please note: WSJ Projections were released prior to the BLS report GDP Projections Survey of Economists (Wall Street Journal) In June, the economy added only 18,000 jobs, with a majority of sectors performing worse than they did in May. Charts show monthly changes in jobs, seasonally adjusted.