Dubit infographic-children&ya.reading-v3
•
0 gefällt mir•277 views

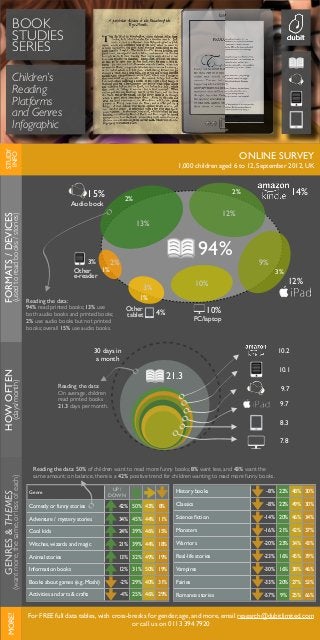
Reading by young adults and children across different devices. Dubit research, infographic designed and made by Claudio Franco

Empfohlen
Weitere ähnliche Inhalte
Andere mochten auch
Mehr von Claudio Pires Franco
Mehr von Claudio Pires Franco (11)
Kürzlich hochgeladen
Kürzlich hochgeladen (20)
Dubit infographic-children&ya.reading-v3
- 1. HOWOFTEN (days/month) FORMATS/DEVICES (usedtoreadbooks/stories) ONLINE SURVEY 1,000 children aged 6 to 12, September 2012, UK STUDY INFO BOOK STUDIES SERIES Children’s Reading Platforms and Genres Infographic For FREE full data tables, with cross-breaks for gender, age, and more, email research@dubitlimited.com or call us on 0113 394 7920 MORE!GENRES&THEMES (wantmore,thesame,orlessofeach) 94% 12% 9% 14% 10% PC/laptop 3% 4% Other tablet 2%3% Other e-reader 13% 15% Audio book Reading the data: 94% read printed books; 13% use both audio books and printed books; 2% use audio books but not printed books; overall 15% use audio books. 10% 12% 1% 2% 2% 3% 1% 30 days in a month 8.3 10.2 9.7 7.8 10.1 9.7 21.3 Reading the data: On average, children read printed books 21.3 days per month. Genre UP / DOWN Comedy or funny stories Adventure / mystery stories Cool kids Witches, wizards and magic Animal stories Information books Books about games (e.g. Moshi) Activities and arts & crafts 42% 50% 43% 8% 34% 45% 44% 11% 24% 39% 46% 15% 21% 39% 44% 18% 13% 32% 49% 19% 12% 31% 50% 19% -2% 29% 40% 31% -4% 25% 46% 29% History books Classics Science fiction Monsters Warriors Real-life stories Vampires Fairies Romance stories -8% 22% 48% 30% -8% 22% 49% 30% -14% 20% 46% 34% -16% 21% 42% 37% -20% 23% 34% 43% -23% 16% 45% 39% -30% 16% 38% 46% -33% 20% 27% 53% -57% 9% 25% 66% Reading the data: 50% of children want to read more funny books; 8% want less, and 43% want the same amount; on balance, there is a 42% positive trend for children wanting to read more funny books.