Montana Drought Analysis
•
1 gefällt mir•718 views

A Montana Drought Analysis from the 2013 Clark Fork River Basin Task Force Meeting.

Empfohlen
Empfohlen
Weitere ähnliche Inhalte
Was ist angesagt?
Was ist angesagt? (20)
Andere mochten auch
Andere mochten auch (10)
Ähnlich wie Montana Drought Analysis
Ähnlich wie Montana Drought Analysis (20)
Mehr von Clark Fork Task Force
Mehr von Clark Fork Task Force (12)
Kürzlich hochgeladen
Kürzlich hochgeladen (20)
Montana Drought Analysis
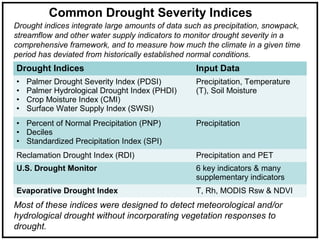
- 1. Most of these indices were designed to detect meteorological and/or hydrological drought without incorporating vegetation responses to drought. Common Drought Severity Indices Drought Indices Input Data • Palmer Drought Severity Index (PDSI) • Palmer Hydrological Drought Index (PHDI) • Crop Moisture Index (CMI) • Surface Water Supply Index (SWSI) Precipitation, Temperature (T), Soil Moisture • Percent of Normal Precipitation (PNP) • Deciles • Standardized Precipitation Index (SPI) Precipitation Reclamation Drought Index (RDI) Precipitation and PET U.S. Drought Monitor 6 key indicators & many supplementary indicators Evaporative Drought Index T, Rh, MODIS Rsw & NDVI Drought indices integrate large amounts of data such as precipitation, snowpack, streamflow and other water supply indicators to monitor drought severity in a comprehensive framework, and to measure how much the climate in a given time period has deviated from historically established normal conditions.
- 2. PENMAN-MONTEITH equation for Evapotranspiration Windspeed ( ) ( ) ( ) ie satpne rr eeCGRr E ⋅+∆+⋅ −⋅+−⋅⋅∆ = γγ ρ λ 0 Solar radiation HumidityAir Temperature Land Water Balance = Precipitation – Evapotranspiration THE PROBLEM Temperature + Precipitation does NOT show the landscape aridity Veg Leaf Area Fairbanks and Tucson have nearly identical annual precipitation, The difference is potential evaporation!
- 4. Global annual DSI over 2000-2011 (-) Drier than normal (+) Wetter than normal
- 5. Monthly DSI over continental USA in 2012 Strong drought impacts across US Corn- belt region in mid to late summer
- 6. Downscaling global models for regional studies
- 7. MODIS ET and Landscape-Scale Climate Data for Montana Avg. July ET: 2000-2012 Jared W. Oyler PhD Student, Software Engineer Numerical Terradynamic Simulation Group (NTSG), Montana Climate Office College of Forestry and Conservation, University of Montana
- 8. Remote Sensing of ET: MODIS ET • Penman-Monteith approach • ET = sum of: – Soil surface E – Canopy intercepted water E – VegetationT • 8-day, monthly, annual products • 1-km resolution • Main advantages – Generalized model that can be run globally – 8-day temporal resolution – Relatively straightforward to operationalize • Main disadvantages – Generalized model – Spatial resolution Avg. July ET: 2000-2012
- 9. Data Inputs MODIS 1-km products •LAI (8-day) •% Veg Cover (8-day) •Albedo (16-day) •Land Cover (Static) Daily weather data •1/2° x 2/3° •~ 56 km x 51 km •Temperature •Humidity (RH,VPD) •Radiation Model Params by LC •Used in calculations of conductances and resistances •9 total MODIS P-M ET Model 8-day 1-km ET Estimates
- 10. Landscape Scale Weather/Climate Datasets Interpolated Datasets: spatially interpolate point-source historical weather observations onto a regular spatial grid – PRISM – DAYMET – MCO: wxTopo – U. Idaho: NLDAS + PRISM Weather Stations Interpolated Dataset
- 11. Weather Station Data Long-term Station > 40 years of data Short-term Station < 40 years > 5 years
- 12. CoarseWeather Data Crown of the Continent Region
- 13. CoarseWeather Data Avg.Values 2000-2009 Solar Radiation Temperature Vapor Pressure Deficit
- 14. WxTopo vs. CoarseWeather Data 1948 -2012 Mean 1948 -2009 Mean
- 15. Land SkinTemperature Tmax: MODIS 2003 – 2012 10 year average
- 16. Interpolation Example 1948 -2012 Daily Mean: Crown of the Continent Region Tmin Tmax
- 17. Topographic Dissection Good at picking up cold air drainage potential (Holden et al. 2011)
- 18. Stepwise MODIS ET Improvements for Montana 1. Improved landscape-scale weather data 2. Regionally and/or crop optimized land cover model parameters 3. Improved MODIS ET model 4. Finer resolution (500m)
Hinweis der Redaktion
- Global climate models are designed to simulate the large-scale patterns of climate, and they do so quite well (globe, the surface air temperature simulated by the German ECHAM5 model for January 1999). The ECHAM5 model in this simulation had a resolution of approximately 2°longitude by 2°latitude. For smaller-scale studies, however, the graininess of the models is evident (top right) and important features are missing like the east-west contrast across the Cascades. The process of translating these large-scale fields to the fine-scale topography (0.125° by 0.125° in the example shown) is called “downscaling”. The next slide shows the two primary approaches to downscaling.
- More of generalized model that can be run anywhere globally Not yet operational, but can be with different driving climate data