Hawaii Lottery Poll Results
•
0 gefällt mir•2,131 views

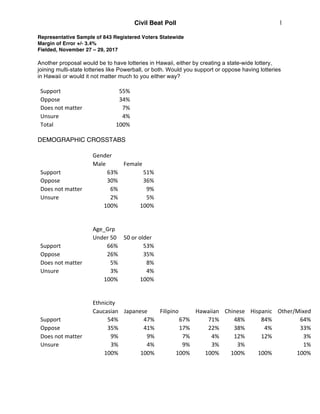
A poll of 843 registered Hawaii voters found that 55% supported having lotteries in Hawaii by creating a statewide lottery or joining multi-state lotteries like Powerball, while 34% opposed the idea and 7% said it did not matter to them. Support was higher among men, younger voters, Native Hawaiians, Hispanics, residents of Hawaii Island and Kauai, those without a college degree, Democrats, and those with lower incomes.

Empfohlen
Empfohlen
Weitere ähnliche Inhalte
Was ist angesagt?
Was ist angesagt? (19)
Ähnlich wie Hawaii Lottery Poll Results
Ähnlich wie Hawaii Lottery Poll Results (20)
Mehr von Honolulu Civil Beat
Mehr von Honolulu Civil Beat (20)
Kürzlich hochgeladen
Kürzlich hochgeladen (20)
Hawaii Lottery Poll Results
- 1. Civil Beat Poll Representative Sample of 843 Registered Voters Statewide Margin of Error +/- 3.4% Fielded, November 27 – 29, 2017 Another proposal would be to have lotteries in Hawaii, either by creating a state-wide lottery, joining multi-state lotteries like Powerball, or both. Would you support or oppose having lotteries in Hawaii or would it not matter much to you either way? 1 Support 55% Oppose 34% Does not matter 7% Unsure 4% Total 100% DEMOGRAPHIC CROSSTABS Gender Male Female Support 63% 51% Oppose 30% 36% Does not matter 6% 9% Unsure 2% 5% 100% 100% Age_Grp Under 50 50 or older Support 66% 53% Oppose 26% 35% Does not matter 5% 8% Unsure 3% 4% 100% 100% Ethnicity Caucasian Japanese Filipino Hawaiian Chinese Hispanic Other/Mixed Support 54% 47% 67% 71% 48% 84% 64% Oppose 35% 41% 17% 22% 38% 4% 33% Does not matter 9% 9% 7% 4% 12% 12% 3% Unsure 3% 4% 9% 3% 3% 1% 100% 100% 100% 100% 100% 100% 100%
- 2. Civil Beat Poll Representative Sample of 843 Registered Voters Statewide Margin of Error +/- 3.4% Fielded, November 27 – 29, 2017 Another proposal would be to have lotteries in Hawaii, either by creating a state-wide lottery, joining multi-state lotteries like Powerball, or both. Would you support or oppose having lotteries in Hawaii or would it not matter much to you either way? 2 County Oahu Hawaii Maui Kauai Support 52% 64% 62% 64% Oppose 36% 28% 34% 22% Does not matter 8% 5% 5% 7% Unsure 4% 3% 7% 100% 100% 100% 100% District 100% 200% Support 51% 59% Oppose 36% 32% Does not matter 8% 7% Unsure 5% 2% 100% 100% CollegeDeg College Degree No college Degree Support 51% 63% Oppose 40% 27% Does not matter 7% 7% Unsure 3% 3% 100% 100% Party Democrat Republican Independent Support 58% 45% 66% Oppose 29% 41% 28% Does not matter 8% 14% 4% Unsure 5% 1% 2% 100% 100% 100%
- 3. Civil Beat Poll Representative Sample of 843 Registered Voters Statewide Margin of Error +/- 3.4% Fielded, November 27 – 29, 2017 Another proposal would be to have lotteries in Hawaii, either by creating a state-wide lottery, joining multi-state lotteries like Powerball, or both. Would you support or oppose having lotteries in Hawaii or would it not matter much to you either way? 3 Politics Liberal/progressive Moderate Conservative Support 56% 59% 58% Oppose 32% 32% 38% Does not matter 9% 7% 3% Unsure 3% 2% 1% 100% 100% 100% Household Income Less than $50,000 $50,000 - $100,000 More than $100,000 Support 62% 57% 55% Oppose 30% 31% 38% Does not matter 3% 9% 5% Unsure 5% 3% 2% 100% 100% 100%
- 4. Civil Beat Poll Representative Sample of 843 Registered Voters Statewide Margin of Error +/- 3.4% Fielded, November 27 – 29, 2017 Another proposal would be to have lotteries in Hawaii, either by creating a state-wide lottery, joining multi-state lotteries like Powerball, or both. Would you support or oppose having lotteries in Hawaii or would it not matter much to you either way? 4 About the Poll Civil Beat surveyed a random sample of 843 registered voters statewide. Calls were made from November 27 - 29, 2017, using interactive voice response technology (touch-tone polling). Cell phones were contacted by live call-agents who asked respondents whether they were willing to participate in a recorded survey. Respondents who gave consent were patched through to the same recorded survey that was sent to landlines. Results were balanced for gender, age, race/ethnicity, county of residence, and education level. The margin of error for the full sample is +/- 3.4 percentage points. Other sources of error, such as imperfect response rates, are also common in public opinion research and may affect the results. The margin of error for any crosstabulated result is larger than the margin of error of the corresponding topline result. The poll was conducted by Civil Beat working with Merriman River Group, a full-service consulting organization specializing in opinion research, election management, and communications.