SlideShare ist ein Scribd-Unternehmen logo
1 von 5
Downloaden Sie, um offline zu lesen
Geography            Cash-paying      Median       Median        Percent  $1000+ $1000+ (2000 Percent
                         Renter-Occupied contract rent contract rent   Change (2009 ACS) Census     Change
                         Units (2009 ACS) (2009 ACS) (2000 Census)
United States                   35,101,833   $675          $519        30.1%    22.4%      8.3%     168.1%
Hawaii                             167,904  $1,106         $721        53.4%    56.4%      22.0%    156.2%
Hawaii County                       18,995   $848          $553        53.3%    36.7%      8.8%     318.5%
Honolulu County                    123,149  $1,162         $752        54.5%    59.4%      25.5%    133.3%
Kauai County                         7,074  $1,004         $646        55.4%    50.3%      10.7%    369.7%
Maui County                         18,670  $1,119         $716        56.3%    58.8%      16.7%    251.4%
Barbers Point Housing                   19  $2,001        $1,542       29.8%    100%       100%       0.0%
Hickam Housing                       1,368  $2,001        $1,244       60.9%    100%       79.2%     26.2%
Kapalua                                 23  $2,001        $1,107       80.8%    100%        56%      78.6%
Kaneohe Station                      1,495  $1,962        $1,008       94.6%    95.1%      51.1%     85.9%
Heeia                                  164  $1,944        $1,398       39.1%    83.5%      84.6%     -1.3%
Schofield Barracks                   2,402  $1,870        $1,014       84.4%    90.9%      51.5%     76.4%
Kaanapali                               63  $1,861        $1,692       10.0%    60.3%      97.8%    -38.3%
Wheeler AFB                            691  $1,856         $936        98.3%    98.6%      35.8%    175.4%
Village Park                           723  $1,849         $926        99.7%    100%       43.3%    130.9%
Princeville                            244  $1,753        $1,116       57.1%    92.2%      61.5%     50.0%
Iroquois Point                         963  $1,744        $1,162       50.1%    99.8%      72.9%     36.9%
Maunawili                              153  $1,703        $1,402       21.5%    83.7%      76.4%      9.5%
Kahaluu-Keauhou                        405  $1,700         $767        121.6%   79.5%      30.3%    162.3%
Ahuimanu                               415  $1,670         $962        73.6%    90.6%      42.0%    115.6%
Wailua Homesteads                      354  $1,662         $732        127.0%   77.4%      14.2%    445.9%
Mililani Town                        2,036  $1,620        $1,080       50.0%    79.4%      58.2%     36.4%
Wailea-Makena                        1,122  $1,563         $862        81.3%    88.3%      31.0%    185.1%
Aiea                                   522  $1,545         $944        63.7%    75.9%      43.4%     74.9%
Hanalei                                 69  $1,537         $798        92.6%    62.3%      17.2%    261.4%
Kaneohe                              2,951  $1,480         $968        52.9%    68.5%      46.3%     47.8%
Kailua (Honolulu County)             3,048  $1,477        $1,024       44.2%    71.8%      51.8%     38.7%
Maalaea                                 73  $1,445         $847        70.6%    100%        25%     300.0%
Pearl City                           2,825  $1,420         $745        90.6%    67.7%      33.4%    102.4%
Laie                                   491  $1,418         $861        64.7%    87.2%      34.2%    155.0%
Waimalu                              3,979  $1,404         $910        54.3%    81.5%      35.5%    129.7%
Pupukea                                611  $1,397         $940        48.6%    71.5%      44.4%     60.9%
Makakilo City                        1,402  $1,389         $952        45.9%    83.5%      43.1%     93.6%
Geography          Cash-paying      Median       Median      Percent  $1000+ $1000+ (2000   Percent
                       Renter-Occupied contract rent contract rent Change (2009 ACS) Census       Change
                       Units (2009 ACS) (2009 ACS) (2000 Census)
Ewa Gentry                           593  $1,355         $869       55.9%   97.3%     31.2%        212.3%
Waipio                             1,195  $1,349         $837       61.2%   90.0%     19.9%        352.8%
Waikoloa Village                     561  $1,348         $717       88.0%   80.2%     14.4%        456.2%
Poipu                                121  $1,313         $912       44.0%   93.4%     36.6%        155.3%
Paia                                 337  $1,311         $701       87.0%   72.4%     24.9%        190.8%
Holualoa                           1,354  $1,296         $709       82.8%   73.6%     23.4%        213.7%
Kaaawa                               141  $1,278         $721       77.3%   68.8%     19.0%        261.7%
Makawao                              935  $1,277         $765       66.9%   75.1%     19.4%        287.5%
Kihei                              3,827  $1,267         $745       70.1%   74.8%     14.2%        425.6%
Hauula                               275  $1,260         $719       75.2%   54.9%     14.0%        291.0%
Kalihiwai                            144  $1,241         $775       60.1%   68.1%     42.4%         60.4%
Haliimaile                            48  $1,237         $725       70.6%   87.5%     6.5%        1,256.3%
Kilauea                              223  $1,235         $838       47.4%   74.9%     23.8%        214.0%
Kalaoa                               719  $1,230         $934       31.7%   67.0%     37.2%         80.2%
Kawela Bay                            60  $1,227         $878       39.7%   66.7%     29.7%        124.7%
Kahaluu                              351  $1,213         $737       64.6%   73.8%     17.2%        328.7%
Haiku-Pauwela                      1,190  $1,204         $783       53.8%   61.8%     17.1%        261.1%
Mokuleia                             395  $1,203         $837       43.7%   79.2%     36.0%        119.8%
Lawai                                139  $1,196         $773       54.7%   54.0%     13.7%        294.9%
Puako                                141  $1,186         $814       45.7%   67.4%     31.8%        112.0%
Pukalani                           1,104  $1,167         $848       37.6%   64.8%     28.2%        129.3%
Waialua                              501  $1,143         $537      112.8%   62.7%     12.3%        410.0%
Kapaa                              1,151  $1,137         $645       76.3%   61.5%     5.6%         989.3%
Napili-Honokowai                   1,520  $1,122         $801       40.1%   58.4%     19.7%        196.6%
Waihee-Waiehu                        390  $1,121         $601       86.5%   53.6%     21.8%        145.6%
Waipio Acres                         859  $1,111         $689       61.2%   66.0%     17.2%        283.3%
Halawa                             1,535  $1,103         $785       40.5%   56.2%     36.8%         52.6%
Honalo                               263  $1,103         $680       62.2%   57.8%     11.1%        421.9%
Kalaheo                              551  $1,103         $618       78.5%   57.2%     14.2%        302.9%
Waimea (Hawaii County)               992  $1,063         $737       44.2%   53.6%     18.0%        197.2%
Captain Cook                         366  $1,013         $566       79.0%   51.6%     9.3%         457.7%
Honolulu                          69,591  $1,010         $721       40.1%   50.6%     21.3%        137.8%
Kailua (Hawaii County)             2,150  $1,009         $632       59.7%   51.0%     11.8%        334.0%
Geography            Cash-paying      Median       Median      Percent  $1000+ $1000+ (2000   Percent
                         Renter-Occupied contract rent contract rent Change (2009 ACS) Census       Change
                         Units (2009 ACS) (2009 ACS) (2000 Census)
Anahola                                105  $1,003         $671       49.5%   50.5%     15.8%       219.7%
Wailua                                 330   $996          $754       32.1%   49.1%     7.1%        589.6%
Omao                                   144   $990          $775       27.7%   48.6%     21.9%       121.7%
Ewa Beach                              985   $986          $835       18.1%   47.9%     28.3%        69.3%
Puhi                                    38   $986          $636       55.0%   44.7%     6.0%        651.6%
Makaha Valley                          331   $982          $587       67.3%   43.8%      0%
Nanakuli                               649   $978          $670       46.0%   45.6%     6.0%        664.7%
Lahaina                              1,327   $964          $773       24.7%   47.9%     25.6%        87.1%
Waikapu                                 64   $943          $670       40.7%   37.5%     14.7%       155.0%
Haleiwa                                520   $942          $639       47.4%   47.3%     13.2%       257.6%
Makaha                               1,225   $941          $627       50.1%   41.6%     7.7%        440.2%
Papaikou                               163   $940          $448      109.8%   33.7%      0%
Halaula                                 53   $936          $578       61.9%   41.5%      0%
Kaunakakai                             305   $925          $478       93.5%   43.6%     0.7%        6,550.0%
Waimanalo                              401   $906          $586       54.6%   40.6%     12.4%        227.4%
Punaluu                                176   $896          $713       25.7%   32.4%     13.0%        148.7%
Waipahu                              3,114   $893          $593       50.6%   39.6%     11.8%        234.4%
Whitmore Village                       209   $890          $622       43.1%   29.7%     14.4%        105.4%
Hanamaulu                              456   $882          $596       48.0%   46.9%     1.5%        3,081.8%
Hawaiian Beaches                       356   $882          $528       67.0%   41.6%      0%
Leilani Estates                         75   $858          $533       61.0%   42.7%      0%
Wailuku                              1,689   $854          $587       45.5%   39.8%     8.8%        351.6%
Waimea (Kauai County)                  186   $854          $532       60.5%   24.7%      0%
Ainaloa                                200   $846          $547       54.7%    29%       0%
Kekaha                                 378   $834          $512       62.9%   27.5%     5.3%        419.5%
Hawaiian Paradise Park                 594   $828          $548       51.1%   13.1%      0%
Honomu                                  44   $820          $518       58.3%   22.7%      0%
Kualapuu                                66   $820          $550       49.1%   36.4%      0%
Nanawale Estates                       120   $791          $496       59.5%   10.8%      0%
Hawi                                    73   $788          $598       31.8%   38.4%     4.1%        833.3%
Wahiawa                              2,341   $785          $581       35.1%   33.7%     6.0%        460.6%
Wainaku                                 98   $775          $600       29.2%   30.6%     9.4%        226.5%
Kahului                              2,217   $770          $600       28.3%   31.3%     6.7%        363.4%
Geography         Cash-paying      Median       Median        Percent  $1000+ $1000+ (2000 Percent
                      Renter-Occupied contract rent contract rent   Change (2009 ACS) Census     Change
                      Units (2009 ACS) (2009 ACS) (2000 Census)
Koloa                               315   $769          $442        74.0%     40%       1.7%     2,233.3%
Hana                                 26   $767          $617        24.3%    34.6%      4.4%      678.8%
Honaunau-Napoopoo                   321   $765          $565        35.4%    40.8%       10%      308.1%
Hilo                              5,941   $764          $489        56.2%    23.8%      3.3%      622.6%
Maili                               550   $760          $667        13.9%    40.5%      13.2%     207.3%
Lihue                               887   $759          $670        13.3%    30.1%      7.6%      295.8%
Waianae                             686   $743          $538        38.1%    33.2%      13.7%     143.1%
Mountain View                       263   $735          $522        40.8%    32.7%        0%
Paukaa                               50   $725          $708         2.4%     16%       9.4%      70.7%
Kapaau                              147   $719          $654         9.9%    21.8%      6.4%     241.0%
Paauilo                              51   $719          $375        91.7%     3.9%        0%
Laupahoehoe                          35   $705          $544        29.6%    25.7%        0%
Hanapepe                            305   $687          $600        14.5%    25.9%      1.5%     1,575.0%
Eleele                              134   $677          $379        78.6%    38.1%        0%
Naalehu                             106   $677          $277        144.4%    3.8%        0%
Hawaiian Acres                      123   $675          $526        28.3%     4.9%        0%
Orchidlands Estates                 180   $674          $473        42.5%    14.4%        0%
Fern Acres                           70   $663          $235        182.1%   14.3%        0%
Hawaiian Ocean View                 184   $646          $395        63.5%    10.9%        0%
Honokaa                             226   $633          $502        26.1%    14.6%        0%
Volcano                             260   $622          $523        18.9%     4.2%      2.2%      92.5%
Maunaloa                             80   $620          $551        12.5%      0%         0%
Waimanalo Beach                     166   $577          $843        -31.6%   27.7%      33.1%    -16.3%
Pahala                              147   $557          $314        77.4%     5.4%        0%
Waikane                              55   $538          $525         2.5%    34.5%      21.2%     63.3%
Kealakekua                          337   $527          $409        28.9%    23.7%      2.7%     790.2%
Kurtistown                          101   $513          $560         -8.4%    5.0%        0%
Kahuku                              244   $477          $246        93.9%    16.8%      7.3%     130.0%
Fern Forest                          73   $457          $275        66.2%      0%         0%
Ewa Villages                        226   $436          $169        158.0%   23.9%        0%
Pahoa                                57   $434          $387        12.1%      0%         0%
Keaau                               169   $429          $439         -2.3%    7.1%      0.8%     773.4%
Eden Roc                             44   $425           $99        329.3%     0%         0%
Geography     Cash-paying      Median       Median      Percent  $1000+ $1000+ (2000 Percent
                  Renter-Occupied contract rent contract rent Change (2009 ACS) Census     Change
                  Units (2009 ACS) (2009 ACS) (2000 Census)
Lanai City                     351    $350          $330        6.1%   14.8%      0%
Pepeekeo                       218    $221          $216        2.3%    6.9%     2.9%      133.9%
Kaumakani                      228    $173          $140       23.6%    3.5%     3.0%       17.5%
Pakala Village                  87    $138           $99       39.4%    9.2%      0%
Kukuihaele                       6     $0           $538      -100.0%    0%       0%

Weitere ähnliche Inhalte

Was ist angesagt?

H W 2010 Q1 De 12 Mo
H W 2010 Q1 De 12 MoH W 2010 Q1 De 12 Mo
H W 2010 Q1 De 12 Mochipwags
 
Electronic Security Expo 2012 Attrition Toolbox
Electronic Security Expo 2012 Attrition ToolboxElectronic Security Expo 2012 Attrition Toolbox
Electronic Security Expo 2012 Attrition Toolboxstevespott
 
Napco Better Result
Napco Better ResultNapco Better Result
Napco Better Resultpmoskie
 
Towns Ranked by High School Grad
Towns Ranked by High School GradTowns Ranked by High School Grad
Towns Ranked by High School GradHonolulu Civil Beat
 
The US Housing Market - Housing Supply & Demand
The US Housing Market - Housing Supply & DemandThe US Housing Market - Housing Supply & Demand
The US Housing Market - Housing Supply & DemandAltos Research
 
DENVER MARKET WATCH YEAR END 2009
DENVER MARKET WATCH YEAR END 2009DENVER MARKET WATCH YEAR END 2009
DENVER MARKET WATCH YEAR END 2009Tom Cryer
 
Indicadores a dic 2009
Indicadores a dic 2009Indicadores a dic 2009
Indicadores a dic 2009redasomi
 
Https _doc-0c-78-apps-viewer.googleusercontent
Https  _doc-0c-78-apps-viewer.googleusercontentHttps  _doc-0c-78-apps-viewer.googleusercontent
Https _doc-0c-78-apps-viewer.googleusercontentfoilicj1
 
2012 year-in-review-kiosk
2012 year-in-review-kiosk2012 year-in-review-kiosk
2012 year-in-review-kiosklombardparks
 
Grand Lake OK 2005 2011 full year real estate market analysis
Grand Lake OK 2005   2011 full year real estate market analysisGrand Lake OK 2005   2011 full year real estate market analysis
Grand Lake OK 2005 2011 full year real estate market analysisRE/MAX Grand Lake
 
2011 Poverty Guidelines for CHIP & Children's Medicaid
2011 Poverty Guidelines for CHIP & Children's Medicaid2011 Poverty Guidelines for CHIP & Children's Medicaid
2011 Poverty Guidelines for CHIP & Children's Medicaid100% Campaign
 

Was ist angesagt? (20)

H W 2010 Q1 De 12 Mo
H W 2010 Q1 De 12 MoH W 2010 Q1 De 12 Mo
H W 2010 Q1 De 12 Mo
 
Member tours closing %
Member tours closing %Member tours closing %
Member tours closing %
 
Electronic Security Expo 2012 Attrition Toolbox
Electronic Security Expo 2012 Attrition ToolboxElectronic Security Expo 2012 Attrition Toolbox
Electronic Security Expo 2012 Attrition Toolbox
 
Napco Better Result
Napco Better ResultNapco Better Result
Napco Better Result
 
Towns Ranked by High School Grad
Towns Ranked by High School GradTowns Ranked by High School Grad
Towns Ranked by High School Grad
 
The US Housing Market - Housing Supply & Demand
The US Housing Market - Housing Supply & DemandThe US Housing Market - Housing Supply & Demand
The US Housing Market - Housing Supply & Demand
 
Idle Teens 2000-2009
Idle Teens 2000-2009Idle Teens 2000-2009
Idle Teens 2000-2009
 
Tmo Feb
Tmo FebTmo Feb
Tmo Feb
 
DENVER MARKET WATCH YEAR END 2009
DENVER MARKET WATCH YEAR END 2009DENVER MARKET WATCH YEAR END 2009
DENVER MARKET WATCH YEAR END 2009
 
Indicadores a dic 2009
Indicadores a dic 2009Indicadores a dic 2009
Indicadores a dic 2009
 
2011noviembre diciembre
2011noviembre diciembre2011noviembre diciembre
2011noviembre diciembre
 
ABD Update
ABD UpdateABD Update
ABD Update
 
Https _doc-0c-78-apps-viewer.googleusercontent
Https  _doc-0c-78-apps-viewer.googleusercontentHttps  _doc-0c-78-apps-viewer.googleusercontent
Https _doc-0c-78-apps-viewer.googleusercontent
 
2012 year-in-review-kiosk
2012 year-in-review-kiosk2012 year-in-review-kiosk
2012 year-in-review-kiosk
 
Hawaii Towns Departure Time
Hawaii Towns Departure TimeHawaii Towns Departure Time
Hawaii Towns Departure Time
 
Jan Tmo
Jan TmoJan Tmo
Jan Tmo
 
Grand Lake OK 2005 2011 full year real estate market analysis
Grand Lake OK 2005   2011 full year real estate market analysisGrand Lake OK 2005   2011 full year real estate market analysis
Grand Lake OK 2005 2011 full year real estate market analysis
 
Coldwell Banker C&C Properties Sales Dec 2010
Coldwell Banker C&C Properties Sales Dec 2010Coldwell Banker C&C Properties Sales Dec 2010
Coldwell Banker C&C Properties Sales Dec 2010
 
2011 Poverty Guidelines for CHIP & Children's Medicaid
2011 Poverty Guidelines for CHIP & Children's Medicaid2011 Poverty Guidelines for CHIP & Children's Medicaid
2011 Poverty Guidelines for CHIP & Children's Medicaid
 
Gastos comunes 09 2010 v paraiso
Gastos comunes 09 2010 v paraisoGastos comunes 09 2010 v paraiso
Gastos comunes 09 2010 v paraiso
 

Andere mochten auch

Cahier Des Charges StratéGie Logistique Rrmp Ed V1.1
Cahier Des Charges StratéGie Logistique Rrmp Ed V1.1Cahier Des Charges StratéGie Logistique Rrmp Ed V1.1
Cahier Des Charges StratéGie Logistique Rrmp Ed V1.1educroix
 
Hawaii general election poll questions oct. 11
Hawaii general election poll questions   oct. 11Hawaii general election poll questions   oct. 11
Hawaii general election poll questions oct. 11Honolulu Civil Beat
 
Kauai Hydro - Ballot and Voter Guide
Kauai Hydro - Ballot and Voter GuideKauai Hydro - Ballot and Voter Guide
Kauai Hydro - Ballot and Voter GuideHonolulu Civil Beat
 
10 year gains — percent in poverty
10 year gains — percent in poverty10 year gains — percent in poverty
10 year gains — percent in povertyHonolulu Civil Beat
 
Hawaii Race to the Top Update Jan. 2011
Hawaii Race to the Top Update Jan. 2011Hawaii Race to the Top Update Jan. 2011
Hawaii Race to the Top Update Jan. 2011Honolulu Civil Beat
 
Transformation Hawaii December 2004
Transformation Hawaii December 2004Transformation Hawaii December 2004
Transformation Hawaii December 2004Honolulu Civil Beat
 
10 08-23 complaint for declaratory & injunctive relief
10 08-23 complaint for declaratory & injunctive relief10 08-23 complaint for declaratory & injunctive relief
10 08-23 complaint for declaratory & injunctive reliefHonolulu Civil Beat
 
Civil beat poll sept. 7 8, 2010 mayor crosstabs and toplines
Civil beat poll sept. 7 8, 2010 mayor crosstabs and toplinesCivil beat poll sept. 7 8, 2010 mayor crosstabs and toplines
Civil beat poll sept. 7 8, 2010 mayor crosstabs and toplinesHonolulu Civil Beat
 
Human Trafficking Global Horizons Indictment 9 2-10
Human Trafficking Global Horizons Indictment 9 2-10Human Trafficking Global Horizons Indictment 9 2-10
Human Trafficking Global Horizons Indictment 9 2-10Honolulu Civil Beat
 
Civil beat poll sept. 7 8, 2010 governor crosstabs
Civil beat poll sept. 7 8, 2010 governor crosstabsCivil beat poll sept. 7 8, 2010 governor crosstabs
Civil beat poll sept. 7 8, 2010 governor crosstabsHonolulu Civil Beat
 
Hawaii legislature salaries aug 2010
Hawaii legislature salaries aug 2010Hawaii legislature salaries aug 2010
Hawaii legislature salaries aug 2010Honolulu Civil Beat
 

Andere mochten auch (20)

Ff
FfFf
Ff
 
Cahier Des Charges StratéGie Logistique Rrmp Ed V1.1
Cahier Des Charges StratéGie Logistique Rrmp Ed V1.1Cahier Des Charges StratéGie Logistique Rrmp Ed V1.1
Cahier Des Charges StratéGie Logistique Rrmp Ed V1.1
 
Federal Response August 12
Federal Response August 12Federal Response August 12
Federal Response August 12
 
Lei Ahu Isa
Lei Ahu IsaLei Ahu Isa
Lei Ahu Isa
 
Hawaii general election poll questions oct. 11
Hawaii general election poll questions   oct. 11Hawaii general election poll questions   oct. 11
Hawaii general election poll questions oct. 11
 
Kauai Hydro - Ballot and Voter Guide
Kauai Hydro - Ballot and Voter GuideKauai Hydro - Ballot and Voter Guide
Kauai Hydro - Ballot and Voter Guide
 
Eileen Clarke
Eileen ClarkeEileen Clarke
Eileen Clarke
 
10 year gains — percent in poverty
10 year gains — percent in poverty10 year gains — percent in poverty
10 year gains — percent in poverty
 
Kalihi exec summary
Kalihi exec summaryKalihi exec summary
Kalihi exec summary
 
Hawaii Race to the Top Update Jan. 2011
Hawaii Race to the Top Update Jan. 2011Hawaii Race to the Top Update Jan. 2011
Hawaii Race to the Top Update Jan. 2011
 
2011 march 4
2011 march 42011 march 4
2011 march 4
 
Transformation Hawaii December 2004
Transformation Hawaii December 2004Transformation Hawaii December 2004
Transformation Hawaii December 2004
 
10 08-23 complaint for declaratory & injunctive relief
10 08-23 complaint for declaratory & injunctive relief10 08-23 complaint for declaratory & injunctive relief
10 08-23 complaint for declaratory & injunctive relief
 
Civil beat poll sept. 7 8, 2010 mayor crosstabs and toplines
Civil beat poll sept. 7 8, 2010 mayor crosstabs and toplinesCivil beat poll sept. 7 8, 2010 mayor crosstabs and toplines
Civil beat poll sept. 7 8, 2010 mayor crosstabs and toplines
 
FTA Report 2009
FTA Report 2009FTA Report 2009
FTA Report 2009
 
Human Trafficking Global Horizons Indictment 9 2-10
Human Trafficking Global Horizons Indictment 9 2-10Human Trafficking Global Horizons Indictment 9 2-10
Human Trafficking Global Horizons Indictment 9 2-10
 
Civil beat poll sept. 7 8, 2010 governor crosstabs
Civil beat poll sept. 7 8, 2010 governor crosstabsCivil beat poll sept. 7 8, 2010 governor crosstabs
Civil beat poll sept. 7 8, 2010 governor crosstabs
 
Civil Beat Oct. 23
Civil Beat Oct. 23 Civil Beat Oct. 23
Civil Beat Oct. 23
 
Hawaii legislature salaries aug 2010
Hawaii legislature salaries aug 2010Hawaii legislature salaries aug 2010
Hawaii legislature salaries aug 2010
 
Kiva Micro Enterprise
Kiva   Micro EnterpriseKiva   Micro Enterprise
Kiva Micro Enterprise
 

Ähnlich wie Hawaii Towns Median Rent

School Aid by District (New York State)
School Aid by District (New York State)School Aid by District (New York State)
School Aid by District (New York State)Luis Taveras EMBA, MS
 
Caída Publicidad EEUU 2009
Caída Publicidad EEUU 2009Caída Publicidad EEUU 2009
Caída Publicidad EEUU 2009Juan Varela
 
Rebgv stats package%2_c_october_2011_%282%29
Rebgv stats package%2_c_october_2011_%282%29Rebgv stats package%2_c_october_2011_%282%29
Rebgv stats package%2_c_october_2011_%282%29vancouverhomesteam
 
October 2011 REBGV Stats Mike Stewart
October 2011 REBGV Stats Mike StewartOctober 2011 REBGV Stats Mike Stewart
October 2011 REBGV Stats Mike StewartMike Stewart
 
Rebgv stats package%2_c_october_2011_%282%29
Rebgv stats package%2_c_october_2011_%282%29Rebgv stats package%2_c_october_2011_%282%29
Rebgv stats package%2_c_october_2011_%282%29vancouverhomesteam
 
Vancouver real estate stats package, june 2011
Vancouver real estate stats package, june 2011Vancouver real estate stats package, june 2011
Vancouver real estate stats package, june 2011Matt Collinge
 
Languages Spoken in the Home — 2009 Breakdown
Languages Spoken in the Home — 2009 BreakdownLanguages Spoken in the Home — 2009 Breakdown
Languages Spoken in the Home — 2009 BreakdownHonolulu Civil Beat
 
10.3 2016 investor presentation pea
10.3 2016 investor presentation   pea10.3 2016 investor presentation   pea
10.3 2016 investor presentation peaFalcoCorporate
 
DataLength of StayAgeSexPrincipal Payer Total ChgesRT ChgeImaging
DataLength of StayAgeSexPrincipal Payer Total ChgesRT ChgeImaging DataLength of StayAgeSexPrincipal Payer Total ChgesRT ChgeImaging
DataLength of StayAgeSexPrincipal Payer Total ChgesRT ChgeImaging OllieShoresna
 

Ähnlich wie Hawaii Towns Median Rent (20)

U.S. States Median Rent
U.S. States Median RentU.S. States Median Rent
U.S. States Median Rent
 
School Aid by District (New York State)
School Aid by District (New York State)School Aid by District (New York State)
School Aid by District (New York State)
 
Heart Disease
Heart DiseaseHeart Disease
Heart Disease
 
Educational Attainment by Age
Educational Attainment by AgeEducational Attainment by Age
Educational Attainment by Age
 
Caída Publicidad EEUU 2009
Caída Publicidad EEUU 2009Caída Publicidad EEUU 2009
Caída Publicidad EEUU 2009
 
Houston Market Report August 2010
Houston Market Report August 2010Houston Market Report August 2010
Houston Market Report August 2010
 
Back to-school spending grows as parents restock, replenish children’s needs
Back to-school spending grows as parents restock, replenish children’s needsBack to-school spending grows as parents restock, replenish children’s needs
Back to-school spending grows as parents restock, replenish children’s needs
 
Rebgv stats package%2_c_october_2011_%282%29
Rebgv stats package%2_c_october_2011_%282%29Rebgv stats package%2_c_october_2011_%282%29
Rebgv stats package%2_c_october_2011_%282%29
 
Stats Oct 11
Stats Oct 11Stats Oct 11
Stats Oct 11
 
October 2011 REBGV Stats Mike Stewart
October 2011 REBGV Stats Mike StewartOctober 2011 REBGV Stats Mike Stewart
October 2011 REBGV Stats Mike Stewart
 
Rebgv stats package%2_c_october_2011_%282%29
Rebgv stats package%2_c_october_2011_%282%29Rebgv stats package%2_c_october_2011_%282%29
Rebgv stats package%2_c_october_2011_%282%29
 
Monthly Market Watch - September 2012
Monthly Market Watch - September 2012Monthly Market Watch - September 2012
Monthly Market Watch - September 2012
 
Vancouver real estate stats package, june 2011
Vancouver real estate stats package, june 2011Vancouver real estate stats package, june 2011
Vancouver real estate stats package, june 2011
 
Languages Spoken in the Home — 2009 Breakdown
Languages Spoken in the Home — 2009 BreakdownLanguages Spoken in the Home — 2009 Breakdown
Languages Spoken in the Home — 2009 Breakdown
 
Houston Market Report July 2010
Houston Market Report July 2010Houston Market Report July 2010
Houston Market Report July 2010
 
Toll_23Year
Toll_23YearToll_23Year
Toll_23Year
 
10.3 2016 investor presentation pea
10.3 2016 investor presentation   pea10.3 2016 investor presentation   pea
10.3 2016 investor presentation pea
 
Houston Market Report May 2010
Houston Market Report May 2010Houston Market Report May 2010
Houston Market Report May 2010
 
Charlotte's stats
Charlotte's statsCharlotte's stats
Charlotte's stats
 
DataLength of StayAgeSexPrincipal Payer Total ChgesRT ChgeImaging
DataLength of StayAgeSexPrincipal Payer Total ChgesRT ChgeImaging DataLength of StayAgeSexPrincipal Payer Total ChgesRT ChgeImaging
DataLength of StayAgeSexPrincipal Payer Total ChgesRT ChgeImaging
 

Mehr von Honolulu Civil Beat

Gov. David Ige response to U.S. Rep. Anna Eshoo
Gov. David Ige response to U.S. Rep. Anna EshooGov. David Ige response to U.S. Rep. Anna Eshoo
Gov. David Ige response to U.S. Rep. Anna EshooHonolulu Civil Beat
 
Audit of the Department of the Honolulu Prosecuting Attorney’s Policies, Proc...
Audit of the Department of the Honolulu Prosecuting Attorney’s Policies, Proc...Audit of the Department of the Honolulu Prosecuting Attorney’s Policies, Proc...
Audit of the Department of the Honolulu Prosecuting Attorney’s Policies, Proc...Honolulu Civil Beat
 
Audit of the Honolulu Police Department’s Policies, Procedures, and Controls
Audit of the Honolulu Police Department’s Policies, Procedures, and ControlsAudit of the Honolulu Police Department’s Policies, Procedures, and Controls
Audit of the Honolulu Police Department’s Policies, Procedures, and ControlsHonolulu Civil Beat
 
2019 Use of Force Annual Report HPD
2019 Use of Force Annual Report HPD 2019 Use of Force Annual Report HPD
2019 Use of Force Annual Report HPD Honolulu Civil Beat
 
Office of Health Equity Goals Draft 10
Office of Health Equity Goals Draft 10Office of Health Equity Goals Draft 10
Office of Health Equity Goals Draft 10Honolulu Civil Beat
 
ACLU Letter to HPD regarding racial profiling
ACLU Letter to HPD regarding racial profilingACLU Letter to HPD regarding racial profiling
ACLU Letter to HPD regarding racial profilingHonolulu Civil Beat
 
ACLU Letter to HPD regarding racial profiling
ACLU Letter to HPD regarding racial profilingACLU Letter to HPD regarding racial profiling
ACLU Letter to HPD regarding racial profilingHonolulu Civil Beat
 
Guam Governor's Letter to Pence
Guam Governor's Letter to Pence Guam Governor's Letter to Pence
Guam Governor's Letter to Pence Honolulu Civil Beat
 
List Of Pro Bono Legal Service Providers
List Of Pro Bono Legal Service ProvidersList Of Pro Bono Legal Service Providers
List Of Pro Bono Legal Service ProvidersHonolulu Civil Beat
 
Arbitration Hearing Transcript December 2018
Arbitration Hearing Transcript December 2018Arbitration Hearing Transcript December 2018
Arbitration Hearing Transcript December 2018Honolulu Civil Beat
 

Mehr von Honolulu Civil Beat (20)

Gov. David Ige response to U.S. Rep. Anna Eshoo
Gov. David Ige response to U.S. Rep. Anna EshooGov. David Ige response to U.S. Rep. Anna Eshoo
Gov. David Ige response to U.S. Rep. Anna Eshoo
 
Audit of the Department of the Honolulu Prosecuting Attorney’s Policies, Proc...
Audit of the Department of the Honolulu Prosecuting Attorney’s Policies, Proc...Audit of the Department of the Honolulu Prosecuting Attorney’s Policies, Proc...
Audit of the Department of the Honolulu Prosecuting Attorney’s Policies, Proc...
 
Audit of the Honolulu Police Department’s Policies, Procedures, and Controls
Audit of the Honolulu Police Department’s Policies, Procedures, and ControlsAudit of the Honolulu Police Department’s Policies, Procedures, and Controls
Audit of the Honolulu Police Department’s Policies, Procedures, and Controls
 
2019 Use of Force Annual Report HPD
2019 Use of Force Annual Report HPD 2019 Use of Force Annual Report HPD
2019 Use of Force Annual Report HPD
 
Office of Health Equity Goals Draft 10
Office of Health Equity Goals Draft 10Office of Health Equity Goals Draft 10
Office of Health Equity Goals Draft 10
 
NHPI COVID-19 Statement
NHPI COVID-19 StatementNHPI COVID-19 Statement
NHPI COVID-19 Statement
 
DLIR Response Language Access
DLIR Response Language AccessDLIR Response Language Access
DLIR Response Language Access
 
Language Access Letter To DLIR
Language Access Letter To DLIRLanguage Access Letter To DLIR
Language Access Letter To DLIR
 
ACLU Letter to HPD regarding racial profiling
ACLU Letter to HPD regarding racial profilingACLU Letter to HPD regarding racial profiling
ACLU Letter to HPD regarding racial profiling
 
ACLU Letter to HPD regarding racial profiling
ACLU Letter to HPD regarding racial profilingACLU Letter to HPD regarding racial profiling
ACLU Letter to HPD regarding racial profiling
 
Jane Doe v. Rehab Hospital
Jane Doe v. Rehab HospitalJane Doe v. Rehab Hospital
Jane Doe v. Rehab Hospital
 
Coronavirus HPHA
Coronavirus HPHA Coronavirus HPHA
Coronavirus HPHA
 
OHA Data Request
OHA Data RequestOHA Data Request
OHA Data Request
 
Letter from Palau to Guam
Letter from Palau to GuamLetter from Palau to Guam
Letter from Palau to Guam
 
Guam Governor's Letter to Pence
Guam Governor's Letter to Pence Guam Governor's Letter to Pence
Guam Governor's Letter to Pence
 
OHA Analysis by Akina
OHA Analysis by AkinaOHA Analysis by Akina
OHA Analysis by Akina
 
Case COFA Letter
Case COFA LetterCase COFA Letter
Case COFA Letter
 
List Of Pro Bono Legal Service Providers
List Of Pro Bono Legal Service ProvidersList Of Pro Bono Legal Service Providers
List Of Pro Bono Legal Service Providers
 
Arbitration Hearing Transcript December 2018
Arbitration Hearing Transcript December 2018Arbitration Hearing Transcript December 2018
Arbitration Hearing Transcript December 2018
 
Caldwell Press Release
Caldwell Press ReleaseCaldwell Press Release
Caldwell Press Release
 

Hawaii Towns Median Rent

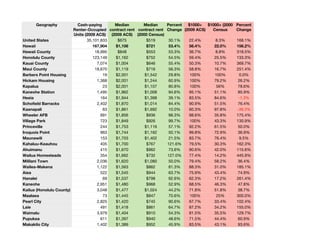
  • 1. Geography Cash-paying Median Median Percent $1000+ $1000+ (2000 Percent Renter-Occupied contract rent contract rent Change (2009 ACS) Census Change Units (2009 ACS) (2009 ACS) (2000 Census) United States 35,101,833 $675 $519 30.1% 22.4% 8.3% 168.1% Hawaii 167,904 $1,106 $721 53.4% 56.4% 22.0% 156.2% Hawaii County 18,995 $848 $553 53.3% 36.7% 8.8% 318.5% Honolulu County 123,149 $1,162 $752 54.5% 59.4% 25.5% 133.3% Kauai County 7,074 $1,004 $646 55.4% 50.3% 10.7% 369.7% Maui County 18,670 $1,119 $716 56.3% 58.8% 16.7% 251.4% Barbers Point Housing 19 $2,001 $1,542 29.8% 100% 100% 0.0% Hickam Housing 1,368 $2,001 $1,244 60.9% 100% 79.2% 26.2% Kapalua 23 $2,001 $1,107 80.8% 100% 56% 78.6% Kaneohe Station 1,495 $1,962 $1,008 94.6% 95.1% 51.1% 85.9% Heeia 164 $1,944 $1,398 39.1% 83.5% 84.6% -1.3% Schofield Barracks 2,402 $1,870 $1,014 84.4% 90.9% 51.5% 76.4% Kaanapali 63 $1,861 $1,692 10.0% 60.3% 97.8% -38.3% Wheeler AFB 691 $1,856 $936 98.3% 98.6% 35.8% 175.4% Village Park 723 $1,849 $926 99.7% 100% 43.3% 130.9% Princeville 244 $1,753 $1,116 57.1% 92.2% 61.5% 50.0% Iroquois Point 963 $1,744 $1,162 50.1% 99.8% 72.9% 36.9% Maunawili 153 $1,703 $1,402 21.5% 83.7% 76.4% 9.5% Kahaluu-Keauhou 405 $1,700 $767 121.6% 79.5% 30.3% 162.3% Ahuimanu 415 $1,670 $962 73.6% 90.6% 42.0% 115.6% Wailua Homesteads 354 $1,662 $732 127.0% 77.4% 14.2% 445.9% Mililani Town 2,036 $1,620 $1,080 50.0% 79.4% 58.2% 36.4% Wailea-Makena 1,122 $1,563 $862 81.3% 88.3% 31.0% 185.1% Aiea 522 $1,545 $944 63.7% 75.9% 43.4% 74.9% Hanalei 69 $1,537 $798 92.6% 62.3% 17.2% 261.4% Kaneohe 2,951 $1,480 $968 52.9% 68.5% 46.3% 47.8% Kailua (Honolulu County) 3,048 $1,477 $1,024 44.2% 71.8% 51.8% 38.7% Maalaea 73 $1,445 $847 70.6% 100% 25% 300.0% Pearl City 2,825 $1,420 $745 90.6% 67.7% 33.4% 102.4% Laie 491 $1,418 $861 64.7% 87.2% 34.2% 155.0% Waimalu 3,979 $1,404 $910 54.3% 81.5% 35.5% 129.7% Pupukea 611 $1,397 $940 48.6% 71.5% 44.4% 60.9% Makakilo City 1,402 $1,389 $952 45.9% 83.5% 43.1% 93.6%
  • 2. Geography Cash-paying Median Median Percent $1000+ $1000+ (2000 Percent Renter-Occupied contract rent contract rent Change (2009 ACS) Census Change Units (2009 ACS) (2009 ACS) (2000 Census) Ewa Gentry 593 $1,355 $869 55.9% 97.3% 31.2% 212.3% Waipio 1,195 $1,349 $837 61.2% 90.0% 19.9% 352.8% Waikoloa Village 561 $1,348 $717 88.0% 80.2% 14.4% 456.2% Poipu 121 $1,313 $912 44.0% 93.4% 36.6% 155.3% Paia 337 $1,311 $701 87.0% 72.4% 24.9% 190.8% Holualoa 1,354 $1,296 $709 82.8% 73.6% 23.4% 213.7% Kaaawa 141 $1,278 $721 77.3% 68.8% 19.0% 261.7% Makawao 935 $1,277 $765 66.9% 75.1% 19.4% 287.5% Kihei 3,827 $1,267 $745 70.1% 74.8% 14.2% 425.6% Hauula 275 $1,260 $719 75.2% 54.9% 14.0% 291.0% Kalihiwai 144 $1,241 $775 60.1% 68.1% 42.4% 60.4% Haliimaile 48 $1,237 $725 70.6% 87.5% 6.5% 1,256.3% Kilauea 223 $1,235 $838 47.4% 74.9% 23.8% 214.0% Kalaoa 719 $1,230 $934 31.7% 67.0% 37.2% 80.2% Kawela Bay 60 $1,227 $878 39.7% 66.7% 29.7% 124.7% Kahaluu 351 $1,213 $737 64.6% 73.8% 17.2% 328.7% Haiku-Pauwela 1,190 $1,204 $783 53.8% 61.8% 17.1% 261.1% Mokuleia 395 $1,203 $837 43.7% 79.2% 36.0% 119.8% Lawai 139 $1,196 $773 54.7% 54.0% 13.7% 294.9% Puako 141 $1,186 $814 45.7% 67.4% 31.8% 112.0% Pukalani 1,104 $1,167 $848 37.6% 64.8% 28.2% 129.3% Waialua 501 $1,143 $537 112.8% 62.7% 12.3% 410.0% Kapaa 1,151 $1,137 $645 76.3% 61.5% 5.6% 989.3% Napili-Honokowai 1,520 $1,122 $801 40.1% 58.4% 19.7% 196.6% Waihee-Waiehu 390 $1,121 $601 86.5% 53.6% 21.8% 145.6% Waipio Acres 859 $1,111 $689 61.2% 66.0% 17.2% 283.3% Halawa 1,535 $1,103 $785 40.5% 56.2% 36.8% 52.6% Honalo 263 $1,103 $680 62.2% 57.8% 11.1% 421.9% Kalaheo 551 $1,103 $618 78.5% 57.2% 14.2% 302.9% Waimea (Hawaii County) 992 $1,063 $737 44.2% 53.6% 18.0% 197.2% Captain Cook 366 $1,013 $566 79.0% 51.6% 9.3% 457.7% Honolulu 69,591 $1,010 $721 40.1% 50.6% 21.3% 137.8% Kailua (Hawaii County) 2,150 $1,009 $632 59.7% 51.0% 11.8% 334.0%
  • 3. Geography Cash-paying Median Median Percent $1000+ $1000+ (2000 Percent Renter-Occupied contract rent contract rent Change (2009 ACS) Census Change Units (2009 ACS) (2009 ACS) (2000 Census) Anahola 105 $1,003 $671 49.5% 50.5% 15.8% 219.7% Wailua 330 $996 $754 32.1% 49.1% 7.1% 589.6% Omao 144 $990 $775 27.7% 48.6% 21.9% 121.7% Ewa Beach 985 $986 $835 18.1% 47.9% 28.3% 69.3% Puhi 38 $986 $636 55.0% 44.7% 6.0% 651.6% Makaha Valley 331 $982 $587 67.3% 43.8% 0% Nanakuli 649 $978 $670 46.0% 45.6% 6.0% 664.7% Lahaina 1,327 $964 $773 24.7% 47.9% 25.6% 87.1% Waikapu 64 $943 $670 40.7% 37.5% 14.7% 155.0% Haleiwa 520 $942 $639 47.4% 47.3% 13.2% 257.6% Makaha 1,225 $941 $627 50.1% 41.6% 7.7% 440.2% Papaikou 163 $940 $448 109.8% 33.7% 0% Halaula 53 $936 $578 61.9% 41.5% 0% Kaunakakai 305 $925 $478 93.5% 43.6% 0.7% 6,550.0% Waimanalo 401 $906 $586 54.6% 40.6% 12.4% 227.4% Punaluu 176 $896 $713 25.7% 32.4% 13.0% 148.7% Waipahu 3,114 $893 $593 50.6% 39.6% 11.8% 234.4% Whitmore Village 209 $890 $622 43.1% 29.7% 14.4% 105.4% Hanamaulu 456 $882 $596 48.0% 46.9% 1.5% 3,081.8% Hawaiian Beaches 356 $882 $528 67.0% 41.6% 0% Leilani Estates 75 $858 $533 61.0% 42.7% 0% Wailuku 1,689 $854 $587 45.5% 39.8% 8.8% 351.6% Waimea (Kauai County) 186 $854 $532 60.5% 24.7% 0% Ainaloa 200 $846 $547 54.7% 29% 0% Kekaha 378 $834 $512 62.9% 27.5% 5.3% 419.5% Hawaiian Paradise Park 594 $828 $548 51.1% 13.1% 0% Honomu 44 $820 $518 58.3% 22.7% 0% Kualapuu 66 $820 $550 49.1% 36.4% 0% Nanawale Estates 120 $791 $496 59.5% 10.8% 0% Hawi 73 $788 $598 31.8% 38.4% 4.1% 833.3% Wahiawa 2,341 $785 $581 35.1% 33.7% 6.0% 460.6% Wainaku 98 $775 $600 29.2% 30.6% 9.4% 226.5% Kahului 2,217 $770 $600 28.3% 31.3% 6.7% 363.4%
  • 4. Geography Cash-paying Median Median Percent $1000+ $1000+ (2000 Percent Renter-Occupied contract rent contract rent Change (2009 ACS) Census Change Units (2009 ACS) (2009 ACS) (2000 Census) Koloa 315 $769 $442 74.0% 40% 1.7% 2,233.3% Hana 26 $767 $617 24.3% 34.6% 4.4% 678.8% Honaunau-Napoopoo 321 $765 $565 35.4% 40.8% 10% 308.1% Hilo 5,941 $764 $489 56.2% 23.8% 3.3% 622.6% Maili 550 $760 $667 13.9% 40.5% 13.2% 207.3% Lihue 887 $759 $670 13.3% 30.1% 7.6% 295.8% Waianae 686 $743 $538 38.1% 33.2% 13.7% 143.1% Mountain View 263 $735 $522 40.8% 32.7% 0% Paukaa 50 $725 $708 2.4% 16% 9.4% 70.7% Kapaau 147 $719 $654 9.9% 21.8% 6.4% 241.0% Paauilo 51 $719 $375 91.7% 3.9% 0% Laupahoehoe 35 $705 $544 29.6% 25.7% 0% Hanapepe 305 $687 $600 14.5% 25.9% 1.5% 1,575.0% Eleele 134 $677 $379 78.6% 38.1% 0% Naalehu 106 $677 $277 144.4% 3.8% 0% Hawaiian Acres 123 $675 $526 28.3% 4.9% 0% Orchidlands Estates 180 $674 $473 42.5% 14.4% 0% Fern Acres 70 $663 $235 182.1% 14.3% 0% Hawaiian Ocean View 184 $646 $395 63.5% 10.9% 0% Honokaa 226 $633 $502 26.1% 14.6% 0% Volcano 260 $622 $523 18.9% 4.2% 2.2% 92.5% Maunaloa 80 $620 $551 12.5% 0% 0% Waimanalo Beach 166 $577 $843 -31.6% 27.7% 33.1% -16.3% Pahala 147 $557 $314 77.4% 5.4% 0% Waikane 55 $538 $525 2.5% 34.5% 21.2% 63.3% Kealakekua 337 $527 $409 28.9% 23.7% 2.7% 790.2% Kurtistown 101 $513 $560 -8.4% 5.0% 0% Kahuku 244 $477 $246 93.9% 16.8% 7.3% 130.0% Fern Forest 73 $457 $275 66.2% 0% 0% Ewa Villages 226 $436 $169 158.0% 23.9% 0% Pahoa 57 $434 $387 12.1% 0% 0% Keaau 169 $429 $439 -2.3% 7.1% 0.8% 773.4% Eden Roc 44 $425 $99 329.3% 0% 0%
  • 5. Geography Cash-paying Median Median Percent $1000+ $1000+ (2000 Percent Renter-Occupied contract rent contract rent Change (2009 ACS) Census Change Units (2009 ACS) (2009 ACS) (2000 Census) Lanai City 351 $350 $330 6.1% 14.8% 0% Pepeekeo 218 $221 $216 2.3% 6.9% 2.9% 133.9% Kaumakani 228 $173 $140 23.6% 3.5% 3.0% 17.5% Pakala Village 87 $138 $99 39.4% 9.2% 0% Kukuihaele 6 $0 $538 -100.0% 0% 0%