Hawaii Towns Departure Time
•
0 gefällt mir•138 views

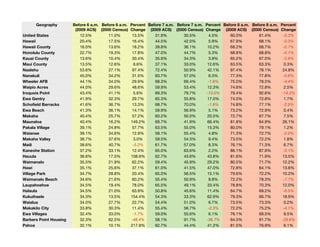
The document provides data on the percentage of residents in various Hawaiian geographies who leave for work before 6 AM, 7 AM and 8 AM according to 2009 and 2000 census data. It shows that many rural areas on the islands have seen increases in the percentage of early risers over the past decade, some rising by over 100%, while some military areas have decreased. Honolulu County continues to have the highest percentage of early starters for work among the counties.

Empfohlen
Weitere ähnliche Inhalte
Andere mochten auch
Andere mochten auch (20)
Ähnlich wie Hawaii Towns Departure Time
Ähnlich wie Hawaii Towns Departure Time (20)
Mehr von Honolulu Civil Beat
Mehr von Honolulu Civil Beat (20)
Hawaii Towns Departure Time
- 1. Geography Before 6 a.m. Before 6 a.m. Percent Before 7 a.m. Before 7 a.m. Percent Before 8 a.m. Before 8 a.m. Percent (2009 ACS) (2000 Census) Change (2009 ACS) (2000 Census) Change (2009 ACS) (2000 Census) Change United States 12.5% 11.0% 13.5% 31.9% 30.5% 4.5% 60.0% 61.4% -2.3% Hawaii 20.4% 17.5% 16.4% 44.5% 42.0% 5.9% 67.9% 68.1% -0.3% Hawaii County 16.0% 13.6% 18.2% 39.8% 36.1% 10.2% 68.2% 68.7% -0.7% Honolulu County 22.7% 19.3% 17.8% 47.0% 44.7% 5.3% 68.8% 68.8% -0.1% Kauai County 13.6% 10.4% 30.4% 35.6% 34.3% 3.9% 65.2% 67.0% -2.8% Maui County 13.5% 12.6% 6.6% 37.1% 33.0% 12.6% 63.5% 63.3% 0.3% Naalehu 53.6% 27.1% 97.4% 72.4% 50.9% 42.1% 97.4% 78.1% 24.8% Nanakuli 45.0% 34.2% 31.5% 60.7% 57.0% 6.3% 77.3% 77.8% -0.6% Wheeler AFB 44.1% 34.0% 29.9% 68.3% 69.4% -1.6% 75.0% 78.5% -4.4% Waipio Acres 44.0% 29.6% 48.6% 59.9% 53.4% 12.3% 74.6% 72.8% 2.5% Iroquois Point 43.4% 41.1% 5.6% 69.3% 79.7% -13.0% 79.4% 92.6% -14.2% Ewa Gentry 41.9% 32.3% 29.7% 65.3% 55.8% 17.0% 74.0% 72.8% 1.7% Schofield Barracks 41.6% 36.7% 13.3% 68.7% 70.0% -1.8% 74.8% 77.1% -2.9% Ewa Beach 41.3% 36.1% 14.1% 59.9% 56.9% 5.1% 73.2% 72.9% 0.4% Makaha 40.4% 25.7% 57.2% 60.2% 50.0% 20.5% 72.7% 67.7% 7.5% Maunaloa 40.4% 16.2% 149.2% 69.7% 41.9% 66.4% 81.8% 64.9% 26.1% Pakala Village 39.1% 24.8% 57.7% 63.5% 55.0% 15.3% 80.0% 79.1% 1.2% Waianae 39.1% 34.6% 12.9% 58.1% 55.4% 4.8% 71.3% 72.7% -2.0% Makaha Valley 38.7% 37.6% 3.0% 59.5% 54.3% 9.4% 73.5% 72.2% 1.8% Maili 38.6% 40.7% -5.2% 61.7% 57.0% 8.3% 76.1% 71.3% 6.7% Kaneohe Station 37.2% 33.1% 12.4% 65.0% 63.6% 2.2% 86.1% 87.9% -2.1% Hauula 36.6% 17.5% 108.9% 62.7% 43.6% 43.8% 81.6% 71.9% 13.5% Waimanalo 35.5% 21.9% 62.2% 59.4% 45.9% 29.2% 80.5% 71.7% 12.2% Hawi 35.1% 25.6% 37.1% 61.0% 41.5% 47.0% 72.8% 64.1% 13.6% Village Park 34.7% 28.8% 20.4% 65.0% 56.5% 15.1% 79.6% 72.2% 10.2% Waimanalo Beach 34.6% 21.6% 60.2% 55.4% 50.9% 8.8% 72.2% 78.3% -7.7% Laupahoehoe 34.5% 19.4% 78.0% 65.5% 49.1% 33.4% 78.8% 70.3% 12.0% Halaula 34.5% 21.0% 63.9% 50.8% 45.6% 11.4% 64.7% 69.2% -6.5% Kukuihaele 34.3% 13.5% 154.4% 54.3% 33.3% 62.9% 79.3% 66.7% 18.9% Waialua 34.0% 27.7% 22.7% 54.4% 51.0% 6.7% 73.5% 73.3% 0.2% Makakilo City 33.8% 30.3% 11.4% 55.4% 56.7% -2.3% 72.2% 75.2% -4.1% Ewa Villages 32.4% 33.0% -1.7% 59.0% 55.6% 6.1% 76.1% 69.5% 9.5% Barbers Point Housing 32.3% 62.5% -48.4% 58.1% 91.7% -36.7% 64.5% 91.7% -29.6% Pahoa 32.1% 10.1% 217.8% 62.7% 44.4% 41.2% 81.5% 76.9% 6.1%
- 2. Geography Before 6 a.m. Before 6 a.m. Percent Before 7 a.m. Before 7 a.m. Percent Before 8 a.m. Before 8 a.m. Percent (2009 ACS) (2000 Census) Change (2009 ACS) (2000 Census) Change (2009 ACS) (2000 Census) Change Waipahu 31.8% 29.1% 9.4% 55.4% 51.2% 8.2% 70.4% 69.9% 0.7% Wahiawa 31.5% 32.3% -2.2% 54.1% 54.0% 0.3% 71.1% 72.6% -2.1% Hawaiian Ocean View 31.1% 27.2% 14.0% 62.7% 59.1% 6.2% 75.2% 80.7% -6.8% Paauilo 30.6% 19.3% 58.5% 51.9% 44.3% 17.1% 75.2% 60.8% 23.5% Whitmore Village 30.5% 22.4% 36.6% 52.7% 48.1% 9.7% 71.8% 64.1% 11.9% Waipio 29.3% 24.7% 18.8% 54.7% 54.5% 0.3% 74.5% 71.8% 3.8% Honokaa 28.1% 21.2% 32.8% 56.9% 52.3% 8.8% 74.7% 73.5% 1.6% Kapaau 27.7% 14.4% 92.3% 50.9% 42.7% 19.3% 71.5% 64.9% 10.1% Nanawale Estates 27.1% 24.8% 9.3% 49.7% 49.0% 1.4% 66.3% 75.2% -11.8% Haliimaile 26.6% 25.5% 4.2% 48.2% 52.2% -7.7% 77.6% 77.0% 0.7% Pearl City 26.6% 21.1% 25.8% 55.5% 54.0% 2.7% 76.2% 75.2% 1.4% Pahala 26.3% 18.5% 42.7% 59.3% 49.6% 19.7% 85.7% 79.4% 7.9% Mililani Town 25.8% 26.9% -4.2% 49.2% 52.7% -6.7% 69.5% 74.4% -6.6% Mokuleia 25.4% 28.5% -10.7% 44.7% 54.9% -18.6% 67.0% 71.8% -6.8% Pepeekeo 25.0% 13.4% 86.7% 47.7% 40.6% 17.5% 72.7% 69.3% 4.8% Haleiwa 24.9% 26.8% -7.3% 40.1% 42.9% -6.6% 57.6% 62.0% -7.1% Kaumakani 24.9% 13.5% 84.2% 41.4% 54.0% -23.3% 66.3% 77.0% -13.9% Punaluu 24.7% 16.3% 51.1% 43.8% 42.6% 2.6% 60.3% 65.7% -8.3% Keaau 24.2% 15.3% 58.5% 46.1% 41.9% 9.9% 74.0% 76.5% -3.2% Kaaawa 24.0% 25.0% -4.1% 51.3% 50.8% 0.9% 68.1% 73.2% -7.0% Kahuku 23.3% 24.7% -5.7% 46.1% 48.1% -4.0% 71.8% 73.3% -2.0% Hanapepe 23.2% 15.2% 53.0% 48.1% 45.2% 6.3% 70.2% 72.4% -3.1% Eden Roc 23.0% 55.2% -58.3% 39.0% 74.0% -47.3% 59.2% 93.8% -36.9% Fern Forest 22.6% 10.4% 117.2% 50.5% 39.3% 28.4% 81.7% 69.4% 17.8% Mountain View 22.5% 11.0% 105.4% 49.3% 41.1% 20.1% 74.0% 63.9% 15.7% Kahaluu 22.4% 18.9% 18.4% 49.8% 59.2% -16.0% 72.1% 75.2% -4.1% Hanamaulu 22.2% 9.7% 128.8% 44.2% 29.5% 49.8% 73.5% 63.4% 16.0% Honaunau-Napoopoo 21.8% 10.7% 104.7% 46.3% 38.4% 20.5% 68.3% 72.4% -5.6% Ahuimanu 21.3% 18.1% 17.8% 48.3% 51.7% -6.7% 68.7% 76.2% -9.8% Kaneohe 21.1% 16.9% 25.0% 50.1% 46.4% 8.0% 74.6% 72.7% 2.6% Halawa 20.8% 16.5% 25.8% 49.9% 48.7% 2.6% 68.9% 72.9% -5.5% Kealakekua 20.6% 10.4% 99.2% 42.0% 32.5% 29.2% 64.2% 68.5% -6.3% Kaunakakai 19.8% 11.1% 77.7% 48.7% 41.4% 17.6% 71.3% 75.2% -5.2% Aiea 19.5% 15.7% 24.3% 52.0% 49.5% 5.0% 72.9% 72.1% 1.1%
- 3. Geography Before 6 a.m. Before 6 a.m. Percent Before 7 a.m. Before 7 a.m. Percent Before 8 a.m. Before 8 a.m. Percent (2009 ACS) (2000 Census) Change (2009 ACS) (2000 Census) Change (2009 ACS) (2000 Census) Change Waimalu 19.2% 17.2% 11.9% 48.0% 52.5% -8.7% 71.7% 74.9% -4.2% Honalo 19.0% 8.8% 116.3% 43.9% 32.7% 34.4% 70.5% 69.6% 1.3% Waikane 18.9% 17.8% 6.3% 31.1% 53.0% -41.4% 59.8% 81.8% -26.9% Fern Acres 18.8% 14.3% 31.8% 48.2% 37.6% 28.2% 66.8% 77.4% -13.7% Kawela Bay 18.3% 11.5% 59.6% 39.2% 22.9% 71.0% 60.1% 46.3% 29.8% Koloa 18.3% 12.0% 53.0% 31.3% 31.4% -0.2% 55.9% 58.4% -4.2% Papaikou 18.2% 18.7% -2.3% 31.8% 43.8% -27.3% 68.7% 79.5% -13.5% Puhi 18.2% 14.5% 25.4% 42.7% 41.4% 3.3% 75.0% 68.0% 10.2% Heeia 18.1% 15.7% 15.3% 46.4% 45.4% 2.2% 74.5% 71.6% 4.1% Kekaha 18.0% 16.6% 8.6% 48.2% 49.1% -1.9% 71.9% 77.2% -6.9% Eleele 17.9% 15.8% 13.3% 48.9% 48.6% 0.8% 81.4% 80.4% 1.2% Pupukea 17.9% 19.4% -7.8% 24.5% 35.7% -31.4% 46.5% 58.7% -20.8% Hickam Housing 17.9% 10.1% 76.0% 40.2% 38.1% 5.5% 86.6% 81.9% 5.8% Anahola 17.3% 11.4% 52.7% 39.1% 39.8% -1.7% 62.5% 72.2% -13.4% Waihee-Waiehu 17.2% 16.1% 7.2% 50.3% 41.2% 22.0% 75.8% 70.3% 7.8% Kahului 17.1% 14.2% 20.3% 42.1% 34.9% 20.6% 70.0% 66.0% 6.1% Hawaiian Acres 16.7% 4.6% 260.5% 44.2% 48.5% -8.8% 74.2% 72.7% 2.1% Kurtistown 16.7% 13.3% 25.3% 36.8% 39.9% -7.9% 71.2% 75.4% -5.6% Volcano 16.6% 9.8% 69.1% 31.2% 33.3% -6.3% 60.9% 66.6% -8.6% Wailua 16.3% 6.7% 145.0% 33.5% 35.7% -6.4% 63.5% 65.4% -3.0% Captain Cook 15.9% 9.2% 73.4% 36.4% 37.3% -2.3% 64.7% 75.9% -14.8% Ainaloa 15.9% 20.0% -20.5% 46.5% 43.6% 6.5% 74.0% 65.6% 12.8% Lihue 15.8% 7.6% 109.0% 24.6% 24.4% 0.8% 56.1% 70.5% -20.4% Paia 15.2% 15.2% 0.4% 35.7% 37.3% -4.2% 62.2% 67.2% -7.5% Kailua (Honolulu County) 15.2% 14.2% 7.1% 42.7% 40.8% 4.6% 68.6% 68.2% 0.6% Haiku-Pauwela 14.9% 14.3% 4.6% 36.1% 34.9% 3.4% 59.7% 63.0% -5.2% Orchidlands Estates 14.7% 13.0% 13.0% 44.3% 31.6% 40.3% 63.4% 70.6% -10.2% Pukalani 14.6% 15.5% -5.7% 47.7% 36.2% 31.7% 74.1% 74.5% -0.6% Kalaoa 14.6% 12.9% 12.6% 35.9% 33.1% 8.7% 65.8% 60.4% 9.0% Omao 14.5% 11.3% 28.8% 34.5% 34.9% -1.1% 57.9% 59.5% -2.7% Kualapuu 14.5% 11.8% 23.4% 39.7% 38.6% 2.9% 73.9% 78.5% -5.9% Waimea (Hawaii County) 14.5% 16.7% -13.2% 36.2% 38.5% -6.0% 58.0% 68.2% -15.0% Hawaiian Beaches 14.1% 20.8% -32.2% 50.0% 44.3% 12.8% 75.3% 72.0% 4.6% Wailuku 14.0% 10.7% 30.4% 36.5% 33.2% 10.2% 69.0% 69.1% -0.3%
- 4. Geography Before 6 a.m. Before 6 a.m. Percent Before 7 a.m. Before 7 a.m. Percent Before 8 a.m. Before 8 a.m. Percent (2009 ACS) (2000 Census) Change (2009 ACS) (2000 Census) Change (2009 ACS) (2000 Census) Change Honolulu 13.4% 12.1% 10.7% 36.8% 33.8% 8.6% 62.3% 62.2% 0.2% Hawaiian Paradise Park 13.2% 15.8% -16.4% 42.8% 45.3% -5.6% 67.5% 73.7% -8.4% Waimea (Kauai County) 13.2% 13.2% 0.2% 39.6% 38.1% 4.0% 64.0% 71.1% -9.9% Kailua (Hawaii County) 13.1% 13.2% -0.7% 38.6% 33.1% 16.5% 63.4% 63.3% 0.2% Kihei 12.9% 13.2% -2.4% 36.1% 31.6% 14.2% 59.4% 58.0% 2.4% Lawai 12.7% 11.8% 7.7% 33.9% 40.0% -15.2% 62.4% 68.8% -9.4% Leilani Estates 12.5% 12.7% -2.1% 44.4% 41.7% 6.5% 63.2% 72.6% -12.9% Laie 12.2% 10.7% 13.9% 24.3% 25.4% -4.2% 49.6% 43.9% 12.8% Wainaku 12.0% 15.8% -23.9% 30.9% 36.8% -16.0% 71.0% 69.4% 2.4% Hilo 11.8% 10.3% 14.4% 34.7% 30.8% 12.4% 69.8% 70.6% -1.1% Maunawili 11.1% 9.4% 17.3% 47.5% 43.7% 8.6% 71.3% 69.6% 2.4% Wailea-Makena 10.9% 9.0% 21.0% 26.5% 25.7% 3.0% 54.3% 51.0% 6.5% Lahaina 10.8% 10.8% -0.0% 28.7% 23.9% 20.1% 50.6% 53.8% -5.9% Kahaluu-Keauhou 10.7% 4.7% 126.7% 34.9% 34.7% 0.9% 61.2% 62.1% -1.4% Waikoloa Village 10.7% 15.9% -33.1% 39.5% 33.1% 19.2% 69.1% 56.8% 21.8% Honomu 10.6% 16.2% -34.6% 47.1% 43.9% 7.2% 69.3% 71.1% -2.5% Holualoa 10.0% 12.1% -17.0% 32.1% 25.9% 23.9% 59.0% 57.2% 3.2% Makawao 9.9% 11.7% -15.2% 33.5% 36.6% -8.5% 62.6% 67.3% -7.0% Poipu 9.7% 10.5% -7.6% 31.2% 31.7% -1.6% 60.7% 60.1% 1.1% Paukaa 9.0% 10.2% -12.1% 34.8% 18.8% 85.8% 74.7% 58.5% 27.7% Kapaa 8.8% 9.8% -10.3% 29.7% 32.6% -8.9% 62.7% 65.5% -4.2% Lanai City 8.0% 15.5% -48.4% 33.9% 33.6% 0.8% 56.6% 63.9% -11.5% Kaanapali 7.9% 11.1% -28.6% 14.1% 22.5% -37.4% 50.0% 42.6% 17.4% Waikapu 7.6% 13.7% -44.9% 38.5% 34.9% 10.2% 71.9% 72.5% -0.8% Wailua Homesteads 7.4% 6.1% 21.3% 31.6% 24.9% 26.9% 68.3% 61.5% 11.1% Kalihiwai 7.3% 8.5% -13.6% 19.5% 28.5% -31.7% 47.9% 58.6% -18.3% Napili-Honokowai 6.7% 9.9% -32.5% 22.4% 21.6% 3.4% 49.3% 44.3% 11.2% Princeville 6.3% 10.6% -40.1% 24.1% 28.3% -14.9% 46.2% 54.4% -15.1% Kilauea 5.9% 7.4% -20.1% 24.1% 22.0% 9.6% 50.3% 52.8% -4.8% Puako 5.7% 8.0% -29.5% 24.4% 19.3% 26.2% 43.8% 39.6% 10.4% Kalaheo 5.4% 12.5% -56.7% 43.1% 45.9% -6.1% 69.4% 71.6% -3.1% Hanalei 3.3% 3.5% -5.4% 15.4% 14.4% 7.3% 49.2% 53.5% -8.0% Hana 3.1% 13.3% -77.1% 29.0% 36.7% -20.9% 63.7% 68.7% -7.2% Kapalua 1.4% 1.9% -26.8% 11.3% 35.9% -68.6% 40.1% 63.5% -36.7%
- 5. Geography Before 6 a.m. Before 6 a.m. Percent Before 7 a.m. Before 7 a.m. Percent Before 8 a.m. Before 8 a.m. Percent (2009 ACS) (2000 Census) Change (2009 ACS) (2000 Census) Change (2009 ACS) (2000 Census) Change Maalaea 0.0% 4.7% -100.0% 9.3% 27.6% -66.3% 32.6% 57.2% -43.1%