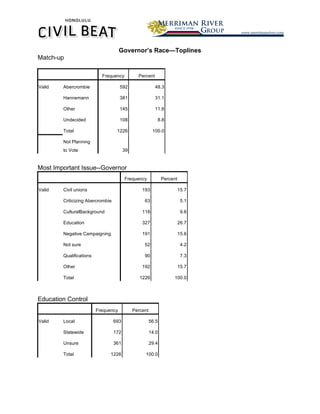
1. Governor’s Race—Toplines
Match-up
Frequency Percent
Valid Abercrombie 592 48.3
Hannemann 381 31.1
Other 145 11.8
Undecided 108 8.8
Total 1226 100.0
Not Planning
to Vote 39
Most Important Issue--Governor
Frequency Percent
Valid Civil unions 193 15.7
Criticizing Abercrombie 63 5.1
CulturalBackground 118 9.6
Education 327 26.7
Negative Campaigning 191 15.6
Not sure 52 4.2
Qualifications 90 7.3
Other 192 15.7
Total 1226 100.0
Education Control
Frequency Percent
Valid Local 693 56.5
Statewide 172 14.0
Unsure 361 29.4
Total 1226 100.0
2. Bring Civil Unions Back up in Legislature
Frequency Percent
Valid Yes 495 39.1
No 565 44.7
Not sure 205 16.2
Total 1265 100.0
Obama Job Performance
Frequency Percent
Valid approve strongly 504 39.8
approve somewhat 294 23.2
disapprove somewhat 106 8.4
disapprove strongly 247 19.5
unsure 114 9.0
Total 1265 100.0
Gender
Frequency Percent
Valid Female 741 60.5
Male 484 39.5
Total 1225 100.0
No Response 40
Total 1265
2
3. Party ID
Frequency Percent
Valid Democrat 638 52.3
Republican 194 15.9
Independent 297 24.3
Unsure 92 7.5
Total 1221 100.0
No Response 44
Total 1265
Tea Party
Frequency Percent
Valid Yes 133 11.0
No 848 69.9
Not Sure 233 19.2
Total 1214 100.0
No Response 51
Total 1265
3
4. Race
Frequency Percent
Valid Asian 409 34.4
White 464 39.0
Pacific Islander 141 11.8
Hispanic 14 1.2
African American 8 .7
Two or more 154 12.9
Total 1190 100.0
No Response 75
Total 1265
Religion
Frequency Valid Percent
Valid Catholic 255 21.9
Evangelical 141 12.1
Other Christian 246 21.1
Mormon 53 4.6
Buddhist 111 9.5
Jewish 16 1.4
None 220 18.9
Other 122 10.5
Total 1164 100.0
No Response 101
Total 1265
4
5. Political Orientation
Political_Orient
Cumulative
Frequency Percent Valid Percent Percent
Valid liberal 333 26.3 28.9 28.9
moderate 369 29.2 32.1 61.0
conservative 299 23.6 26.0 87.0
Unsure 150 11.9 13.0 100.0
Total 1151 91.0 100.0
No Response 114 9.0
Total 1265 100.0
5