Civil Beat Poll October 2018 — Constitutional Convention:
•
1 gefällt mir•580 views

Civil Beat Poll October 2018 — Constitutional Convention:

Empfohlen
Empfohlen
Weitere ähnliche Inhalte
Was ist angesagt?
Was ist angesagt? (20)
Ähnlich wie Civil Beat Poll October 2018 — Constitutional Convention:
Ähnlich wie Civil Beat Poll October 2018 — Constitutional Convention: (20)
Mehr von Honolulu Civil Beat
Mehr von Honolulu Civil Beat (20)
Kürzlich hochgeladen
Kürzlich hochgeladen (13)
Civil Beat Poll October 2018 — Constitutional Convention:
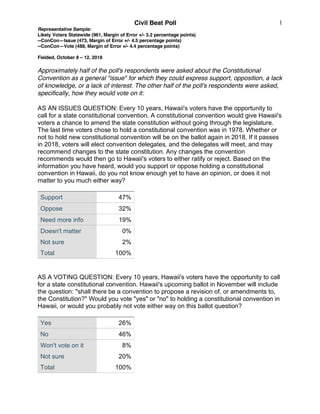
- 1. Civil Beat Poll Representative Sample: Likely Voters Statewide (961, Margin of Error +/- 3.2 percentage points) --ConCon—Issue (473, Margin of Error +/- 4.5 percentage points) --ConCon—Vote (488, Margin of Error +/- 4.4 percentage points) Fielded, October 8 – 12, 2018 1 Approximately half of the poll's respondents were asked about the Constitutional Convention as a general "issue" for which they could express support, opposition, a lack of knowledge, or a lack of interest. The other half of the poll's respondents were asked, specifically, how they would vote on it: AS AN ISSUES QUESTION: Every 10 years, Hawaii's voters have the opportunity to call for a state constitutional convention. A constitutional convention would give Hawaii's voters a chance to amend the state constitution without going through the legislature. The last time voters chose to hold a constitutional convention was in 1978. Whether or not to hold new constitutional convention will be on the ballot again in 2018. If it passes in 2018, voters will elect convention delegates, and the delegates will meet, and may recommend changes to the state constitution. Any changes the convention recommends would then go to Hawaii's voters to either ratify or reject. Based on the information you have heard, would you support or oppose holding a constitutional convention in Hawaii, do you not know enough yet to have an opinion, or does it not matter to you much either way? Support 47% Oppose 32% Need more info 19% Doesn't matter 0% Not sure 2% Total 100% AS A VOTING QUESTION: Every 10 years, Hawaii's voters have the opportunity to call for a state constitutional convention. Hawaii's upcoming ballot in November will include the question: "shall there be a convention to propose a revision of, or amendments to, the Constitution?" Would you vote "yes" or "no" to holding a constitutional convention in Hawaii, or would you probably not vote either way on this ballot question? Yes 26% No 46% Won't vote on it 8% Not sure 20% Total 100%
- 2. Civil Beat Poll Representative Sample: Likely Voters Statewide (961, Margin of Error +/- 3.2 percentage points) --ConCon—Issue (473, Margin of Error +/- 4.5 percentage points) --ConCon—Vote (488, Margin of Error +/- 4.4 percentage points) Fielded, October 8 – 12, 2018 2 CROSSTABS—ConCon Issue Male Female Support 50% 44% Oppose 33% 30% Need info 14% 23% Does not matter 0% 1% Unsure 2% 2% Total 100% 100% Under 50 50 or Older Support 56% 45% Oppose 24% 36% Need info 20% 17% Does not matter 0% 0% Unsure 1% 3% Total 100% 100% Caucasian Japanese Filipino Hawaiian Chinese Hispanic Other/Mixed Support 47% 42% 30% 58% 50% 39% 55% Oppose 28% 43% 33% 27% 25% 39% 30% Need info 24% 14% 27% 8% 20% 22% 13% Does not matter 0% 0% 3% 0% 0% 0% 0% Unsure 2% 2% 7% 6% 5% 0% 1% Total 100% 100% 100% 100% 100% 100% 100%
- 3. Civil Beat Poll Representative Sample: Likely Voters Statewide (961, Margin of Error +/- 3.2 percentage points) --ConCon—Issue (473, Margin of Error +/- 4.5 percentage points) --ConCon—Vote (488, Margin of Error +/- 4.4 percentage points) Fielded, October 8 – 12, 2018 3 Liberal/progressive Moderate Conservative Support 52% 39% 48% Oppose 34% 38% 33% Need info 13% 21% 18% Does not matter 0% 0% 0% Unsure 2% 2% 1% Total 100% 100% 100% Democrat Republican Independent Support 50% 38% 49% Oppose 34% 36% 25% Need info 13% 25% 23% Does not matter 0% 0% 0% Unsure 2% 1% 3% Total 100% 100% 100% College Degree No college Degree Support 42% 56% Oppose 38% 24% Need info 18% 17% Does not matter 0% 0% Unsure 1% 3% Total 100% 100%
- 4. Civil Beat Poll Representative Sample: Likely Voters Statewide (961, Margin of Error +/- 3.2 percentage points) --ConCon—Issue (473, Margin of Error +/- 4.5 percentage points) --ConCon—Vote (488, Margin of Error +/- 4.4 percentage points) Fielded, October 8 – 12, 2018 4 Less than $50,000 $50,000 - $100,000 More than $100,000 Support 64% 52% 39% Oppose 21% 31% 42% Need info 11% 16% 19% Does not matter 0% 0% 0% Unsure 3% 1% 1% Total 100% 100% 100% Oahu_1 Oahu_2 Hawaii Maui Kauai Support 54% 49% 35% 35% 33% Oppose 27% 31% 36% 39% 49% Need info 17% 19% 26% 24% 15% Does not matter 0% 0% 0% 0% 0% Unsure 3% 1% 4% 2% 3% Total 100% 100% 100% 100% 100%
- 5. Civil Beat Poll Representative Sample: Likely Voters Statewide (961, Margin of Error +/- 3.2 percentage points) --ConCon—Issue (473, Margin of Error +/- 4.5 percentage points) --ConCon—Vote (488, Margin of Error +/- 4.4 percentage points) Fielded, October 8 – 12, 2018 5 CROSSTABS—ConCon Vote Male Female Yes 22% 29% No 55% 39% Will not vote 12% 5% Unsure 12% 26% Total 100% 100% Under 50 50 or Older Yes 31% 24% No 37% 50% Will not vote 12% 7% Unsure 21% 20% Total 100% 100% Caucasian Japanese Filipino Hawaiian Chinese Hispanic Other/Mixed Yes 25% 16% 31% 39% 43% 11% 34% No 44% 65% 39% 27% 33% 22% 45% Will not vote 9% 7% 4% 7% 19% 11% 5% Unsure 22% 13% 27% 27% 5% 56% 16% Total 100% 100% 100% 100% 100% 100% 100%
- 6. Civil Beat Poll Representative Sample: Likely Voters Statewide (961, Margin of Error +/- 3.2 percentage points) --ConCon—Issue (473, Margin of Error +/- 4.5 percentage points) --ConCon—Vote (488, Margin of Error +/- 4.4 percentage points) Fielded, October 8 – 12, 2018 6 Liberal/progressive Moderate Conservative Yes 33% 24% 21% No 39% 50% 58% Will not vote 8% 8% 7% Unsure 20% 19% 14% Total 100% 100% 100% Democrat Republican Independent Yes 27% 23% 29% No 43% 63% 44% Will not vote 8% 4% 11% Unsure 22% 10% 16% Total 100% 100% 100% College Degree No college Degree Yes 25% 32% No 49% 43% Will not vote 9% 5% Unsure 18% 21% Total 100% 100%
- 7. Civil Beat Poll Representative Sample: Likely Voters Statewide (961, Margin of Error +/- 3.2 percentage points) --ConCon—Issue (473, Margin of Error +/- 4.5 percentage points) --ConCon—Vote (488, Margin of Error +/- 4.4 percentage points) Fielded, October 8 – 12, 2018 7 Less than $50,000 $50,000 - $100,000 More than $100,000 Yes 35% 28% 22% No 36% 52% 44% Will not vote 7% 7% 11% Unsure 22% 14% 23% Total 100% 100% 100% Oahu_1 Oahu_2 Hawaii Maui Kauai Yes 25% 28% 27% 33% 6% No 47% 45% 43% 51% 33% Will not vote 9% 11% 4% 22% Unsure 19% 16% 27% 16% 39% Total 100% 100% 100% 100% 100%
- 8. Civil Beat Poll Representative Sample: Likely Voters Statewide (961, Margin of Error +/- 3.2 percentage points) --ConCon—Issue (473, Margin of Error +/- 4.5 percentage points) --ConCon—Vote (488, Margin of Error +/- 4.4 percentage points) Fielded, October 8 – 12, 2018 8 About the Poll Civil Beat surveyed a random sample of 961 likely General Election voters statewide. Calls were made from October 8 – 12, 2018, using interactive voice response technology (touch-tone polling). Cell phones were contacted by live call-agents who obtained consent and then patched consenting participants through to the same recorded survey as landline respondents. The sample consisted of 70% landlines and 30% cellphones. Results were balanced for gender, age, ancestry/ethnicity/race, county and Congressional District of residence, education, and likelihood of voting. The margin of error +/- 3.2 percentage points. Other sources of error, such as imperfect response rates and design effect (the effect of weighting results based on demographics) are also common in public opinion research and may affect the results. The adjusted margin of error, accounting for the design effect is +/- 4.3 percentage points. The margin of error for any crosstabulated result is larger than the margin of error of the corresponding topline result. Some columns may sum to totals slightly higher or lower than 100% due to rounding. The poll was conducted by Civil Beat working with Merriman River Group, a full-service consulting organization specializing in opinion research, election management, and communications.