Weitere ähnliche Inhalte
Ähnlich wie Chart of gallons spilled
Ähnlich wie Chart of gallons spilled (20)
Mehr von Honolulu Civil Beat
Mehr von Honolulu Civil Beat (20)
Kürzlich hochgeladen (20)
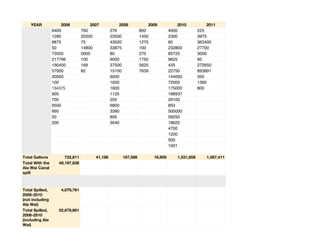
Chart of gallons spilled
- 1. YEAR 2006 2007 2008 2009 2010 2011
6400 760 276 800 4000 225
1280 20200 23500 1450 2300 3975
9875 75 43520 1275 60 363400
50 14800 33875 100 232800 27700
73500 5000 80 270 85725 3000
217796 100 9000 1750 9625 60
190450 169 37500 5625 435 272650
57000 82 15100 7639 22750 893891
30000 6000 144000 350
100 1630 72000 1360
134375 1600 175000 800
905 1125 168937
700 255 29100
9500 6800 850
660 3390 500000
20 895 58250
200 3040 18625
4700
1200
500
1001
Total Gallons 732,811 41,186 187,586 18,909 1,531,858 1,567,411
Total With the 49,197,836
Ala Wai Canal
spill
Total Spilled, 4,079,761
2006-2010
(not including
Ala Wai)
Total Spilled, 52,679,861
2006-2010
(including Ala
Wai)
- 2. YEAR 2006 2007 2008 2009 2010 2011