2012 February UI Rate
•
0 gefällt mir•220 views

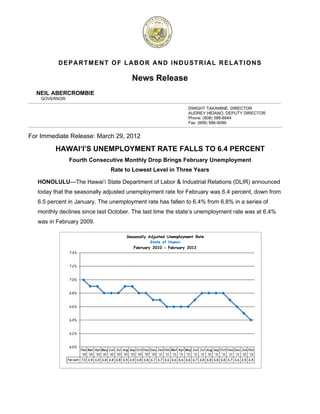
Hawaii's seasonally adjusted unemployment rate fell to 6.4% in February 2012, down from 6.5% in January and the lowest level in three years. Initial claims for unemployment benefits were down 7% from a year ago while total weeks claimed declined 5%. Job gains occurred in education and health services, leisure and hospitality, construction, and trade, transportation, and utilities over the month. Total nonfarm jobs have increased by 2,900 or 0.5% compared to February 2011, with the largest gains in leisure and hospitality, professional and business services, and financial activities.

Empfohlen
Weitere ähnliche Inhalte
Was ist angesagt?
Was ist angesagt? (15)
Andere mochten auch
Andere mochten auch (9)
Ähnlich wie 2012 February UI Rate
Ähnlich wie 2012 February UI Rate (20)
Mehr von Honolulu Civil Beat
Mehr von Honolulu Civil Beat (20)
Kürzlich hochgeladen
Kürzlich hochgeladen (20)
2012 February UI Rate
- 1. DEPARTMENT OF LABOR AND IND USTRIAL RELATIONS News Releas s se ERCROMBI NEIL ABE IE GOVERNO OR __ ___________________________ __________________________ ___________________________ ___________________________ ___________________________ ___________________________ ___________________________ __________________________ ___________ DWIGHT TA AKAMINE, DIRE ECTOR AUDREY H HIDANO, DEPUT DIRECTOR TY Phone: (808 586-8844 8) Fax: (808) 5 586-9099 __ ___________________________ __________________________ ___________________________ ___________________________ ___________________________ ___________________________ ___________________________ __________________________ ____________ F Immediate Release: March 29, 2012 For HAWAI‘I’S UNEMPLOYMEN RATE FALLS T 6.4 PERCENT H S NT TO Fourth Consecutiv Monthly Drop Brings February Unemploym C ve D s ment Rat to Lowest Level in T te Three Years HONOLU ULU—The Hawai‘i State Departmen of Labor & Industrial R H e nt Relations (DLIR) announ nced today tha the seasonally adjuste unemploy at ed yment rate fo February was 6.4 per or rcent, down from 6.5 perce in January. The unem ent mployment rate has falle to 6.4% f r en from 6.8% in a series of n monthly declines sinc last October. The las time the st d ce st tate’s unemp ployment rat was at 6.4 te 4% was in Fe ebruary 2009. Seasonally Adjusted Unempl A loyment Rate State of Hawai i February 2010 - Februa y ary 2012 7.4% 7.2% 7.0% 6.8% 6.6% 6.4% 6.2% 6.0% Feb Mar Apr May Jun Ju Aug Sep Oct Nov Dec Jan Feb Mar A May Jun Jul Au Sep Oct Nov Dec Jan Feb M ul Apr ug c '10 '1 '10 '10 '10 '10 '10 '10 '10 '10 '10 '11 '11 '11 ' 10 0 '11 '11 '11 '11 '1 '11 '11 '11 '11 '12 '12 11 Percent 7.0 6.9 6.9 6.8 6.8 6.8 6.9 6.9 6.8 6.8 6.7 6.7 6.6 6.6 6 6 8 6.6 6.6 6.7 6.8 6. 6.8 6.8 6.7 6.6 6.5 6.4 .8 6
- 2. Initial claims for unemployment benefits were down 7% and total weeks claimed down 5% compared to one year ago. Initial claims declined by 14.5% and total weeks claimed fell by 4% in February compared to January. Among major industry groups, over-the-month job gains were experienced in Education & Health Services (+1,000), Leisure & Hospitality (+900), Construction (+700), and Trade, Transportation, & Utilities (+200). In comparison with February 2011, total seasonally adjusted nonagricultural jobs have gone up by 2,900 or +0.5 percent, with the largest job expansion in Leisure & Hospitality (+4,300, +4.2 percent), Professional & Business Services (+900, +1.2 percent), and Financial Activities (+900, +3.4 percent). State of Hawai‘i Seasonally Adjusted Labor Force Data** Feb 2012 Jan 2012 Feb 2011* Labor Force 659,450 660,850 660,850 Employment 617,350 617,800 617,250 Unemployment 42,100 43,050 43,600 * benchmarked data **totals may not add due to rounding FEB JAN FEB* 2012 2012 2011 Seasonally Adjusted STATE 6.4 6.5 6.6 U. S. 8.3 8.3 9.0 Not Seasonally Adjusted STATE 6.2 6.4 6.6 HONOLULU 5.5 5.6 5.5 HAWAI‘I COUNTY 9.0 9.4 9.7 KAUA‘I 7.9 8.3 8.8 MAUI COUNTY 6.8 7.1 8.1 Maui Island 6.7 6.9 8.0 Moloka‘i 13.3 14.9 11.8 Lana‘i 3.8 3.9 5.9 U. S. 8.7 8.8 9.5 county & island rates are not seasonally adjusted * benchmarked data
- 3. The unemployment rate figures for the State of Hawai‘i and the U.S. in this release are seasonally adjusted, in accordance with the U.S. Bureau of Labor Statistics (BLS) methodology. The not seasonally adjusted rate for the State declined to 6.2 percent in February from 6.4 percent in January. Seasonally Adjusted Non-Ag. Jobs (Statewide) SELECTED SERIES: Feb-12 Jan-12 Feb-11* MINING, LOGGING & CONSTRUCTION 28,300 27,600 28,500 MANUFACTURING 13,000 13,100 13,200 TRADE, TRANSPORTATION & UTILITIES 111,100 110,900 110,900 Wholesale Trade 17,200 17,300 17,400 Retail Trade 66,800 67,300 66,400 FINANCIAL ACTIVITIES 27,600 27,600 26,700 Real Estate & Rental & Leasing 11,600 11,700 11,300 PROFESSIONAL & BUSINESS SERVICES 75,200 76,300 74,300 Professional, Scientific, Tech Svcs 23,200 23,300 24,500 EDUCATIONAL & HEALTH SERVICES 75,700 74,700 75,500 Educational Services 14,500 14,400 14,400 Health Care & Social Assistance 61,200 60,300 61,100 LEISURE & HOSPITALITY 106,600 105,700 102,300 Arts, Entertainment & Recreation 10,600 10,500 10,500 Accommodation & Food Services 96,000 95,200 91,800 OTHER SERVICES 25,400 25,600 26,000 GOVERNMENT 124,600 125,800 125,800 Federal Government 34,700 34,800 34,900 State Government 71,400 72,600 72,200 Local Government 18,500 18,400 18,700 TOTAL: STATEWIDE 595,500 595,000 592,600 *Benchmarked Data Seasonally Adjusted Non-Ag. Jobs (Statewide) 600,000 595,000 State of Hawaii 590,000 585,000 580,000 575,000 570,000 Feb- Feb- May- Nov- Aug- 11 12 11 11 11 Page | 3
- 4. Technical Notes Seasonal Adjustment The seasonal fluctuations in the number of employed and unemployed persons reflect hiring and layoff patterns that accompany regular events such as the winter holiday season and the summer vacation season. These variations make it difficult to tell whether month-to-month changes in employment and unemployment are due to normal seasonal patterns or to changing economic conditions. To deal with such problems, a statistical technique called seasonal adjustment is used. This technique uses the past history of the series to identify the seasonal movements and to calculate the size and direction of these movements. A seasonal adjustment factor is then developed and applied to the estimates to eliminate the effects of regular seasonal fluctuations on the data. When a statistical series has been seasonally adjusted, data for any month can be more meaningfully compared with data from any other month or with an annual average. Current Population (Household) Survey (CPS) The labor force statistics are derived from a survey based on the week including the 12th of each month of Hawai`i residents with a sample size of about 1,000 households. A series of questions are asked to assess whether a person is currently part of the labor force, and if so, what is their current employment status. Employed persons consist of: 1) all persons who did any work for pay or profit during the survey reference week, 2) all persons who did at least 15 hours of unpaid work in a family-owned enterprise operated by someone in their household, and 3) all persons who were temporarily absent from their regular jobs, whether they were paid or not. Persons are classified as unemployed if they do not have a job, have actively looked for work in the prior four weeks, and are currently available for work. Workers expecting to be recalled from layoff are counted as unemployed, whether or not they have engaged in a specific job seeking activity. Persons not in the labor force are those who are not classified as employed or unemployed during the survey reference week. Benchmark Changes to Local Area Unemployment Statistics Data The 2011 and 2010 labor force estimates have been revised to incorporate updated inputs, updated population controls, re-estimation of models, and adjustment to new division and national control totals. The updated population controls reflect the annual updating of population estimates by the U.S. Census Bureau. Change to Monthly Employment Estimates This release incorporates revised job count figures from 1990 through 2011 for the seasonally adjusted series. The reconstructed data reflects data from historical corrections applied to unadjusted supersector or sector level series. For years, monthly employment estimates for Hawai‘i and our metropolitan areas have been Page | 4
- 5. developed by analysts with the State Department of Labor - Research and Statistics Office. These estimates were based on a monthly survey of Hawai‘i businesses and analysts' knowledge about our local economies. Beginning with the production of preliminary estimates for March 2011, responsibility for the production of State and metropolitan area (MSA) estimates was transitioned from individual state agencies to the U.S Bureau of Labor Statistics (BLS). For Hawai‘i, this means the transition of statewide and Honolulu MSA areas. State agencies will continue to provide the BLS with information on local events that may impact the estimates, such as strikes or large layoffs/hiring at businesses not covered by the survey and to disseminate and analyze the CES estimates for local data users. BLS feels this change is designed to improve the cost efficiency of the CES program and to reduce the potential bias in state and area estimates. A portion of the cost savings generated by this change is slated to be directed towards raising survey response rates in future years, which will decrease the level of statistical error in the CES estimates. Until then, state analysts feel this change could result in increased month-to-month variability for the industry employment numbers particularly for Hawai‘i's counties and islands. Seasonally Adjusted Labor Force and Unemployment Estimates for Honolulu Effective with the release of metropolitan area data for May 2011, the Bureau of Labor Statistics is publishing smoothed seasonally adjusted civilian labor force and unemployment estimates for all metropolitan areas. This includes estimates for Honolulu County. The data will be available on the day of each Metropolitan Area Employment and Unemployment news release. The schedule for 2011 is available at http://www.bls.gov/lau/lausched.htm. Alternative Measures of Labor Underutilization Alternative Measures of Labor Underutilization for States, 2011 Averages. Alternative measures of labor underutilization for US and Hawai‘i, 2011 Averages (percent) Measure State U-1 U-2 U-3 U-4 U-5 U-6 United States 5.3 5.3 8.9 9.5 10.4 15.9 Hawai‘i 4.5 4.2 7.3 7.8 9.0 15.1 The six alternative labor underutilization state measures based on the Current Population Survey (CPS) and compiled on a 4-quarter moving average basis defined: Page | 5
- 6. U-1, persons unemployed 15 weeks or longer, as a percent of the civilian labor force; U-2, job losers and persons who completed temporary jobs, as a percent of the civilian labor force; U-3, total unemployed, as a percent of the civilian labor force (this is the definition used for the official unemployment rate); U-4, total unemployed plus discouraged workers, as a percent of the civilian labor force plus discouraged workers; U-5, total unemployed, plus discouraged workers, plus all other marginally attached workers*, as a percent of the civilian labor force plus all marginally attached workers; and U-6, total unemployed, plus all marginally attached workers, plus total employed part time for economic reasons, as a percent of the civilian labor force plus all marginally attached workers. * Individuals who want, and are available for work, and who have looked for a job sometime in the prior 12 months (or since the end of their last job if they held one within the past 12 months), but were not counted as unemployed because they had not searched for work in the four weeks preceding the survey, for such reasons as child care or transportation problems, for example. Discouraged workers are a subset of the marginally attached. Note that, the state unemployment rates (U-3) that are shown are derived directly from the CPS. As a result, these U-3 measures may differ from the official state unemployment rates for the latest 4-quarter period. The latter are estimates developed from statistical models that incorporate CPS estimates, as well as input data from other sources, such as state unemployment claims data. ##### For more information, contact: Francisco P. Corpuz Research and Statistics Office Department of Labor and Industrial Relations francisco.p.corpuz@hawaii.gov Phone: (808) 586-8999 Fax: (808) 586-9022 Page | 6