This document discusses how changing the coefficients in a quadratic equation affects the graph of the parabola. It explores quadratic equations in standard form, y=ax^2 +bx+c, and examines how changing a, b, and c impacts the orientation, stretch factor, and vertex of the graph. Students are asked to sketch the path of a jackrabbit using a quadratic equation and label points to determine the values of h, k, and a.
How to Troubleshoot Apps for the Modern Connected Worker
Parabola lab day 3
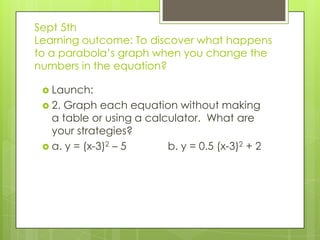
1. Sept 5th
Learning outcome: To discover what happens
to a parabola’s graph when you change the
numbers in the equation?
Launch:
2. Graph each equation without making
a table or using a calculator. What are
your strategies?
a. y = (x-3)2 – 5 b. y = 0.5 (x-3)2 + 2
2. Explore Standard Form
2. Now we are going to look at quadratics
in standard form y = ax2 +bx + c
a. What is the orientation of y = 2x2 +4x -
30? (up or down facing)
b. What is the stretch factor of y = 2x2 +4x -
30?
C. Can you look at y = 2x2 +4x -30 and figure
out the vertex?
3. Explore: Standard Form
3. Now we are going to look at quadratics
in standard form y = ax2 +bx + c
a. What is the orientation of y = 2x2 +4x -
30? (up or down facing)
b. What is the stretch factor of y = 2x2 +4x -
30?
C. Can you look at y = 2x2 +4x -30 and figure
out the vertex?
6. Explore: Quadratic models
Sketch the path of the jackrabbit on your
paper. Choose where to place the x- and y-
axes in your diagram so they make sense and
make the problem easier. Label as many
points as you can on your sketch.
a. What point on your graph can tell you about
the values of h and k in the equation? Write
those values in a general equation
b. With your group, find a strategy to find the
value of a. Will any points on the diagram
help?