Business... at a glance July 2022
•
0 gefällt mir•3 views

Trade balance Spain Corporate insolvency in Spain Industrial Turnover Index International trade in goods EU-27 Industrial Production US Producer Prices UK

Empfohlen
Empfohlen
Weitere ähnliche Inhalte
Ähnlich wie Business... at a glance July 2022
Ähnlich wie Business... at a glance July 2022 (20)
Mehr von Círculo de Empresarios
Mehr von Círculo de Empresarios (20)
Kürzlich hochgeladen
Kürzlich hochgeladen (20)
Business... at a glance July 2022
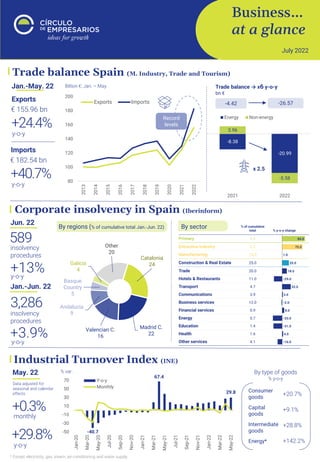
- 1. Business… at a glance July 2022 Catalonia 24 Madrid C. 22 Valencian C. 16 Andalucia 9 Basque Country 5 Galicia 4 Other 20 Corporate insolvency in Spain (Iberinform) +3.9% insolvency procedures Jan.-Jun. 22 y-o-y 3,286 By regions (% of cumulative total Jan.-Jun. 22) By sector +13% insolvency procedures Jun. 22 y-o-y 589 Trade balance Spain (M. Industry, Trade and Tourism) Exports € 155.96 bn y-o-y +24.4% Imports € 182.54 bn y-o-y +40.7% Jan.-May. 22 Billion €; Jan. – May. Trade balance → x6 y-o-y bn € Record levels Industrial Turnover Index (INE) % var. By type of goods % y-o-y May. 22 monthly +0.3% y-o-y +29.8% Consumer goods +20.7% Capital goods +9.1% Intermediate goods Energy* +142.2% +28.8% Data adjusted for seasonal and calendar effects * Except electricity, gas, steam, air-conditioning and water supply -40.7 67.4 29.8 -50 -30 -10 10 30 50 70 Jan-20 Mar-20 May-20 Jul-20 Sep-20 Nov-20 Jan-21 Mar-21 May-21 Jul-21 Sep-21 Nov-21 Jan-22 Mar-22 May-22 Y-o-y Monthly -4.42 -26.57 80 100 120 140 160 180 200 2013 2014 2015 2016 2017 2018 2019 2020 2021 2022 Exports Imports -8.38 -20.99 3.96 -5.58 2021 2022 Energy Non-energy x 2.5
- 2. Business… at a glance. a publication of the “Círculo de Empresarios” produced by its Department of Economy. contains information and opinion from reliable sources. However. the “Círculo de Empresarios” does not guarantee its accuracy and does not take responsibility for any errors or omissions. This document is merely informative. As a result. the “Círculo de Empresarios” is not responsible for any uses that may be made of the publication. The opinions and estimates of the Department can be modified without prior warning. International trade in goods EU-27 (Eurostat) Bn€ Exports € 1,012.3 bn y-o-y +17.6% Imports € 1,175.6 bn y-o-y +48.5% Jan.-May. 22 54.5 69.4 -163.3 -180 -160 -140 -120 -100 -80 -60 -40 -20 0 20 40 60 80 Jan.-May. 20 Jan.-May. 21 Jan.-May. 22 From surplus to deficit due to ▲ energy goods deficit from €85.7 bn to €234.4 bn (+173.4% y-o-y) Industrial Production US (Federal Reserve) Jun. 22 monthly -0.2% y-o-y +4.2% % monthly change Q2 22 y-o-y +6.1% 0.4 0.8 0.7 0.8 0 -0.2 Jan-22 Feb-22 Mar-22 Apr-22 May-22 Jun-22 1st fall in 6 months Producer Prices UK (Office for National Statistics) Jan.-Jun. 22 By type of goods % change By industry % change y-o-y +24% Input prices y-o-y +16.5% Output prices 24.0 16.5 -6 -1 4 9 14 19 24 Jan-20 Mar-20 May-20 Jul-20 Sep-20 Nov-20 Jan-21 Mar-21 May-21 Jul-21 Sep-21 Nov-21 Jan-22 Mar-22 May-22 Inputs Outputs % y-o-y change * Exc. duties Main inputs % y-o-y change Crude oil +94.6% Fuel* +52.9% Metals & non-metallic minerals +26.0% Main outputs % y-o-y change Petroleum products* +86.1% Chemical & Pharmaceutical +22.9% Metal, machinery & equipment +21.4% Trade balance by type of goods bn€ 23.7 -11.7 -85.7 73.7 71.6 -3.6 20.2 -19.2 -234.3 72.6 44.3 -43.9 Food & drink Raw materials Energy Chemicals Machinery & vehicles Other manuf. goods 2021 2022