1. The document shows simulations of transistor characteristics and simple circuits using the ACM MOSFET model. Transistor output characteristics, intrinsic charges and capacitances are plotted versus drain voltage and gate voltage.
2. A MOS capacitor simulation shows the gate capacitance versus gate voltage.
3. DC simulations compare the output characteristics of a square composite transistor formed from series-parallel connections of individual transistors to that of a single transistor described by a macromodel.
1. 1
EXEMPLES OF SIMULATION WITH THE ACM MODEL
This document shows some examples of simulation using the ACM model. It is divided in
two parts: the first one shows the transistor characteristics and the second shows some simple
circuits which illustrate the capability of the model. All the simulations were done with SMASH.
1. Transistor characteristics
1.1 Output characteristics
The figures below show the drain current and the logarithm of the output conductance
versus the drain voltage for a NMOS transistor with W/L=10µ/0.8µ.
• Netlist for simulation of example 1.1
File: idvd.nsx
**********************
* ID x VD - ACM model
**********************
M52 D G S 0 ACM W=10u L=0.8u
File: idvd.pat
***********************************
*ID x VD - ACM Model - DC Analysis
***********************************
.PARAM VGB = 1
VDB D 0 DC 5
VGB G 0 DC 'VGB'
VSB S 0 DC 0
* ACM model parameters
*----------------------
.MODEL ACM NMOS LEVEL=10
+ TOX=150.12E-10 UO=552.2 PHI=0.64
+ VTO=0.685 GAMMA=0.77 XJ=0.25E-6
+ THETA=0.083 UCRIT=2.6E6 SIGMA=3e-15
+ LAMBDA=0.25 LETA=0.44 WETA=0.26
+ PB=0.675 DL=-0.42E-6 DW=-0.1E-6
.DC LIN VDB 0 5 10m
.PARAMSWEEP VGB 1 3 1
.TRACE DC ID(M52) MIN=-2.6458598E-004
.TRACE DC {LOGGD52 = LOG(IN(M52.GDS))}
2. 2
ID(M52)
DC simulation: idvd.nsx ; single ; 12/8/97 ; 16:08:26
Scaling:400m 800m 1.2 1.6 2 2.4 2.8 3.2 3.6 4 4.4 4.8
-200uA
0A
200uA
400uA
600uA
800uA
1mA
1.2mA
1.4mA
1.6mA
1.8mA
2mA
2.2mA
2.4mA
2.6mA
2.8mA
Fig.1 - ID x VD characteristic of a NMOS transistor
LOGGD52
DC simulation: idvd.nsx ; single ; 12/8/97 ; 16:11:32
Scaling:400m 800m 1.2 1.6 2 2.4 2.8 3.2 3.6 4 4.4 4.8
-5
-4.8
-4.6
-4.4
-4.2
-4
-3.8
-3.6
-3.4
-3.2
-3
-2.8
-2.6
-2.4
-2.2
Fig. 2 - The output conductance of a NMOS transistor versus VD
1.2 Drain current in weak inversion
3. 3
This plot shows the logarithm of the drain current versus the gate voltage for a NMOS
transistor, in the saturation region, with W/L=10µ/0.8µ.
• Netlist for simulation of example 1.2
File: idvge.nsx
**********************
* ID x VG - ACM model
**********************
M52 G G S 0 ACM W=10u L=0.8u
File: idvge.pat
***********************************
*ID x VG - ACM Model
***********************************
VGB G 0 DC 2
VSB S 0 DC 'VSB'
* ACM model parameters
*----------------------
.MODEL ACM NMOS LEVEL=10
+ TOX=150.12E-10 UO=552.2 PHI=0.64
+ VTO=0.69 GAMMA=0.77
+ THETA=0.053 UCRIT=2.6E6 XJ=0.25E-6
+ LAMBDA=0.25 LETA=0.44 WETA=0.26
+ PB=0.675 DL=-0.42E-6 DW=-0.1E-6
.PARAM VSB = 0
.PARAMSWEEP VSB 0 2 1
.DC LIN VGB 0 5 10m
.TRACE DC {LOGID52 = LOG(ID(M52))}
4. 4
LOGID52
DC simulation: idvge.nsx ; single ; 12/8/97 ; 16:16:38
Scaling:400m 800m 1.2 1.6 2 2.4 2.8 3.2 3.6 4 4.4 4.8
-11
-10
-9
-8
-7
-6
-5
-4
-3
-2
Fig.3 - ID x VG of a NMOS transistor
1.3 Gate and source transconductances
Figures 4 and 5 show the ratios gmg/ID and gms/ID, in the saturation region, versus the gate
voltage, respectively. The ratio gmg/ID in the linear region is shown in figure 6. The transistor is the
same as in the previous examples.
• Netlist for simulation of example 1.3
File: idvge.nsx
**********************
* ID x VG - ACM model
**********************
M52 D G S 0 ACM W=10u L=0.8u
File: idvge.pat
***********************************
*ID x VG - ACM Model - DC Analysis
***********************************
*VDB D 0 DC 5
VDB D 0 DC 10m
VGB G 0 DC 2
VSB S 0 DC 'VSB'
6. 6
GMS_ON_ID
DC simulation: idvge.nsx ; all ; 11/7/97 ; 13:14:43
Scaling:400m 800m 1.2 1.6 2 2.4 2.8 3.2 3.6 4 4.4 4.8
0
4
8
12
16
20
24
28
32
36
40
Fig. 5 - gms/ID in the saturation region
GMG_ON_ID
DC simulation: idvge.nsx ; all ; 11/7/97 ; 13:26:01
Scaling:400m 800m 1.2 1.6 2 2.4 2.8 3.2 3.6 4 4.4 4.8
-2
0
2
4
6
8
10
12
14
16
18
20
22
24
26
Fig. 6 - gmg/ID in the linear region
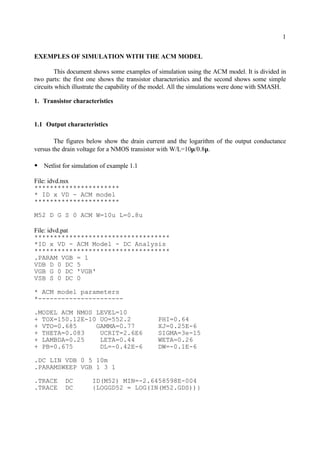
7. 7
1.4 Intrinsic charges
The charges at the gate, source, drain and bulk terminals versus VG are shown below, for a
NMOS transistor with W/L=10µ/0.8µ.
• Netlist for simulation of example 1.4
File: qvg.nsx
**********************
* Charges x VG - ACM model
**********************
M52 G G S 0 ACM W=10u L=0.8u
File: qvg.pat
********************************************
*Charges x VG - ACM Model
********************************************
VDB D 0 DC 2
VGB G 0 DC 0
VSB S 0 DC 0
* ACM model parameters
*----------------------
.MODEL ACM NMOS LEVEL=10
+ TOX=150.12E-10 UO=552.2 PHI=0.64
+ VTO=0.69 GAMMA=0.77
+ THETA=0.083 UCRIT=2.6E6 XJ=0.25E-6
+ LAMBDA=0.25 LETA=0.44 WETA=0.26
+ PB=0.675 DL=-0.42E-6 DW=-0.1E-6
.DC LIN VGB 0 5 10m
.TRACE DC {QG = IN(M52.QG)} {QS = IN(M52.QS)} {QB =
IN(M52.QB)} {QD = IN(M52.QD)}
8. 8
QG
QS
QB
QD
DC simulation: capvg.nsx ; all ; 9/7/97 ; 15:41:27
Scaling:400m 800m 1.2 1.6 2 2.4 2.8 3.2 3.6 4 4.4 4.8
-16f
-12f
-8f
-4f
0
4f
8f
12f
16f
20f
24f
28f
32f
36f
Fig. 7 - Intrinsic charges of a NMOS transistor
1.5 Intrinsic (trans)capacitances
The nine independent intrinsic (trans)capacitances versus VG are shown in the plots below
for a NMOS transistor with W/L=10µ/0.8µ.
• Netlist for simulation of example 1.5
File: capvg.nsx
**********************
* Capacitances x VG - ACM model
**********************
M52 G G S 0 ACM W=10u L=0.8u
File: capvg.pat
********************************************
*Capacitances x VG - ACM Model
********************************************
VDB D 0 DC 2
VGB G 0 DC 0
VSB S 0 DC 0
* ACM model parameters
10. 10
CSB
CSS
CSD
CSG
DC simulation: capvg.nsx ; single ; 9/7/97 ; 15:51:34
Scaling:400m 800m 1.2 1.6 2 2.4 2.8 3.2 3.6 4 4.4 4.8
-12m
-8m
-4m
0
4m
8m
12m
16m
20m
24m
28m
32m
36m
40m
Fig.8 - The nine independent (trans)capacitances of a NMOS transistor
2. The MOS capacitor
The figure below shows the simulation of the gate capacitance versus VG of a NMOS
transistor with the source, drain and bulk terminals tied together. The dimensions are W=10µm
and L=5µm.
• Netlist for simulation of example 2
File: capmos.nsx
**********************
*MOS capacitor
**********************
M52 D G S 0 ACM W=10u L=5u
File: capmos.pat
***********************************
* MOS capacitor
***********************************
VGB G 0 0
VDB D 0 0
CSS
CSG
CSB
CSD
VS=0V
VD=2V
11. 11
VSB S 0 0
* ACM model parameters
*----------------------
.MODEL ACM NMOS LEVEL=10
+ TOX=150.12E-10 UO=552.2 PHI=0.64
+ VTO=0.69 GAMMA=0.77
+ THETA=0.083 UCRIT=2.6E6 XJ=0.25E-6
+ LAMBDA=0.25 LETA=0.44 WETA=0.26
+ PB=0.675 DL=-0.42E-6 DW=-0.1E-6
.TRACE DC {CGG52/COX = IN(M52.CGG) / 115E - 15}
.DC VGB -2 5 0.01
CGG52/COX
DC simulation: capmos.nsx ; single ; 9/7/97 ; 17:36:19
Scaling:-1.5 -1 -500m 0 500m 1 1.5 2 2.5 3 3.5 4 4.5
280m
320m
360m
400m
440m
480m
520m
560m
600m
640m
680m
720m
760m
800m
840m
880m
920m
Fig. 9 - The MOS capacitance versus VG
3. DC simulation of series-parallel connected MOSFET’s
The DC simulation of a square composite transistor (series-parallel association) [2],
showed in figure 10, was performed. Figure 11 shows the dc output characteristics of the
composite transistor and of a unit transistor. The currents are almost coincident in the linear
region. Figure 12 shows a comparison between the dc output characteristic of the same array of
transistors and a single transistor described by the macromodel (NS=4 and NP=4).
12. 12
G
D
S
Fig.10 - Series-parallel connected transistors. The dimensions of each transistor is W=10µm and
L=2µ
• Netlist for simulation of example 3
File: spa.nsx
********************************
*Series-parallel association
********************************
M11 D G X1 0 ACM W=10u L=2.0u
M21 X1 G X2 0 ACM W=10u L=2.0u
M31 X2 G X3 0 ACM W=10u L=2.0u
M41 X3 G S 0 ACM W=10u L=2.0u
M12 D G X1 0 ACM W=10u L=2.0u
M22 X1 G X2 0 ACM W=10u L=2.0u
M32 X2 G X3 0 ACM W=10u L=2.0u
M42 X3 G S 0 ACM W=10u L=2.0u
M13 D G X1 0 ACM W=10u L=2.0u
M23 X1 G X2 0 ACM W=10u L=2.0u
M33 X2 G X3 0 ACM W=10u L=2.0u
M43 X3 G S 0 ACM W=10u L=2.0u
M14 D G X1 0 ACM W=10u L=2.0u
M24 X1 G X2 0 ACM W=10u L=2.0u
M34 X2 G X3 0 ACM W=10u L=2.0u
M44 X3 G S 0 ACM W=10u L=2.0u
*Macromodel
M3 D G 0 0 ACM W=10u L=2.0u NS=4 NP=4
*Unit transistor
M4 D G 0 0 ACM W=10u L=2.0u
13. 13
File: spa.pat
VDB D 0 5
VGB G 0 'VGB'
VSB S 0 0
*ACM MODEL PARAMETERS
*-----------------------------------
.MODEL ACM NMOS LEVEL=10
+ TOX=150.12E-10 UO=552.2 PHI=0.64
+ VTO=0.69 GAMMA=0.77 SIGMA=3e-15
+ THETA=0.083 UCRIT=2.6E6 XJ=0.25E-6
+ LAMBDA=0.25 LETA=0.44 WETA=0.26
+ PB=0.675 DL=-0.42E-6 DW=-0.1E-6
.TRACE DC {ID = ID(M11) + ID(M12) + ID(M13) + ID(M14)}
ID(M3) MIN=0.0000000E+000 MAX=2.4000000E-006
.PARAM VGB=1
.DC LIN VDB 0 1 10m
.PARAMSWEEP VGB 0.75 0.8 0.05
ID
ID(M4)
DC simulation: spa.nsx ; all ; 12/8/97 ; 16:26:39
Scaling:100m 200m 300m 400m 500m 600m 700m 800m 900m
-200n
0
200n
400n
600n
800n
1u
1.2u
1.4u
1.6u
1.8u
2u
2.2u
2.4u
Fig. 11 - The dc output characteristics of the composite transistor and of a unit transistor
14. 14
ID
ID(M3)
DC simulation: spa.nsx ; all ; 12/8/97 ; 16:28:46
Scaling:100m 200m 300m 400m 500m 600m 700m 800m 900m
-200n
0
200n
400n
600n
800n
1u
1.2u
1.4u
1.6u
1.8u
2u
2.2u
2.4u
Fig. 12 - The dc output characteristics of the composite transistor and of a single transistor with
the unit dimensions and NS=NP=4
4. Tests for charge conservation
4.1 A charge pumping circuit
The first test to verify charge conservation was performed in the charge pumping circuit
shown in figure 13, where a 5V pulse train is applied to the gate and the voltage at drain (source)
was measured. As the model conserves charge the voltage at the drain (source) rises and return to
zero for each input pulse. Figure 6 shows the simulation results
Composite transistor
Macromodel
VG=0.75V
VG=0.80V
15. 15
G
S D
1.6pF 1.6pF
0
5 W
L
m
m
=
100
15
µ
µ
COX≅3.3pF
Fig. 13 - Charge pumping circuit for charge conservation test
• Netlist for simulation of example 4.1
File: cpump.nsx
**********************
* Charge pump
**********************
M52 D G S B ACM W=100u L=15u
CS S 0 1.6p
CD D 0 1.6p
File: cpump.pat
***********************************
* Charge pump
***********************************
VBB B 0 0
VIN G 0 PULSE 0 5 0n 1n 1n 10n 22n
* ACM MODEL parameters
*--------------------------------------
.MODEL ACM NMOS LEVEL=10
+ TOX=150.12E-10 UO=552.2 PHI=0.64
+ VTO=0.69 GAMMA=0.77
+ THETA=0.083 UCRIT=2.6E6 XJ=0.25E-6
+ LAMBDA=0.25 LETA=0.44 WETA=0.26
+ PB=0.675 DL=-0.42E-6 DW=-0.1E-6
.TRACE TRAN V(D) MIN=-1.8058931E-001 MAX=1.9864824E+000
.EPS 1u 100m 1n
.H 1n 1f 1n 250m 2
.TRAN 1n 100n 0
.METHOD TRAP
16. 16
V(D)
Transient analysis: cpump.nsx ; all ; 9/7/97 ; 16:02:53
Scaling:10n 20n 30n 40n 50n 60n 70n 80n 90n
-100mV
0V
100mV
200mV
300mV
400mV
500mV
600mV
700mV
800mV
900mV
1V
1.1V
1.2V
1.3V
1.4V
1.5V
1.6V
1.7V
1.8V
1.9V
Fig. 14 - Simulation result of the charge pumping circuit
4.2 A sample and hold circuit
The second test has been performed in the sample-hold circuit shown in figure 15
G
S D
2.5pF
0
5
5V
W
L
m
m
=
100
15
µ
µ
COX≅3.3pF
Fig. 15 - Sample and hold circuit for charge conservation test
17. 17
• Netlist for simulation of example 4.2
File: shold.nsx
**********************
* Sample-hold
**********************
M52 D G S B ACM W=100u L=15u
CD D 0 2.5p
File: shold.pat
***********************************
* Sample-hold
***********************************
VBB B 0 0
VIN G 0 PULSE 0 5 0 1n 1n 20n 42n
VS S 0 5
* ACM MODEL parameters
*--------------------------------------
.MODEL ACM NMOS LEVEL=10
+ TOX=150.12E-10 UO=552.2 PHI=0.64
+ VTO=0.69 GAMMA=0.77
+ THETA=0.083 UCRIT=2.6E6 XJ=0.25E-6
+ LAMBDA=0.25 LETA=0.44 WETA=0.26
+ PB=0.675 DL=-0.42E-6 DW=-0.1E-6
.TRACE TRAN V(D) MIN=-3.3183785E-001 MAX=3.6502164E+000
.EPS 1u 100m 1n
.H 1n 1f 1n 250m 2
.TRAN 1n 360n 0
.METHOD TRAP
18. 18
V(D)
Transient analysis: shold.nsx ; all ; 9/7/97 ; 16:06:27
Scaling:20n 40n 60n 80n 100n 120n 140n 160n 180n 200n 220n 240n 260n 280n 300n 320n 340n
-200mV
0V
200mV
400mV
600mV
800mV
1V
1.2V
1.4V
1.6V
1.8V
2V
2.2V
2.4V
2.6V
2.8V
3V
3.2V
3.4V
Fig 16 Simulation result of the sample-hold circuit
5. Switched circuits
5.1 A switched capacitor filter
The simulation of a switched capacitor circuit (figure 17)shows that the model can predict
well the charge transfer from capacitor C1 to C2.
2.5pF
W
L
m
m
=
100
15
µ
µ
COX≅3.3pF
20pF
φa φb
5V
C1 C2
3 6
Fig. 17 - Switched capacitor filter
• Netlist for simulation of example 5.1
20. 20
V(3)
V(6)
Transient analysis: scap.nsx ; all ; 9/7/97 ; 16:10:33
Scaling:50u 100u 150u 200u 250u 300u 350u 400u 450u 500u 550u 600u 650u 700u
0V
500mV
1V
1.5V
2V
2.5V
3V
3.5V
0V
500mV
1V
1.5V
2V
2.5V
3V
3.5V
Fig 18 - Simulation results of the switched capacitor circuit
5.2 A discrete time parametric amplifier
The model also predicts well the behavior of the discrete time parametric amplifier of [1]
(figure 19).
+
_
+
_
+
_
v in/2
v in/2 V B = 2 V
+
_
v out
W
L
m
m
=
1 0 0
1 5
µ
µ
W
L
m
m
=
1 0 0
1 5
µ
µ
V S B
V S B
φ
φ
φ
V S B
t1 t2
Fig. 19 - The parametric amplifier
22. 22
VIN
VOUT
Transient analysis: pamp.nsx ; single ; 9/7/97 ; 17:19:05
Scaling:10u 20u 30u 40u 50u 60u 70u 80u 90u
-600m
-500m
-400m
-300m
-200m
-100m
0
100m
200m
300m
400m
500m
Fig 20 - Simulation results of the parametric amplifier
Reference
[1] Y. Tsividis and K. Suyama, Strange ways to use the MOSFET, Proceedings of IEEE-
ISCAS, Hong-Kong, June 1997.
[2] C. Galup-Montoro, M.C. Schneider and I.J.B. Loss, Series-parallel association of FET’s for
high gain and high frequency applications, IEEE Journal of Solid-state Circuits, vol. 29, no. 9,
pp. 1094-1101, September 1994.