Decentralized Rural Development Planning : A Case Study of Khok Charoen District, Lopburi Province, Thailand (Part I)
•
3 gefällt mir•803 views

Introduction, Natural Resources and Environment Sector and Agricultural Sector

Empfohlen
Empfohlen
Weitere ähnliche Inhalte
Andere mochten auch
Andere mochten auch (13)
Ähnlich wie Decentralized Rural Development Planning : A Case Study of Khok Charoen District, Lopburi Province, Thailand (Part I)
Ähnlich wie Decentralized Rural Development Planning : A Case Study of Khok Charoen District, Lopburi Province, Thailand (Part I) (20)
Mehr von Dr.Choen Krainara
Mehr von Dr.Choen Krainara (20)
Kürzlich hochgeladen
Kürzlich hochgeladen (20)
Decentralized Rural Development Planning : A Case Study of Khok Charoen District, Lopburi Province, Thailand (Part I)
- 1. Rural Regional Planning Workshop January – May 2008 Workshop Report Development Planning of Khok Charoen District, Lopburi Province Submitted to Asso. Prof. Dr.Soparth Pongquan Professor J.K. Routray Mr. Vitoon Nil-Ubol Submitted by Rural regional Development Planning Student Rural Regional Development Planning Field of Study School of Environment, Resources and Development Asian Institute of Technology Thailand
- 2. Acknowledgments First, we would like to express our deep gratitude to Prof.J.K.Routray, School of Environment, Resources and Development, Asian Institute of Technology, and Dr. Soparth Pongquan, Associate professor, School of Environment, Resources and Development, Asian Institute of Technology for their kind and field and class room guidance, comments, and their technical assistance in preparing this report and to learn a valid practical social research methodologies. This report and field work was become successfully possible due to Mr. Vitoon Nil-ubol, RRDP Field Laboratory Supervisor, School of Environment, Resources and Development, Asian Institute of Technology. We heartily acknowledged his efforts in preparing schedules, organizing filed surveys and trips and data collection. We also extend our thanks to all the senior Thai students who acted as translator and made our job easier while data collection and even in data organizing. Finally, our greatest appreciation is given to local people of Khok Chareon district and TAO officials, and other officials at the district and provincial level for their warm contribution and support. ii
- 3. Workshop Participants 1 Mr. Abdul Waheed Pakistan 2 Mr. Abid Hussain Pakistan 3 Mr. Alam Mohammad Pakistan 4 Mr. Amar B. Thing Nepal 5 Mr. Bashirullah Khpalwan Afghanistan 6 Ms. Chaba Srisuno Thailand 7 Mr. Choen Krainara Thailand 8 Mr. Imran Taj Hassani Pakistan 9 Mr. Junaid Alam Memon Pakistan 10 Mr. Khampu Phoyyavong Laos 11 Mr. Mahtab Ahmad Pakistan 12 Mr. Mizan ul-Rahman Bangladesh 13 Ms. Naw Pe The Law Myanmar 14 Ms. Nay New Myanmar 15 Ms. Poonam Sharma Nepal 16 Mr. S.Apichatthanapath (seng) Thailand 17 Mr. Sarawuth Wattatham Thailand 18 Ms. Sirinath Matra (Noi) Thailand 19 Mr. Sothy Va Cambodia 20 Ms. Tran Thi Bach CUC Vietnam 21 Ms. Yupa Naw Myanmar 22 Mr. Zhang Jun China iii
- 4. TABLE OF CONTACTS Chapter Title Page Acknowledgment і Workshop Participants іі Table of contacts ііi List of Table vi List of Figures x List of Maps xiii 1. Introduction 1 1.1 Study Area Identification Phase 2 1.2 Preparatory Phase 2 1.3 Field Investigation Phase I 2 1.4 Data Analysis Phase I 2 1.5 Field Investigation Phase II 2 1.6 Data Analysis Phase II 3 1.7 Planning Phase 3 1.8 Synthesis 3 2. Natural Resources and Environment Sector 5 2.1 Over view and outline 5 2.2 Topography and Climate 6 2.3 Soil 11 2.4 Land 19 2.5 Water 23 2.6 Forest 26 2.6a Case Study of Tambon Yangrak Community Forestry 28 2.7 Minerals 30 2.8 Environmental Issues 32 2.8a A Case Study on Pollution from Open Sugarcane Burning in 33 Tambon Nang Makha 2.9 Relevant Government Policies and Strategies on NRE 35 2.10 Sectoral Analyses and Interrelation of Key Issues 37 2.10.1 Conclusions 40 3. Agricultural Sector 42 3.1 Land for Agriculture 3.2 Water Resources 50 3.3 Soil for Agriculture 3.3a Water Management: A case study on water users’ organization 53 3.4 Crops 55 3.5 Livestock and Poultry 66 3.6 Fishery 72 3.7 Agricultural Employment 74 3.8 Khok Chareon District Agriculture Office 74 3.9 Agriculture Extension Service 74 iv
- 5. 3.10 Tambon Agriculture Technology Transfer Centre 76 3.11 Case study on Integrated Farming System 78 3.12 Case study on chemical free vegetable plantation 80 3.13 Case study on paddy farming group 82 3.14 Agricultural Credit 83 3.15 Agriculture Policies 84 3.16 Problems and prospects 86 3.17 Conclusions and recommendations 87 4. Non Agricultural Sector 88 4.1 Industrial Sector 91 - Thai Hand Weaving Group, Tambon Khok Charoen 103 - Thai hand weaving group, Tambon Khok Samae San 105 - Thong Muan production, Tambon Nong Makha 106 - Basketry group – Wang Thong 109 4.2 Trade and Commerce 116 4.3 Tourism 133 4.4 Problems and Potential Analysis of Non-Agriculture Sector 138 4.5 Conclusion and Recommendation 140 5. Infrastructure Sector 143 5.1 Introduction 143 5.2 Settlement 144 5.3 Connection network: Time distance and accessibility 147 5.4 Public transportation (Bus) 152 5.5 Water Supply System 153 5.5.1 Case study 154 5.6 Power supply systems 155 5.7 Telecommunication 156 5.8 Overall Development 158 6. Social Sector 161 6.1 Population 161 6.1.2 Population Structure 161 6.1.6 Population Projection 165 6.1.11 Migration 170 6.1.13 Policies and Programs on Poverty Alleviation 171 6.2.1 Health policies and strategies 174 - Public Health Station - Tambon Yang Rak 183 - District hospital, Khok Charoen – A case study 185 6.3 Education - Case Study on Yang Rak Vittaya School 206 - Case Study of Village Development Fund Project in Supporting 208 Students’ Study 6.3.10 Non-Formal Education 210 6.3.13 Vocational Training 214 6.4.1 Thailand’s Administrative Structure 218 6.4.3 Community Planning Process of Tambon 223 6.4.6 The Community Development Department (CDD 228 - A Case study on Weaving Group 230 v
- 6. - Saving group case study in Tambon Khok Charoen 231 - Village Development Funds Case Study on Village 232 Development Funds village no.of 8 Tambon Wang Tong 6.4.12 Social Welfare and Issues 235 6.4.15 Summary of problems and potentials for the Social sector 236 7. Project proposals 237 - Awareness Raising Project on Natural Resources and 237 Environmental Problems - Promoting Community Forestry in Tambon Wangthong 243 - Agriculture Technology Transfer Centre Strengthening Project 248 - Enhancement of Area under Cassava Cultivation 250 - Cooperative weaving centre 252 - Formation of Weaving Training and Demonstration Center as a 258 Culture Tourism - Provision of Community Shallow Tub-well 265 - Skill improvement program for OTOP groups in Khok Charoen 267 district References 270 Appendices 272 vi
- 7. LIST OF TABLE Table Title Page Table 2.1 Classification of Major Soils in Khok Charoen district 11 Table 2.2 Soil quality with reference to the villages in the district 13 Table 2.3 Soil Suitability analysis of Khok Charoen District with reference to Tambons 14 Table 2.4 Types and Number of Land Ownerships in Khok Charoen District 20 Table 2.5 Details of the Natural Sources of water in Khok Charoen District 23 Table 2.6 Overall Policies of Natural Resources and Environment Sector 39 Table 3.1 Total cultivable agricultural land, households and average land holding size 43 Table 3.2 Land area and percentage of land occupied by agriculture and others 43 Table 3.3 Agricultural Land Use by Tambon Wise 44 Table 3.4 Upland and Lowland Crop by Tambon Wise 45 Table 3.5 Factors affecting crop performance and suitability 47 Table 3.6 General Soil Observation 47 Table 3.7 Soil Fertility Analysis 48 Table 3.8 Available water storage resources 50 Table 3.9 Situation of cultivable area and available stored water resources 52 Table 3.10 Cropping pattern 56 Table 3.11 Cropping Calendar 57 Table 3.12 Cropping Intensity 57 Table 3.13 Average Yield 58 Table 3.14 Benefit Cost ratio calculation of major crops 59 Table 3.15 Comparative statement of livestock and agriculture production 64 Table 3.16 Human resource of livestock department in Khok Charoen District 67 Table 3.17 Poultry Population in District Khok Charoen 70 Table 3.18 Number of fish farmers, fish farmers, production and areas 72 Table 3.19 Number of fish farmers, fish farmers, production and areas 72 Table 3.20 Number of fish farmers, fish farmers, production and areas 73 Table 3.21 Number of fish farmers, fish farmers, production and areas 73 Table 3.22 Number of fish farmers, fish farmers, production and areas 73 vii
- 8. Table 3.23 Summary information about the three Financial Institutions 83 Table 4.1 General information of Lop Buri province 88 Table 4.2 Breakdown of income generated by sector 88 Table 4.3 Comprehensive picture of Non-agricultural sector in Khok Charoen district 90 Table 4.4 Summary of supporting institutions of industries and OTOPs 91 Table 4.5 Industry situation in Lop Buri province 94 Table 4.6 Current situation in Khok Charoen district 95 Table 4.7 Number of agricultural household per one agro-processing industry 95 Table 4.8 Change in number of OTOP projects in different districts between 2006-07 98 Table 4.9 Comparison of income generated from OTOPs among different districts 99 Table 4.10 Comparison of successful OTOPs (4 stars or more) in different districts of 99 Lopburi Table 4.11 List of OTOPs in Khok Charoen district 100 Table 4.12 Comparison among OTOPs 108 Table 4.13 List of main problems in the industrial sector 114 Table 4.14 List of potentials of industrial sector in Khok Charoen 115 Table 4.15 Distribution time and place of weekly market in Khok Charoen district. 117 Table 4.16 Distribution of total shop by Tambon 119 Table 4.17 Distribution of Shops by Tambon 120 Table 4.18 Ratio of Population under the Service of Shops in Tambon 120 Table 4.19 Markets, Location and Time Spent of Inflow Products 125 Table 4.20 Markets, Location and Time Spent of Outflow Products 128 Table 4.21 Number of Clients and Loan Amount Disbursed 130 Table 4.22 Department of Business Development Strategy (2008-2012) 132 Table 4.23 Internal Tourism Statistics of Lop Buri Province 133 Table 4.24 Attractive tourist place in Lop Buri by share of visitors in 2004 134 Table 4.25 SWOT analysis of tourism 138 Table 5.1 Population Density and Settlement Pattern of District Khock Charoen 145 Table 5.2 Average time 147 Table 5.3 Roads density 148 Table 5.4 Cumulative road density 148 Table 5.5 Accessibility to facilities 151 viii
- 9. Table 5.6 Construction and maintenance 151 Table 5.7 Individual transport 152 Table 5.8 Water availability 153 Table 5.9 Case study 154 Table 5.10 Power supply 155 Table 5.11 Telecommunication 156 Table 5.12 Overall development 158 Table 6.1 Households size change by Tambon, 2004-2007 161 Table 6.2 Population Density by Tambon 161 Table 6.3 Population by gender, 2007 163 Table 6.4 Comparison of Male and Female Sex Ratio 164 Table 6.5 The dependency and dependency ratio 165 Table 6.6 Population projected by Tambon 2015 and 2020 166 Table 6.7 The population growth rate Khok Charoen district, 2003-2007 166 Table 6.8 Birth and Death Rates Khok Charoen district, 2007 167 Table 6.9 Household income 168 Table 6.10 Poverty rate by Tambon in 2004-2007 168 Table 6.11 Type of poverty problems 169 Table 6.12 Tambon wise out - migration 170 Table 6.13 Tambon wise in - migration 171 Table 6.14 Accessibility of public health stations/hospital 176 Table 6.15 Distribution of health facilities with respect population 177 Table 6.16 Detail of health personnel 178 Table 6.17 Details of major disease in the district 180 Table 6.18 Distribution of Education Institutions by Tambons 194 Table 6.19 Ratio of Student-classroom Khok Chareon District 194 Table 6.20 Ratio of Students-classroom in Pre-primary Education Khok Chareon District 196 Table 6.21 Ratio of Student-classroom in Primary School, Khok Chareon District 196 Table 6.22 Ratio of Students-classroom in Lower Secondary Education, Khok Chareon 197 District Table 6.23 Ratio of Students-classroom in Upper Secondary Education, Khok Chareon 198 District ix
- 10. Table 6.24 Number of Teachers by Qualification in Khok Chorean District, Academic Year 198 2006 Table 6.25 Students-teacher Ratio by School 199 Table 6.26 Students-teacher Ratio by Lower Secondary and Upper Secondary School 200 Table 6.27 Percentage of Dropout by Schools 200 Table 6.28 Time of Distance to a Particular School Service by Foot and by Bike 203 Table 6.29 Schedule of English Teacher of Anu Bann Khok Charoen School 204 Table 6.30 School Assessment by External Education in Khok Charoen District 205 Table 6.31 Number of Villages Reached at Progressive Level of Studying Continuation 206 Table 6.32 The Students-to-computer Ratio, Yang Rak Wittaya School 206 Table 6.33 Number of Students in Yang Rak Wittaya School by Gender and Grade 207 Table 6.34 The Distribution of Scholarship in Khok Charoen District, 2008 209 Table 6.35 The Rate of Illiteracy by Tambons in 2007 211 Table 6.36 Non-formal Education Projects’ Plan and Budget, Khok Chaoren District, 212 2007 Table 6.37 Community Learning Centers in Khok Charoen District 214 Table 6.38 Report Fiscal Year 2007: Education and Training to Improve Vocational 215 Skills Table 6.39 Human Resource of the Tambon Administrative Organization (TAO) 221 Table 6.40 Income and Expenditure by Tambon in Khok Charoen District, 2007 221 Table 6.41 Local Revenues by Source of income in TAO, 2007 222 Table 6.42 Expenditure of TAO 222 Table 6.43 List of Development Projects in Khok Charoen District 223 Table 6.44 Percentage of Local People’s Participation in Khok Charoen District 225 Table 6.45 Institutional support from Line Ministries in Khok Charoen District 227 Table 6.46 List of Community Groups in Khok Charoen District by Tambon 229 Table 6.47 Finance group and the budget in five Tampons, 2007 230 Table 6.48 Detail of assistance provided to needy people 235 x
- 11. LIST OF FIGURE Figure Title Page Figure 1.1 Rural and Regional Planning Workshop Methodology 4 Figure 2.1 Percentage Distribution of the Area by Tambon 7 Figure 2.2 Rainfall Data Lopburi Metrological Station (1988-2006) 9 Figure 2.3 No of Rainy Days, Lopburi Metrological Station (1997-06) 9 Figure 2.4 Average Max/Min Temperature 9 Figure 2.5 Average Humidity, Lopburi Metrological Station (1988-2006) 9 Figure 2.6 Percentage distribution of the soil under major groups 13 Figure 2.7 Alternative for Planting in Khok Charoen District 18 Figure 2.8 Villages with Access to Clean Drinking Water 25 Figure 2.9 Villages with Access to Clean Drinking Water for Domestic Uses 25 Figure 2.10 Villages with Access to water for agricultural purposes 26 Figure 2.11 Utilization and appearance of Perlite 30 Figure 3.1 Land Use 42 Figure 3.2 Upland and low land crop area 44 Figure 3.3 Upland and Low land crop by Tambon 45 Figure 3.4 Agricultural land use by Tambon 46 Figure 3.5 Soil Fertility Level 49 Figure 3.6 Tambon wise percentage of total water storage capacity 50 Figure 3.7 Comparison of cultivable land and water resources 52 Figure 3.8 Area under the different cropping patterns 56 Figure 3.9 Cropping Intensity 58 Figure 3.10 Gross Benefits vs Production Cost (per rai) 60 Figure 3.11 Benefit cost ratio analysis of major crops 60 Figure 3.12 Number of Livestock (cattle- Buffalo, Sheep, Pig) in 2008 67 Figure 3.13 Livestock population in Tambon Khok Charoen 67 Figure 3.14 Livestock population in Tambon Yang Rack 68 Figure 3.15 Livestock population in Tambon Nong Makah 68 Figure 3.16 Livestock population in Tambon Khok Samae 69 Figure 3.17 Comparison of Tombon wise livestock population percentage 69 Figure 3.18 Percentage of Production System 70 xi
- 12. Figure 3.19 Khok Chareon district Agriculture Organizational Chart 75 Figure 4.1 Employment status at provincial level 89 Figure 4.2 Breakdown of employment by sub-sector in Lopburi 89 (in number of worker) Figure: 4.3 Industrial Development and Planning Zone of Thailand 92 Figure 4.4 Percentage distribution of cottage industries by location/Tambon 95 Figure 4.5 Distribution of cottage industries (rice mills) 96 Figure 4.6 Distribution of OTOPs among different districts 97 Figure 4.7 Distribution of OTOPs by location/Tambon 101 Figure 4.8 Distribution of OTOPs by function among Tambon 101 Figure 4.9 Distribution of OTOPs by function among different areas within 102 Khok Charoen district Figure 4.10 Marketing channels for weaving products 105 Figure 4.11 Marketing channels of Thong Muan production 107 Figure 4.12 Marketing channels for handicraft basketry 110 Figure 4.13 Marketing channels of dried cassava. 111 Figure 4.14 Marketing channels of products from rice mill. 111 Figure 4.15 Density of Population to Private Shops Map 121 Figure 4.16 Distribution of Weekly Market Map 122 Figure 4.17 Market Linkage 123 Figure 4.18 Marketing Chanel of cloths 126 Figure 4.19 Marketing Chanel of groceries 126 Figure 4.20 Marketing Chanel of House ware products 127 Figure 4.21 Marketing Chanel of Electric ware Products 127 Figure 4.22 Distribution of Tax revenue of Khok Charoen District in 2006 129 Figure 4.23 Tax Revenues Generated from Private Shop by Tambon in 2007 129 Figure 4.24 Tourist Map in Lop Buri Province 135 Figure 5.1 Size of Household 145 Figure 5.2 Individual transports 152 Figure 5.3 Availability of water 153 Figure 5.4 Power supply 155 Figure 5.5 TOT and cell phone 157 xii
- 13. Figure 5.6 Overall development 158 Figure 6.1 Population Distributions by Tambon 162 Figure 6.2 Population by age and gender 163 Figure 6.3 Gender balance 163 Figure 6.4 Population pyramid 164 Figure 6.5 Population Growth Rate 167 Figure 6.6 Achievement of households have saving by Tambon 169 Figure 6.7 Location of public health station 176 Figure 6.8 Distribution of health facilities 177 Figure 6.9 Distribution of nurses in the district 178 Figure 6.10 Resident environment 180 Figure 6.11 Health and Hygiene conditions 181 Figure 6.12 Distribution of health volunteers in four Tambons 181 Figure 6.13 Organization Structure Khok Charoen Hospital 185 Figure 6.14 Details of health awareness schemes 187 Figure 6.15 Organization of the Present School System in Thailand 191 Figure 6.16 Education Administration and Management Structure 193 Figure 6.17 Percentage of Classrooms by Education Level 195 Figure 6.18 Percentage of Students by Education Level 195 Figure 6.19 Percentage of Villages Achieved Progressive Education Level by Tambons 203 Figure 6.20 The Changing of Numbers of Students by Gender and Grades 207 Figure 6.21 The National and Local Government Structure in 218 Figure 6.22 TAO Administrative Chart 220 Figure 6.23 Development Project of TAOs 224 Figure 6.24 People’s Participation in Social Activities by Five Tambon 226 Figure 6.25 Community Development Department working 228 Figure 6.26 Number of villages becoming sufficiency economy village 228 Figure 6.27 Number of villages having Public Information Centre in Khok Charoen 228 District xiii
- 14. LIST OF MAPS Map Title Page Map 2.1 Topographic map of Khok Chareon District 8 Map 2.2 Villages Affected by Storm in Tambon Khok Charoen 11 Map 2.3 Soil Type 16 Map 2.4 Soil Suitability Map, Khok Charoen Disitrict 17 Map 2.5 Land Use Pattern 19 Map 2.6 Land Reformed in Tambon Khok Samae San, Khok Charoen District 21 Map 2.7 Drainage Map Showing Water Bodies 24 Map 2.8 Distributions of Land and Forest Resources in Khok Charoen District 27 Map 3.1 Distributions of Water Resources 51 Map 3.2 Showing water reservoir in the study district 53 Map 3.3 Demonstration Farm Sites 77 Map 5.1 Settlement pattern of Khok Chareon 144 Map 5.2 Population density of Khok Charoen district 146 Map 5.3 Population distribution 146 Map 5.4 Road network 147 Map 5.5 Flow map 149 Map 5.6 Distribution of Facilities 150 Map 5.7 Accessibility of facilities 150 Map 6.1 School Distribution in Khok Charoen District 202 xiv
- 15. CHAPTER 1 INTRODUCTION This report is prepared by the students who participated in the Rural and Regional Planning Workshop which was conducted form January to May 2008 as part of the Masters and Doctors Program at the Asian Institute of Technology (AIT). The objective of this report is to understand the current situation and development level of the district, and then to provide any recommendations or suggestions for future district development planning to the local authorities or any other relevant organizations. The report is based on both primary and secondary data sources. Main sources of secondary data have been NRD-2C and BMN as well as statistics and documents provided by the local government offices and organizations. The study area of Khok Chareon District is situated in Lobburi Province and had the following features. The district (King Amphoe) was created on March 9th, 1987 by splitting off four tambon from Khok Samrong District. It was upgraded to a full district on November 4th, 1993 with total area of 317.14 Km2 or 198212 rai with five subdistricts (tambons) and 53 villages. Socio-economic Characteristics of the study area • The main occupation is agriculture • Hospital: 10 bedrooms, 2 doctors, 1 dentist, 28 nurses, 1 pharmacist, 11 public health officers • None of bank • None of department store • There are 16 Primary Schools • 2 Secondary Schools: (Khok Charoen Withaya School and Yang Rak Withaya School) • 1 Research Station: Kasetsart University in Moo 4, Tambon Yang Rak • Total households 7142 • Total Population 24457 • Agriculture and industry î Main agricultural goods: maize, sugarcane, potato, sorghum î Main water sources: Sub Song Stream, Ma Deu Stream î None of industry • Tourist Attractions î None of ancient remains and antiques î Tourist Attractions: handmade silk center, Chang village headman’s grape field 15
- 16. î Hotel: Sak Thong Phra Narai Resort î None of guest house î Restaurant: J’ Lek Restaurant next to the Khok Charoen District Office • Significant natural resources of Khok Charoen District î Perlite mineral in Tambon Khok Samae San and Tambon Yangrak 1. Methodology: Rural and Regional Planning Workshop has various steps (Figure 1.1). These steps were grouped into phases. 1.1Study Area Identification Phase Faculty and staff identified the study area for the workshop. In this case Khok Charoen district was identified. The faculty and associated proceeded with the collection of secondary data about the study area. 1.2 Preparatory Phase In this phase objectives of the workshop were formulated. Different literatures were reviewed such as the study area profile, the previous workshop reports and planning reports. Conceptual framework was prepared from these studies. 1.3 Field Investigation Phase 1 Study area reconnaissance survey was done in this phase. This survey was intended to get an overall picture of the situation of the district through field observation, Rapid Rural Appraisal (RRA) with local groups and project activities in the study area. During the visit secondary data and information were obtained from district and sub-district levels. Key problems and issues encountered in the sub-district and district levels were identified from primary and secondary sources. 1.4 Analysis Phase 1 Data and information collected during the reconnaissance survey, the local groups and project activities, the NRD-2C database by village on selected aspects (general, economic, education, health, labor and social), BMN of the sub-districts and other secondary data were analyzed and key problems were identified into difference sectors. The data requirement, data sources and data gaps were worked out for detailed survey. 16
- 17. 1.5 Field Investigation Phase 2 During the field investigation, the participants were assigned to 5 separate sector groups namely: I. Natural Resources and Environment Sector II. Agriculture Sector III. Non-agriculture Sector IV. Infrastructure Sector V. Social Sector The respective groups collected data and information of study area, i.e. the problems, needs, potentials and key issues, focusing on their sectors. Data such as descriptive statistics, annual reports, provincial plans, sectoral plans, line department plans, district plans, sub-district (Tambon) agriculture plans, Tambon administrative organization development plans, maps, topographic sheets, and others, were collected from line agencies, departments and other primary sources of information. The participants were presented the main problems and needs of study area at the district and provincial meeting room and got the feed back from these officials. 1.6 Analysis Phase 2 From the data and information gathered during the field study such as Tambon Profile, district profile, district development guidelines, government policies, existing project/activities and other primary data, the respective sectoral group analyzed the situation of the study area for their sectors. Therefore, the problems, needs, potentials and key issues of the sectors were identified and prioritized. 1.7 Planning Phase Base on the identified and prioritized sectoral problems and needs, projects were identified. The result of secondary data analysis, people’s perception, government policies, and information on existing projects of the district were taken into consideration for the formulation of new projects. 1.8 Synthesis Each sectoral group completed a final report of the respective sector. The final report was compiled and arranged strategically to contain the following chapters: Chapter 1 Introduction Chapter 2 Natural Resources and Environment Sectoral Study Chapter 3 Agriculture Sectoral Study Chapter 4 Non-agriculture Sectoral Study 17
- 18. Chapter 5 Infrastructure Sectoral Study Chapter 6 Social Sectoral Study Chapter 7 Project Proposals A workshop is organized in Khok Charoen District to present the outcome of the planning workshop. The participants were the representatives from the study area: Provincial, District, and Tambon officers of Khok Charoen District, during the workshop. The respect five groups presented their sectoral projects. Questions were raised concerning the projects presented and was courteously and promptly answered by the presenters. Suggestion and comments were also raised. This final report was prepared incorporation all the comments and suggestions made. Problems and Constraints The workshop was conducted within four months and participants encountered various personal and professional related concerns. But despite everything, the plan was cohesiveness of the group was developed. The following were the major problems and constraints identified: a) All data and information were collected through PRA or RRA, which needed extensive discussion with the local community. Local people speaks Thai language only, which some of the students don’t understand. Faculty, staff and Thai friends worked very hard to solve the language problem. b) Data requirement for a purpose was found different. Some of the required data were not available for the sectoral planning at sub-district and district levels. 18
- 19. Time Frame Major Steps Techniques - Identification of the Study Area - Collection of Secondary Data - Primary Survey on Sample Tambon/ Village (Pre-workshop period) - Objective of the Workshop and Literature Review • PRA/RRA - Introduction of the Study Area Preparatory Phase • Observation • Group Discussion (2 weeks) • Discussion with - Review of Different Plans and people and Gov’t Literature officials - Conceptual Framework Field Investigation Phase 1 - Reconnaissance Survey (Macro and Micro Study Groups) • PRA/RRA (3 days) • Presentation Before the District and Provincial Identification of Problems Officials Analysis Phase 1 • Tambon Council Meetings Identification of Data Requirements, Data • Meeting with Sector (3 weeks) Sources and Data Gaps Organizations Field Investigation Phase 2 2 Field Investigation Phase - Field Investigation - Data/Information Gathering (6 (6 days) days) • Structuring of Problems and Potentials Analysis Phase 2 - Regional and Sectoral Analysis • Projection/Spatial Analysis (4 weeks) • Quantitiative and Development of Problems Based on Potential Mapping Planning Phase 2 Finalization of the Planning Report (3 weeks) Synthesis - Final Presentation Before the District and Provincial Officers (2 weeks) - Discussion and Adjustments Source: Routray, J.K., (1995) Figure 1.1: Rural and Regional Planning Workshop Methodology 19
- 20. CHAPTER II NATURAL RESOURCE AND ENVIRONMENT 2.1 Overview The part of the study analyzes the state of natural resources and environment (NRE) and highlights its problem potential, need and constraints. Subsequently it also attempts to propose important project to address the problems and develop the potentials that will contribute to overall development of the district by creating opportunities for the well being of the local people. This sector will broadly cover topography, land, soil, water, forest, minerals and environment. The relevant policies at all scales are also reviewed and the strategies adopted by the district and Tambon offices are also reviewed in detail to streamline the project with programs and policy to enhance their relevance and practical application.Based on the analysis of the sector, it is observed that the state of environment and natural resources in the district is not very much satisfactory. The district is not very rich in terms of natural resources in their present state. Given some natural constrains, the potential however exist in the area that can be developed for the overall improvement of social, economical and environmental aspects for long-term and sustainable development of the district. Each of the above mentioned sectors has some problems and potentials needs and constrains which sketch the outline for the development planning of the district. The land is available in the district with relation to population. The per-capita land availability of the district is about 7.5 rai but the most of the land in the district comes under the reserve forest area. The land distribution is also a major problem. The state of water for some basic needs like drinking and other domestic usage is satisfactory however the water shortage in dry season coupled by poor quality of aquifer is the main problem in the area. The water perennial supply of agriculture water is utmost need of the area and has important implications on the development of the district. Forests are the most prominent feature of the district in general and Tambon Wong Thong and Yang Rak in specific and are development potentials of the area. But the degradation of the forest to considerable extent needs immediate attention. The community based forestry management practices are already introduced in Tambon Yang Rak and its results are promising. So community forestry is considered to be a potential that can substantially applicable in Tambon Wong thong as about 90% of the total area of Tambon area classified as reserve forest area. In terms of soil quality, the poor soil texture is the main problem. Due to the lack of compactness in soil structure, the water run-off during the rainy seasons and flooding causes soil erosion problem. The issues related to soil are on particular focus of national and provincial level priorities. The land development department has the soil doctor project with a soil doctor in every village and the demo project on soil conservation through vitiver gross in Tambon Nong Makha. However the services of scope of these initiatives are not very much satisfactory. The district level authorities can take initiative to strengthen these existing services to cope with the serious problem of soil erosion because the national and provincial policy and program framework is in complete harmony. The issues corresponding to soil are addressed in proposed general awareness raising project. In the environmental analysis though the district has got relatively clean environment but the periodical and ad-hoc based problems like illegal farm burning from sugarcane and emerging 20
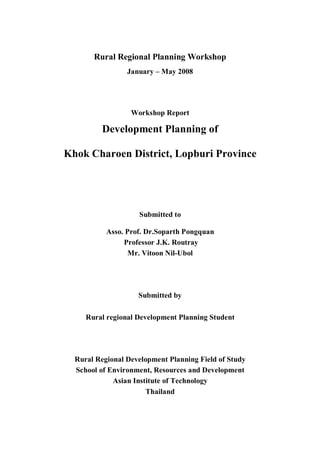
- 21. problems or solid-waste in residential areas are also highlighted for future implication of environmental conscious planning as a part of sustainable development strategy. The overall sectoral plan provided by the planning team is not a one-off action plan rather a flexible cyclic activity. It is neither a recipe that is complete in-itself to ensure the development of the district nor it is a complete replacement version of the existing planning methodology in the district. Rather it’s a supplement to the existing planning mechanisms. District level planning personals can add-remove following the empirical and practical experience acquired through close interaction with the area. This report represents the sectoral status of the Natural Resources and Environment and sectoral development plan project proposals for the Khok Charoen district. The sectoral report covers the following sections: 1. Topography and Climate 2. Soil 3. Land 4. Water 5. Forest 6. Minerals 7. Environmental Issues 8. Relevant Government Policies and Strategies 9. Sectoral Analyses and Its Interrelation of Key Issues 10. Conclusion and recommendations 2.2 Topography and Climate 2.2.1 Geographical Location Area and Topography Location District Khok Chaoren is located between North 15o 15 & 15o 30 latitude and East 100o 45 & 101o 0 longitude in the upper central region of Thailand. It is situated at the distance of 80 km from provincial hall Lopburi and 182 km away from Bangkok, the capital of Thailand. Positioned in the top of the Lopburi province, it touches Phai Sali District of Nakhron Saman Province in its North and Si Thep District of Phetchaboon Province in its east, whereas in south-east and south-west, neighbors two of its siblings: District Sa Bot and District Nong Muang respectively. Area and Administration The district covers an area of 317 km or 198,212 rai in the upper part of Lopburi province. It is administratively divided into five tambons namely Tambon Khok Charoen (45,573 rai), Tambon Yang Rak (41,075 rai), Tambon Nang Makha (69,268 rai), Tambon Wong Thong (15,833 rai) and Tambon Khok Same Sam (26,463 rai) with district Khok Charoen is the district head quarter. 21
- 22. Figure 2.1: Percentage Distribution of the Area by Tambon Tambon Wise Area Distribution Khok Charoen District Lop Buri Province 8% 23% 13% Khok Chaoren Yang Rak Nang Ma Kha Khok Samae San 21% Wang Thong 35% Source: District Administrative organization, Khok Charoen District Physical Settings/Topography The district is the part of Pasak river basin which is the important tributary of Chao Pharaya and Mekong river basins. Various Land features appear in the district ranging from lowland to upland and highlands. Highland and upland mostly exists in Tambon Yangrak where the elevation level varies from 80 m to 560 m above mean sea level, with more than 40% of the land area having a slope gradient of 0-2%, while 4.7% has slope gradient of 40%. However, some small patches of high and upland are also sparsely scattered in rest of four tambons. The lowland exists in Tambon Khok Charoen, Tambon Khok Samae San and Tambon Nong Makha. The per-capita land availability in the district is about 7.5 rai. The main land uses are agriculture forest and residential. Around 54.5% of the total land in the district comes under reserve forest are mostly located in Tambon Yang Rak and Tambon Khok Samae San. 22
- 23. Map2.1: Topographic Map of Khok Charoen District Source: District Administrative organization, Khok Charoen District 2.2.2 Seasonal Composition, Rainfalls, Temperature and Humidity Seasonal Composition The seasonal composition of the district is similar to the general seasonal patterns of the central region in Thailand with three seasons a year. Generally, the summer rests for three months, starting from the February to April, which is less hot than the summer of the North or Northeast of the country due to the influence of the ocean and the trade winds from the ocean between February and April. The Rainy season rests for six months starting from May to end of October, when the southwest monsoon winds and depression storms exert their influence, while the winter retains for more or less three months starting from November to the end of 23
- 24. January, when the northeast monsoon winds exert their reduced influence and thus is not as cold as the winter of the district of the North or Northeast region of the country. Rainfall Though the available data is not district specific and is representative of the entire jurisdiction of Lopburi metrological station but data shows that the area has got less precipitation much lower than Thailand and also significantly lowers than rest of the central region of Thailand in which it is located with few exceptions in year 1996 and 1999. The average rainfall of the area comes about 1077 (mm.). There is almost no rain in the area during December to march. The range of rainy days varies between 77 days to 121 days between the period 1996-2007 with 121 days in 1996 and 77 days in 2004 and 96 days in 2006. Figure2.2: Rainfall Data Lopburi Figure2.3: No of Rainy Days, Lopburi Metrological Station (1988-2006) Total Raining days 1997-2006 140 120 121 100 104 108 93 92 96 88 91 88 80 77 Raining days 60 40 20 0 1996 1998 2000 2002 2004 2006 2008 Metrological Station (1997-2006) Source: LopBuri Metrological Station 2007 Temperature and Humidity /climate The area is tropical hot and humid and has almost constant temperature ranges. The trend for more than decadal time series data (1997-2007) shows that the average maximum temperature ranges between 32Co to 35Co whereas the average minimum temperature ranges from 23Co 25Co. The average relative humidity in the area as of the period (1997-2007) ranges from 67% to 73 % with July, August, September and October as most humid months in a year. This is significantly high in comparison to the universal recommendation of 30%-60% as a standard for comfort to human beings. Due to high humidity sweating is less effective so people in the area feel hotter. Please refer annex 1 (2, 3 and 4) for details. 24
- 25. Figure 2.4: Average Max/Min Figure2.5: Average Humidity, Lopburi Metrological Average Max/MinTemperature (1996-2007) 40 Station (1988-2006) 35 Average Humidity 1996-2006 30 25 73 max 72.69 72.44 72.44 20 min 72 71.87 15 71.48 71 10 5 70 70.05 70.14 Average 69.77 0 69 1996 1997 1998 1999 2000 2001 2002 2003 2004 2005 2006 2007 68.36 68 67.52 Temperature 67 1996 1998 2000 2002 2004 2006 2008 Source: LopBuri Metrological Station 2007 2.2.3 Flood, Draught and Storm –Case Study Analysis Flood The district has occasional flash floods rounds with the frequency of once in three years and rests for a maximum period of 10 days, however does not cause significant economic and human losses. As per qualitative information obtained during the interviews and FGDs the last flood occurred 3 years ago for 10 days at the month of October. The magnitude was low however affected 400-4500 rais of sugarcane land however no human and livestock losses are associated with this phenomenon. Though no documentation is available in the district regarding the occurrence of floods however it is observed that in Tambon Nang Makha, flood occurs every year, while in Khok Samae Sam it occurs once every three years. However no flood occurs in Tambon Yang Rak and Wang Thong. Storm Though minor storms usually occurs the study area but the severity of the phenomena is Tambon Khok Charoen specific where it causes considerable economic and human loss. Though the data for frequency and other matters was not readily available in Tambon however the damages caused by last storm were properly noted down. During the Group discussion and meetings with Tambon officials it was observed that due to the direction of the wind in association with the location of the villages the storms have impacts in Khok Charoen tambons. Based on available data, a case study has been conducted as given below. 25
- 26. Case Study.1: Storm in Tambon Khok Charoen Tambon Location: Khok Charoen Year of Occurrence: 2007 Occurrence Period: December to January of every year Villages Affected: Village number 1, 2, 3, 6, 8, 9&12 Household Affected: 59 households Economic Loss: 178217.38 bhat Storm is an annual event in Tambon Khok Charoen, so the people of this Tambon are facing storm problem every year. The time of the storm was from December to January. The storm of 2007 was massive one and so taken as a case for study in our report. 58 households of 7 villages namely village number 1,2,3,6,8,9,&12 were affected by the storm, and among them village number 8 was greatly affected in which a total 32 Households out of total 56 households were affected by the storm. In village number 2, 12 household, in village number 12, 1 household, in village number 6, 2 household, in village number 1, 7 household and village number 9, 5 household were affected. In average, 80 households are affected per year from the storm. The Map 2.2: Villages Affected by Storm in Tambon Khok Charoen Source: RRDP Workshop, 2008 26
- 27. 2.3 Soil 2.3.1 Soil Type and Classification Like other central districts of the country, Khok Charoen consist variety of soil series. The standard classification of soil in Thailand is based on the standard soil classifications by the major soils of south Asia by R.Dudal and FR Moornam, the Jour of Trop Geog vol 18 1964. Following these standards there are 15 major soil series found in the Khok Charoen District and can be categorized under 6 major groups. About 42% total district soils are classified as low humic gley soils which makes 42% of total soils of the district followed by red yellow podozolic soil 20%, hydromorphic, non calcic gely soil 18%, Sedimentary rocks 11.22%, Alluvial Soils 7% and Redish Brown Lateritic soils 2.5%. The details of each of the soil types are given in Table 2.1: and percentage distribution of the soil is given in figure 2.1. Table 2.1: Classification of Major Soils in Khok Charoen District Classification Soil % of Drainage Permeability Surface pH Slope of Soil Series it total Run Value contain district range Soil Moderately 6.0 to Alluvial Soils 1 7% well Moderate Moderate <2 7.0 drained Hydromorphic, Moderately 25, 25B, 5.5 to Non Culcic 18% well Moderate Moderate 1-20 31, 55 8.0 Gley Soils drained 16, 28, 28B, 28/47, Somewhat Low Humic 5.0- 28/54, 42% poorly Moderate Slow 0-2 Gley Soils 8.0 28B/47B, drained 29, 33B, 30 Reddish Well 4.5 to Brown 52, 54 2.5% Moderate Rapid 2-16 Drained 6.0 Lateritic Soil 46, 46B, Red Yellow Well Moderate 4.5- 47, 47B, 20% Moderate 4-16 Podzolic Soil Drained to Rapid 6.0 47C Sedimentary 62 11.22 Well Moderate Rapid 5.0- 3-16 27
- 28. Rocks Drained 8.0 Source: Land Development Office, Lopburi Province, 2008 The overall picture of the soil of the district shows that about 33% of the soils are well drained; about 25% of the soils are moderately well drained while 42% of the soils are somewhat poorly drained. The permeability of the entire of the district is moderate. The surface run data shows the patterns in flow of rain water. The map 2.1 shows the area under each type soil in the district. When we locate the data on map and compare it with NRD-2C data we can observe that due to the fact that the considerable part of the low humic gley soils are located at Khok Charoen, the soil erosion problem is not found in this Tambon because none of the top fertile soil is lost due to slow surface water run. We can observe that the most of the low humic soils which are poorly drained are located in Khok Charoen district. Due to slow surface run on these the soil problem is not appear ant in this Tambon. In the case of Yang Rak the soil erosion is a problem in the area where the surface run is moderate or rapid. The same observations can also be calculated from the rest of the three Tambons. As its is oblivious from above analysis that the areas of the district with high run rate are more prone to the soil erosion problem one other factor is the lack of vegetations on the soil and land is left barren which cause soil erosion and top soil loss in the district. Figure2.6: Percentage distribution of the soil under major groups Percentage of the Soil under 6 Major Groups Khok Charoen District Lop Buri Province 11% 7% Alluvial Soil 18% Hydromorphic, Non Calcic Gley Soil 19% Low Humic Gley Soil Redish Brown lateritic Soil 2% Red Yellow Podzolic Soils Sedimentry Rocks 43% Source: Land Development Office, Lopburi Province, 2008 2.3.2 Soil Quality No exclusive data set for soil quality exists in the district. However the NRD-2C provides some indication about the point with reference to village numbers where the soil quality is shown in the village which can extrapolated to nearby soils with reference to the type of soil upon which the villages exists. The summary of the NRD-2C data set for indicator No: 27 regarding soil quality is summarized in table 2.2 as given below which provides tambon wise general picture of the soils in the district. 28
- 29. Table 2.2: Soil quality with reference to the villages in the district Name of Tambon No of villages under particular Total Number category of soil of villages Fertile soil Silted/Eroded Gravel, Sandy Soil Soil Tambon Khok Charoen 12 - - 12 Tambon Yang Rak 5 4 3 12 Tambon N. Makha 7 2 3 12 Tambon Wong Thong 6 - 3 9 Khok Same San 4 1 3 8 Source: National Rural Database-form 2C, 2007 2.3.3 Soil Suitability Based on the data and general guidelines of the land development office, the soil in the district Khok Charoen can be categorized into nine groups. The location and topography of these groups is shown on map 2.2 which has been prepared to depict the overall picture of the soil suitability in Khok Charoen district. The soil suitability, degree of fertility, limitation and recommendation regarding the soil are summarized in below given table. It may be remembered that soil suitability may not be in complete harmony with the actual cropping patterns adopted by farmers. However, if cropping patterns are somehow managed as per below given synthesis it shall result in the increasing productivity of the soil.The analysis recommends for the cultivation of the selected crops on the group areas as shown on the map. Under this analysis different groups can be suitable for same crop but the conditions for the suitability vary within groups. Table 2.3: Soil Suitability analysis of Khok Charoen District with reference to Tambons 29
- 30. Soil Found in Suitability Fertility Limitation Recommendation group Tambon Group − K.C − Paddy Crops Medium Annual Crops − Application 1 − K.S − Annual can be of both chemical − WT crops/Cash Crops cultivated if and Organic − YR and Orchards the water is fertilizer 4 /5 Tambons available in dry season Group − K.C − Paddy Very Low Sandy Loamy − Application II − K.S Soil of both chemical − WT and Organic − YR fertilizer − NM − Burring 5/5 Tambons after harvest should be discouraged Group − YR − Paddy on Low Low capacity − Application III − NM low land and to retain water of both chemical upland crops on and Organic high lands fertilizer 2/5 Tambons Group − K.C − Fruits high Soil Erosion − Application IV − K.S − Upland Problem at of both chemical − WT Crops high Slopes and Organic − YR − Perennials fertilizer − NM − Vegetables − Topography with high slopes should be covered with vegetation to 5/5 Tambons avoid soil erosion Group − K.S − Upland Low to Soil Erosion − Rotation in V − WT Crops Medium by water Cropping − YR − Livestock pattern must be − NM grazing in low observed fertile areas − Application of both chemical and Organic fertilizer − Barren lands 30
- 31. should be covered with vegetation to avoid soil erosion 4/5 Tambons Group − K.S − Upland High Soil Erosion − Application VI − WT Crops Problem of both chemical − YR − Livestock and Organic − NM grazing fertilizer − High Growth − Should be Plants covered with 4/5 Tambons − Intercropping vegetation to avoid soil erosion Group − K.S − Unsuitable for Low to High Slopes, − Conserved VII − WT any cash crop Medium Hilly Patches as forest or − YR water shed area − NM 4/5 Tambons Group − K.C − Upland Crops High Alkaline Soils − Application VIII − WT − Also Suitable of both chemical − YR for Chili, Cotton, and Organic Sugarcane, fertilizer Sorghum, Maize, − Alkaline Custard Apple, Resistant Tamarind Varieties should be introduced 3/5 Tambons Group Misalliances group − − − IX Map2.3: Soil Type 31
- 32. Source: RRDP Workshop, 2008 32
- 33. Map 2.4: Soil Suitability Map, Khok Charoen 33 Source: RRDP Workshop, 2008
- 34. 2.3.4 Alternative Analysis for Soil Suitability for Major Crops On the basis of the data from land and development office the alternative analysis has been done for the different crops in the province. Data shows that for different wide prevailing crops the suitability varies considerably. For example only about the suitability for rice cultivation in the soil is low. Only 22% of the total soil is suitable for rice around 5 % of the total soil is less suitable while rest 73 % is not suitable at all for the cultivation of rice crop. The same sort of analysis has been made for rice corn sugarcane grapefruits papaya, Banana, Asparagus, Guava, Mango and Vegetable. The overall analysis is show in figure 2.7. Figure 2.7: Alternative for Planting in Khok Charoen District Alternative For Planting in Khok Charoen District Lopburi Province 100% Percentage of the the Area 90% 80% 70% 60% Not Suitable 50% Less Sutable 40% Suitable 30% 20% 10% 0% go t rn e ce ya a e va ui us an an bl Co ua an Fr Ri p ta ag Pa n rC gi M pe G Ba gr Ve ga pa ra Su G As Name of Crop Source: Regional Rural Workshop, 2008 (Prepared on the basis of guidelines provided by Land Development Office, Lopburi Province) 2.3.5 Problems, Constraints, Needs and Potentials Problems • Poor quality of soil • Soil erosion • Flooding Constraints • Mismatch between soil suitability and existing cultivation practices • Lack of knowledge on soil conservation Potentials • Soil suitable for upland crops like sugarcane and cassava 34
- 35. • Soil doctor project is working at village level where a volunteer at village level provides technical assistance regarding soil problems Needs • Awareness raising among the local people regarding impacts of extensive use of chemical fertilizer and encourage them on use of bio fertilizer. • The public involvement in soil reclamation activities and land use planning • Establishment of local level soil erosion and flood control initiatives 2.4 Land 2.4.1 Broad Land Use Pattern Broadly, land use pattern has been categorized into 5 types. These consist of human settlement areas, other human settlement areas located in Pawangploeng-Pamuangkom- Palamnarai National Reserved Forest, agricultural area, Pawangploeng-Pamuangkom- Palamnarai National Reserved and land reform areas (in four villages of Tambon Khoksamaesan). Pa means forest area. It can guide approximate utilization of the land in Khok Charoen District. Pawangploeng-Pamuangkom-Palamnarai National Reserved Forest extended over Tambon Yangrak, Tambon Wang Thong, and some parts of Tambon Khok Charoen and Tambon Nong Makha. Overall, there are 53 human settlements within Khok Charoen District. Out of these, nineteen settlements or 36 % of total settlements were located in the degraded reserved forest represented by 12, 6 and 1 communities in Tambon Yangrak, Tambon Wang Thong and Tambon Nongmakha, respectively. Land reform areas can only be found in Tambon Khok Samae San. While agricultural areas are widely noticed in Tambon Khok Charoen, Tambon Khok Samae San and Tambon Nong Makha. And the trend of settlements will slowly be toward encroaching reserved forest. Please see detail of broad land use pattern in the map below. Map 2.5: Land Use Pattern 35
- 36. 2.4.2 Land Ownership Khok Charoen District has total area of 198,212 Rais. It has non-national reserved area of 99,314 Rais (50.10 %) of total land area, of which land ownerships registered at 69,049.94 Rais with 8,067 land plots. Title deed holders represented at highest share at 81.95 %, followed by N.S.3K at 16.49 %, while N.S.3 and Por Bor Tor 5 0combined at 1.54 %. This implies that there are almost 69 % of people who live on non-national reserved area have land ownerships whereas the rest 31 % of them did not have any types of land ownership at all. According to Natural Resources and Environmental Office of Lopburi Province, local people are upgraded and legally granted certificate of land ownerships from time to time when the government has the policy to do so. Average land holding size varies from 2-4 Rais up to 50 Rais per household. There are few people in almost all Tambons who have large size of hundreds Rais of land. Holding of land ownerships allow local communities to use as collateral for access to formal credits so that they can utilize as household investment capital in productive farm and non-farm activities. In terms of government income from the land, in 2008, Khok Charoen Land District has generated total revenues amounted at 165,761 Baht from land fee and tax. 36
- 37. Table 2.4: Types and Number of Land Ownerships in Khok Charoen District Types Number of Plots Rai % 1.Title deed 7,369 56,588.84 81.95 2.N.S.3K 653 11,392.73 16.49 3.N.S.3 1 28.83 0.04 4.Por Bor Tor 5 44 1,039.54 1.50 Certificate Total 8,067 69,049.94 100 Source: Khok Charoen District Land Office, 2008 In addition, lack of land tiles is commonly raised. Approximate 50 % and 10 % of total households in Tambon Wang Thong and Tambon Khok Samae San did not have land titles respectively. This problem was partly due to communities encroached and now resided on degraded National Reserved Forest Area. According to data from key informant interviews, landlessness is also significant problem in Tambon Khok Samae San and Tambon Wang Thong at about 6 % and 11 %, respectively, while in Tambon Nongmakha the landless incidence is marginal. This is considered a part of the whole landless scenario in these Tambons. Some of them have land for settlements but do not have land for cultivation. And some are totally landless. Their coping strategies have been rented land both for settlements and cultivation. Yet, actual magnitude of absence of land titles in Khok Charoen District could doubtedly be higher than this if further investigation is to be conducted at household level. Therefore, it is equitably necessary for TAO to render possible assistance to this group of poor people through appropriate initiative so that their social and human securities are ensured. 2.4.3 Land Reform Activities At present, land reform was only carried out in Tambon Khok Samae San in order to legally manage land which was long encroached to National Reserved Forest. A total of 305 households were granted Agricultural Land Reform Certificates (ALRC) with the whole 4,349.59 Rais of reformed land, or accounted for 2.19 % of Khok Charoen District area. After implementing the project, the average land size was redistributed at 14.26 Rais/household with the maximum holding size at 50 Rais/household. It was undertaken in 4 villages as follows: • Village 4 at 40 households of 604.68 Rais • Village 5 at 8 households of 106 Rais • Village 7 at 197 households of 2,785.62 Rais • Village 8 at 60 households of 751.77 Rais 37
- 38. Please see detail of already land reform area in the map 2.6 Map 2.6: Land Reformed in Tambon Khok Samae San, Khok Charoen District Source: RRDP Workshop, 2008 Once households registered for land reform, they will be entitled to a package of government supports for generating rural livelihoods consisting of agricultural extension and technology transfer particularly on Sufficiency Economy practices, seedling, skill trainings, environmental and natural resources management as well as capitalization using ALRC as collateral to borrow loan from Bank for Agriculture and Agricultural Cooperatives (BAAC). According to interview with Office of Land Reform of Lopburi Province, the land reform activities went well in terms of providing greater technical supports for enhancing local agricultural productivity. In fact, the government has a policy to establish a system governing land ownership and land zoning that is comprehensive and fair. And land reform is political issue and national agenda. Therefore, there is so far no clear policy on land reform at provincial level. Though there are pros and cons (particularly those who have occupied large area of land plot) existed on essence of land reform in other Tambons, many villagers 38
- 39. expressed their willingness to join government’s land reform scheme if they are to offer. Thus, there is potential to intensify land reform undertaking in other areas e.g. Tambon Yang Rak and perhaps in Tambon Khok Charoen so that equitable redistribution of land could help increase income through better local livelihoods situation and higher agricultural productivity. 2.4.4 Problems/Constraints, Potentials and Needs Land resource play crucial role in enhancing livelihoods of local communities. However, some problems existed need to be overcome in order to realize potentials in meeting the need of local villagers. Problems • Lack of land titles This is due to some communities are settled in degraded National Reserved Forest for quite long times. So they have the right to cultivate and settle but the government does not provide any land title. • Landlessness This is due to rapid population growth in Khok Charoen District causing some of them and the new settled migrants (2-4 years in migration) have become landless. • Misperception on non-commercial value of land reform certificate to use for borrowing loan from BAAC. Many local villagers misperceived that holding land reform certificates do not entitle them to access to formal credit. That is why some of them still feel against land reform provided by government. Many of local villagers only prefer N.S 3 or N.S.3K or land deeds which are difficult to obtain as by law their settlements are illegal. So government can not grant any land titles needed Potentials • Land reform has been successfully implemented in Tambon Khoksamaesan in terms of providing technical supports to farmers in to increase agricultural productivity. It could be expanded to other areas where there is potential to developed in order to optimize full capacity of the land value. • Agricultural water supply pipeline project originating from Pasak Cholasit Dam to serve some districts and terminate at Khok Charoen District opens up a prospect particularly in Tambon Khok Charoen to tap with this potential in intensifying cash crops e.g. paddy, sugarcane or cassava. Needs • Land titles Local villagers need land titles so that their land ownerships are secure. In addition, they can use land title as collateral to borrow loans from both BAAC and other commercial banks. • Land reform in Tambon Yangrak Local peoples want the government to carry out land reform activities as they realized its benefits and opportunity to increase agricultural productivity, gaining technology transfer and technical supports. 39
- 40. 2.5 Water 2.5.1 Types, Numbers and Capacity of Natural Water Resources The study area has acute water shortage every year specifically for agriculture usage. The dry season starts from March to July, while it also suffers from flooding in rainy season particularly during the months from August to October; however the frequency for flooding is mostly once every three year period. The drainage network of the district is given as Map 2.7. Though the area is receiving low precipitation in comparison with the central region and also country as a whole, however, it has sufficient natural water resources but the scarcity of reservoirs and weirs for storage of water is the main problem causing extreme situation of dryness and flooding in peak seasons. The detail of the some of natural water sources is given in Table 2.5. The water from aquifer is not suitable for drinking in all Tambons except some pockets of potable waters exists in Nong Makha sub district. Generally the underground water contains high amount of limestone and other heavy nutrients which make it unsuitable for drinking purposes. As a result heavy reliance on rainwater is the only available option for potable water. The water scarcity in dry season also substantially affects the agricultural productivity in all Tambons but the degree of scarcity varies among all Tambons. The over all picture of the status of water for above mentioned usages is given in the Table 2.5. Table 2.5: Details of the Natural Sources of Water in Khok Charoen District Pond Reservoir Weir Stream No. Cap. No Cap. No Cap. No. Cap. . . Tambon Name (M3) (M3) (M3) (M3) Khok Charoen 17 80,000 3 57,880 4 24,000 14 335,750 Yang Rak 22 105,000 3 300,000 15 72,000 19 360,000 Nong Makha 12 120,000 0 0 2 32,550 2 32,000 Wang Thong 19 307,200 3 2,640,000 14 492,000 14 492,000 Khok Samae San 3 44,800 1 128000 1 3,500 Source: Irrigation Office, 2007 40
- 41. Map 2.7: Drainage Map Showing Water Bodies Source: RRDP Workshop, 2008 2.5.2 Water Availability for different Water Uses Potable Water As earlier said, the rain is the primary source of potable water in the district. Local people have indigenous knowledge to collect and store the water in rainy season and use it in dry season when water scarcity is on its peak. Mostly the water collected in rainy season is not sufficient for the entire dry season. In the case of shortage the villages receive the water supply from district water supply Authority through respective TAO. However the drinking water is relatively not a major problem in the district. The state of drinking water in all Tambons is shown in below given figure 2.8. 41
- 42. Figure2.8: Villages with Access to Clean Drinking Water Tambon wise status of villages with Access to Clean Drinking Water, Khok Charoen District Lopburi Province 6 11 11 8 12 0 2 1 1 1 0 0 0 0 Tambon Khok Tambon Yang Tambon Nong Tambon Wong Tambon Khok Charoen Rak Makha Thong Samesan Clean Drinking water < 63 % Clean Drinking water > 63 but < or 90 Clean Drinking water > 95% Source: National Rural Database, 2007 Water for Domestic Usage The availability of water for domestic usages other than drinking is also satisfactory in almost all Tambons and also relatively better than the state of potable water in the district. The village specific data shows that the need for domestic use water is also fulfilled. People relying on village water supply scheme for fulfilling the need for domestic usage. The state of domestic water in all Tambons is shown in figure 2.9. Figure 2.9: Villages with Access to Clean Drinking Water for Domestic Uses Tambon wise status of Villages with Access to Water for Domestic usage, Khok Charoen District Lop Buri Province 11 12 12 9 8 0 1 0 0 0 0 Tambon Khok Tambon Yang Tambon W ong Tambon Nong Tambon Khok Charoen Rak Thong Makha Sames an < 63 % > 63 but < or 90 > 95% Source: National Rural Database, 2007 Water for Agriculture The dry season in the district considerably affects the availability of water for agriculture sector. Due to the scarcity of the water in dry season, the full potential of soil always remains under utilized. It has negative impacts first on the local economy and subsequently on the regional and national economy. The state of agriculture water in different tambons is shown in figure 2.10: 42
- 43. Figure 2.10: Villages with Access to Water for Agricultural Purposes Tambon wise status of villages for Access to Agriculture Water, Khok Charoen District Lop Buri Province 0 0 2 1 3 2 4 2 0 1 8 3 7 6 7 3 2 1 0 Tambon Khok Tambon Yang Tambon Nong Tambon Wong Tambon Khok Charoen Rak Makha Thong Samesan Sufficient sufficient in rainy season Not sufficient for practicing cultivation DNA Source: National Rural Database, 2007 The water scarcity and shortage in dry season considerably affects agro-economy in all tambons in terms of damage to the crops cultivated. In Tambon Khok Charoen suffers relatively high, since the Tambon is the most active in agricultural activities. The crops having high adverse effects due to shortage of water are cassava where as sugarcane also suffers due to water shortage but the severity is low due to its high water resistant capacity. In order to address the issue of scarcity of water for agriculture sector the government is working on the irrigation project on Pasak River through department of agriculture at regional level. All Tambons of the district are likely to be benefited from this project. It is expected that this project will start providing the services to the area by the end of 2008. 2.5.3 Problems, Constraints, Needs, Potential Problems • Water scarcity in all tambons in dry season • Poor quality of underground water Potential: • The topography ranging from high to low areas provide a cost effective way to build small scale check dams at various medium high slopes and thereafter distribute it through graduate flow 2.6 Forest 2.6.1 Forest Area, Boundary and Encroachment According to Provincial Natural Resource and Environment Office, Pawangploeng- Pamuangkom-Palamnarai National Reserved Forest covers 447,081.25 Rais of land crossing 4 districts namely Chaibadal, Sabot, Khoksamrong and Khokcharoen. Khok Charoen District alone shares a portion of 98,898 Rais of forest area or 49.90 % of total district area. This forest area was encroached by peoples for agricultural cultivation and other purposes at 58,081 Rais or 49.30 % of total forest area, according to data as of 1991. Out of this, 16,922 43