Regression analysis: Simple Linear Regression Multiple Linear Regression
Photoshop print screens
1. 1 2
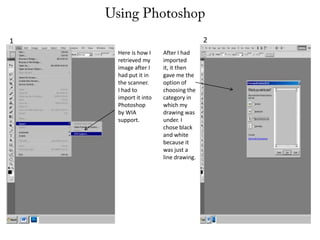
Here is how I After I had
retrieved my imported
image after I it, it then
had put it in gave me the
the scanner. option of
I had to choosing the
import it into category in
Photoshop which my
by WIA drawing was
support. under. I
chose black
and white
because it
was just a
line drawing.
2. 3 4
Here are my I then
ideas after changed the
they were setting of
successfully the image
imported from a
into bitmap to a
Photoshop. grayscale so
that I could
insert
colours into
it.
3. 5 7
After changing it to I then drew a
grayscale, I then line with the
changed it again to brush tool to
create
RGB colour, so that I
definition
could insert between the
different colours. word pulse and
the ECG line.
6 8
I zoomed I then
into the dropped
heading so in colour
that I could into the
see it clearer two
when adding sections.
lines, to get
an accurate .
4. 9
11
I then added Here is the
highlights to effect that
add definition the
to the word highlights
pulse and to created.
make it stand
out. I also did
this ready to
use the mixer
brush tool to
create a nice
effect.
12
10
I then chose I then
the mixer changed the
brush tool to colour to
blend the experiment
highlights with a wide
together. range to see
what would
look best.
5. • I then filled in the
rest of the titles in
red as this was the
desired colour
chosen in the
questionnaire.
• I decided that I
wasn’t going to use
any of these as my
mast head as they
don’t look
professional and
they’re not very eye-
catching.
• I have decided that I
will use the idea in
the first idea of
having the ECG test
merged into the title
‘Pulse’