Minneapolis-St. Paul JLL employment update January 2017
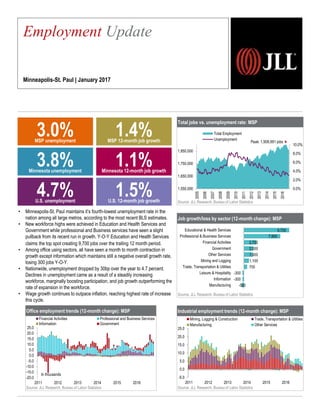
Minneapolis-St. Paul maintains it’s fourth-lowest unemployment rate in the nation among all large metros, according to the most recent BLS estimates. New workforce highs were achieved in Education and Health Services and Government while professional and Business services have seen a slight pullback from its recent run in growth. Y-O-Y Education and Health Services claims the top spot creating 9,700 jobs over the trailing 12 month period. Among office using sectors, all have seen a month to month contraction in growth except information which maintains still a negative overall growth rate, losing 300 jobs Y-O-Y. Nationwide, unemployment dropped by 30bp over the year to 4.7 percent. Declines in unemployment came as a result of a steadily increasing workforce, marginally boosting participation, and job growth outperforming the rate of expansion in the workforce. Wage growth continues to outpace inflation, reaching highest rate of increase this cycle.

Empfohlen
Empfohlen
Weitere ähnliche Inhalte
Was ist angesagt?
Was ist angesagt? (20)
Andere mochten auch
Andere mochten auch (16)
Ähnlich wie Minneapolis-St. Paul JLL employment update January 2017
Ähnlich wie Minneapolis-St. Paul JLL employment update January 2017 (20)
Mehr von Carolyn Bates
Mehr von Carolyn Bates (20)
Kürzlich hochgeladen
Kürzlich hochgeladen (20)
Minneapolis-St. Paul JLL employment update January 2017
- 1. Total jobs vs. unemployment rate: MSP Source: JLL Research, Bureau of Labor Statistics Job growth/loss by sector (12-month change): MSP Source: JLL Research, Bureau of Labor Statistics Industrial employment trends (12-month change): MSP Source: JLL Research, Bureau of Labor Statistics • Minneapolis-St. Paul maintains it’s fourth-lowest unemployment rate in the nation among all large metros, according to the most recent BLS estimates. • New workforce highs were achieved in Education and Health Services and Government while professional and Business services have seen a slight pullback from its recent run in growth. Y-O-Y Education and Health Services claims the top spot creating 9,700 jobs over the trailing 12 month period. • Among office using sectors, all have seen a month to month contraction in growth except information which maintains still a negative overall growth rate, losing 300 jobs Y-O-Y. • Nationwide, unemployment dropped by 30bp over the year to 4.7 percent. Declines in unemployment came as a result of a steadily increasing workforce, marginally boosting participation, and job growth outperforming the rate of expansion in the workforce. • Wage growth continues to outpace inflation, reaching highest rate of increase this cycle. Employment Update Minneapolis-St. Paul | January 2017 4.7%U.S. unemployment 1.5%U.S. 12-month job growth 3.0%MSP unemployment 1.4%MSP 12-month job growth 3.8%Minnesota unemployment 1.1%Minnesota 12-month job growth Office employment trends (12-month change): MSP Source: JLL Research, Bureau of Labor Statistics Peak: 1,908,991 jobs 0.0% 2.0% 4.0% 6.0% 8.0% 10.0% 1,550,000 1,650,000 1,750,000 1,850,000 2005 2006 2007 2008 2009 2010 2011 2012 2013 2014 2015 2016 Total Employment Unemployment -500 -300 -300 700 1,100 1,900 2,000 2,700 7,800 9,700 Manufacturing Information Leisure & Hospitality Trade, Transportation & Utilities Mining and Logging Other Services Government Financial Activities Professional & Business Services Educational & Health Services -5.0 0.0 5.0 10.0 15.0 20.0 25.0 2011 2012 2013 2014 2015 2016 Mining, Logging & Construction Trade, Transportation & Utilities Manufacturing Other Services -20.0 -15.0 -10.0 -5.0 0.0 5.0 10.0 15.0 20.0 25.0 2011 2012 2013 2014 2015 2016 Financial Activities Professional and Business Services Information Government In thousands
- 2. Industry employment stratification Minneapolis-St. Paul Source: JLL Research, Bureau of Labor Statistics ©2016 Jones Lang LaSalle IP, Inc. All rights reserved. Employment statistics Minneapolis-St. Paul November 2014 November 2015 November 2016 Total Non-farm Employment 1,924,400 1.6% 1,953,900 1.5% 1,981,000 1.4% Unemployment Rate 3.1% 2.8% 3.0% MSP supersectors November 2014 November 2015 November 2016 Mining, Logging & Construction 73,600 4.5% 79,300 7.7% 80,400 1.4% Manufacturing 192,800 2.8% 194,500 0.9% 194,000 -0.3% Trade, Transportation, & Utilities 351,500 1.3% 353,400 0.5% 354,000 0.2% Information 39,300 -1.8% 39,200 -0.3% 38,900 -0.8% Financial Activities 144,600 -0.3% 147,500 2.0% 150,200 1.8% Professional & Business Services 306,600 2.8% 308,200 0.5% 316,000 2.5% Educational & Health Services 312,300 2.0% 320,800 2.7% 330,500 3.0% Leisure & Hospitality 170,000 1.0% 175,100 3.0% 174,800 -0.2% Other Services 79,400 1.5% 80,800 1.8% 82,700 2.4% Government 254,300 0.5% 255,100 0.3% 257,100 0.8% For more information, please contact: Carolyn Bates | Senior Research Analyst | carolyn.bates@am.jll.com | +1 612 217 5136 Tyler Hegwood │Research Analyst | tyler.hegwood@am.jll.com | +1 612 217 5155 16% 7% 9% 2% 17% 4% 10% 18% 4% 13% Professional and Business Services Financial Activities Leisure and Hospitality Information Educational and Health Services Mining, Logging and construction Manufacturing Trade, transportation and Utilities Other Services Government