United Technologies Corporation technical analysis charts
•
0 gefällt mir•101 views

http://www.chartician.com/ United Technologies Corporation technical analysis charts

Empfohlen
Empfohlen
Weitere ähnliche Inhalte
Kürzlich hochgeladen
Kürzlich hochgeladen (20)
Empfohlen
Empfohlen (20)
United Technologies Corporation technical analysis charts
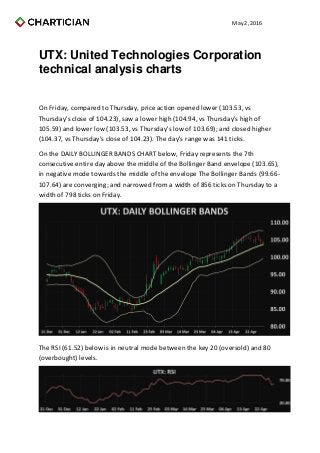
- 1. May 2, 2016 UTX: United Technologies Corporation technical analysis charts On Friday, compared to Thursday, price action opened lower (103.53, vs Thursday's close of 104.23), saw a lower high (104.94, vs Thursday's high of 105.59) and lower low (103.53, vs Thursday's low of 103.69); and closed higher (104.37, vs Thursday's close of 104.23). The day's range was 141 ticks. On the DAILY BOLLINGER BANDS CHART below, Friday represents the 7th consecutive entire day above the middle of the Bollinger Band envelope (103.65), in negative mode towards the middle of the envelope The Bollinger Bands (99.66- 107.64) are converging; and narrowed from a width of 856 ticks on Thursday to a width of 798 ticks on Friday. The RSI (61.52) below is in neutral mode between the key 20 (oversold) and 80 (overbought) levels.
- 2. May 2, 2016 The MACD 12 day moving average is below the MACD 26 day moving average; both are above zero. The MACD 12 day moving average has just crossed below the MACD 26 day moving average, generating a negative signal. The Slow Stochastics, below, are in negative mode, with the K line below the D line. The Commodity Channel Index (27.00), below, is in negative mode below the overbought 200 level. On the 20-DAY MOVING AVERAGE ENVELOPE CHART below, price action rose towards the top of the 20 day moving average envelope (103.65). The parameters of the envelope (100.54-106.76) are pointing higher.
- 3. May 2, 2016 On the 5 AND 20 DAY MOVING AVERAGES CHART below, the 5 day moving average (104.90, moving down) is above the 20 day moving average (103.65, moving up), in positive mode. The 3-50 day strip of moving averages ranges from the 50 day moving average (99.64) at the bottom of the range to the 10 day moving average (105.13) at the top of the range.
- 4. May 2, 2016 The Parabolic Stop and Reverse (106.99) below is in the 2nd day of sell mode. On the WEEKLY BOLLINGER BANDS CHART below, last week represents the 2nd consecutive entire week below the top Bollinger Band (108.01). The Bollinger Bands (82.22-108.01) are diverging; expanding from a width of 2,438 ticks on Thursday to a width of 2,579 ticks on Friday.