Stock Research Report for RIG as of 9/8/11 - Chaikin Power Tools
•
1 gefällt mir•127 views

To order a free Chaikin Power Gauge stock research report for RIG go to http://www.chaikinpowertools.com/reports

Empfohlen
Empfohlen
Weitere ähnliche Inhalte
Kürzlich hochgeladen
Kürzlich hochgeladen (20)
Empfohlen
Empfohlen (20)
Stock Research Report for RIG as of 9/8/11 - Chaikin Power Tools
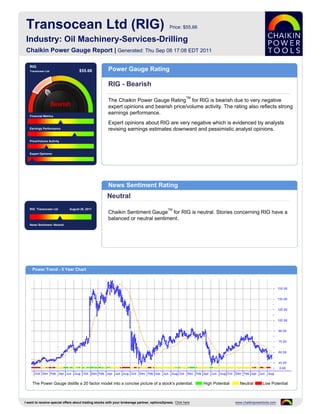
- 1. Transocean Ltd (RIG) Price: $55.66 Industry: Oil Machinery-Services-Drilling Chaikin Power Gauge Report | Generated: Thu Sep 08 17:08 EDT 2011 RIG Transocean Ltd $55.66 Power Gauge Rating RIG - Bearish TM The Chaikin Power Gauge Rating for RIG is bearish due to very negative expert opinions and bearish price/volume activity. The rating also reflects strong earnings performance. Financial Metrics Expert opinions about RIG are very negative which is evidenced by analysts Earnings Performance revising earnings estimates downward and pessimistic analyst opinions. Price/Volume Activity Expert Opinions News Sentiment Rating Neutral RIG Transocean Ltd August 26, 2011 TM Chaikin Sentiment Gauge for RIG is neutral. Stories concerning RIG have a balanced or neutral sentiment. News Sentiment :Neutral Power Trend - 5 Year Chart The Power Gauge distills a 20 factor model into a concise picture of a stock's potential. High Potential Neutral Low Potential I want to receive special offers about trading stocks with your brokerage partner, optionsXpress. Click here www.chaikinpowertools.com
- 2. Financials & Earnings Financial Metrics Financial Metrics Rating LT Debt/Equity Ratio Neutral Price to Book Value RIG's financial metrics are neutral. The company may be undervalued and yields a relatively low return on shareholder's equity. Return on Equity The rank is based on a low price to book value, low return on equity and high price to sales ratio. Price to Sales Ratio Business Value Assets and Liabilities Valuation Returns Ratio TTM Ratio TTM Ratio TTM Current Ratio 1.50 Price/Book 0.85 Return on Invest 3.4% LT Debt/Equity 0.43 Price/Sales 1.86 Return on Equity 5.0% Earnings Performance Earnings Performance Rating Earnings Growth Bullish Earnings Surprise RIG's earnings performance has been strong. The company has a history of strong earnings growth and is priced relatively low compared to next year's projected EPS. Earnings Trend The rank is based on high earnings growth over the past 3-5 years, worse than Projected P/E Ratio expected earnings in recent quarters, a relatively low projected P/E ratio and consistent earnings over the past 5 years. Earnings Consistency 5 Year Revenue and Earnings Growth EPS Estimates 12/06 12/07 12/08 12/09 12/10 Factor Actual EPS Prev EST EPS Current Change Revenue(M) 3,882.00 6,377.00 12,674.00 11,556.00 9,576.00 Quarterly EPS $1.15 $0.80 -0.35 Rev % Growth 34.25% 64.27% 98.75% -8.82% -17.13% Yearly EPS $2.99 $3.60 +0.61 EPS $6.32 $14.65 $13.20 $9.87 $2.99 Factor Actual EPS Growth Est EPS Growth Change EPS % Growth 101.85% 131.88% -9.90% -25.23% -69.71% 3-5 year EPS 34.26% 10.50% -23.76 EPS Surprise EPS Quarterly Results Estimate Actual Difference % Difference FY Qtr 1 Qtr 2 Qtr 3 Qtr 4 Total Latest Qtr $0.77 $0.65 $-0.12 -15.58 12/09 $2.94 $2.50 $2.20 $2.24 $9.88 1 Qtr Ago $0.80 $0.54 $-0.26 -32.50 12/10 $2.10 $2.23 $1.15 $-2.51 $2.97 2 Qtr Ago $0.87 $0.76 $-0.11 -12.64 12/11 $0.96 $0.48 - - - 3 Qtr Ago $1.39 $1.29 $-0.10 -7.19 Fiscal Year End Month is December. I want to receive special offers about trading stocks with your brokerage partner, optionsXpress. Click here www.chaikinpowertools.com
- 3. Price Trend & Expert Opinions Price/Volume Activity Price/Volume Activity Rating Relative Strength vs Market Bearish Chaikin Money Flow Price and volume activity for RIG is bearish. RIG has underperformed the S&P 500 over 26 weeks and is experiencing sustained selling. Price Trend The rank for RIG is based on its relative weakness versus the market, negative Price Trend ROC Chaikin money flow, a positive Chaikin price trend ROC and a decreasing volume trend. Volume Trend Relative Strength vs S&P500 Index Chaikin Money Flow Chart shows whether RIG is performing better or worse than the market. Chaikin Money Flow analyzes supply and demand for a company's stock. Price Activity Price Activity Volume Activity Factor Value Factor Value Factor Value 52 Week High 85.47 % Change Price - 4 Weeks 9.55% Average Volume 20 Days 3,924,788 52 Week Low 49.24 % Change Price - 24 Weeks -30.45% Average Volume 90 Days 4,557,603 % Change YTD Rel S&P 500 -17.19% % Change Price - 4 Wks Rel to S&P 2.43% Chaikin Money Flow Persistency 13% % Change Price - 24 Wks Rel to S&P -24.71% Expert Opinions Expert Opinions Earnings Estimate Revisions Very Bearish Short Interest Expert opinions about RIG are very negative. Analysts are lowering their EPS estimates for RIG and analysts's opinions on RIG have been more negative Insider Activity recently. The rank for RIG is based on analysts revising earnings estimates downward, a Analyst Opinions low short interest ratio, pessimistic analyst opinions and relative weakness of the stock versus the Oil Machinery-Services-Drilling industry group. Relative Strength vs Industry Earnings Estimate Revisions Analyst Recommendations EPS Estimates Revision Summary Current 7 Days Ago % Change Factor Value Last Week Last 4 Weeks Current Qtr 0.80 0.81 -1.23% Mean this Week Buy Up Down Up Down Next Qtr 1.37 1.38 -0.72% Mean Last Week Buy Curr Qtr 0 1 1 12 Curr Yr 0 0 0 2 Current 30 Days Ago % Change Change 0.00 Next Qtr 0 1 2 9 Current FY 3.60 3.78 -0.18 Mean 5 Weeks Ago Buy Next Yr 0 1 11 2 I want to receive special offers about trading stocks with your brokerage partner, optionsXpress. Click here www.chaikinpowertools.com
- 4. The Company & Its Competitors RIG's Competitors in Oil Machinery-Services-Drilling News Headlines for RIG Company Power Historic EPS Projected EPS Profit Margin PEG PE Revenue(M) Deep water drillers shares up as analyst Gauge growth growth upgrades - Jul 15, 2011 RIG 34.26% 10.50% 0.38% 1.47 16.87 9,576 Transocean charged with tax evasion in Norway HP 20.60% - 16.48% - 15.46 1,875 - Jun 22, 2011 Companies, Crews and Regulators Share Blame NBR 6.58% 22.27% 5.52% 0.55 14.59 4,216 in Coast Guard Report on Oil Spill - Apr 23, SDRL 24.18% 11.17% 46.98% 0.96 11.08 4,041 2011 Coast Guard Cites Many Lapses in Sinking of ESV 14.47% 16.00% 24.39% 0.86 17.19 1,697 Deepwater Oil Rig - Apr 22, 2011 NE 18.48% 16.00% 11.91% 1.25 31.24 2,807 Transocean’s Safety Claim Is Criticized - RDC 13.68% 16.00% 41.93% 1.25 22.60 1,819 Apr 4, 2011 DO 25.04% 16.00% 28.69% 0.64 9.23 3,323 Company Details Company Profile TRANSOCEAN LTD Transocean LTD., formerly Transocean Inc., is an international provider of offshore BLANDONNET INTERNATIONAL contract drilling services for oil and gas wells. The company offers deepwater and harsh BUSINESS CENTER environment drilling, oil and gas drilling management, and drilling engineering and project VERNIER, V8 1214 management services, as well as explores, develops, and produces oil and gas CHE resources. The company is based in Houston, Texas. Phone: 41-58-792-9243 Fax: 41 713 232 77 50 Website: http://http://www.deepwater.com Full Time Employees: 18,050 Sector: Oils/Energy Power Gauge Ratings are created using a relative ranking system that assigns a rank of 0 to 100 (100 being the highest) to each stock in the universe. Rank is calculated by evaluating each of the stocks factors and combining them into a single number using a weighting formula. A stock's rank ranges from 100-0, where 100 is the strongest, and a rank of 95 indicates the stock is better than 95% of the stocks in the universe. Chaikin Stock Research(CSR) is not registered as a securities broker dealer or investment advisor with either the U.S. Securities and Exchange Commission or with any state securities regulatory authority. CSR is not responsible for trades executed by users of this research report, our web site or mobile app based on the information included herein. The information presented in this report does not represent a recommendation to buy or sell stocks or any financial instrument nor is it intended as an endorsement of any security or investment. The information in this report is generic by nature and is not personalized to the specific financial situation of any individual. The user bears complete responsibility for their own investment research and should seek the advice of a qualified investment professional before making any investment decisions. Copyright (c) 1978-(Present) by ZACKS Investment Research, Inc ("ZACKS"). The information, data, analyses and opinions contained herein (1) includes the confidential and proprietary information of ZACKS, (2) may not be copied or redistributed, for any purpose, (3) does not constitute investment advice offered by ZACKS, (4) are provided solely for informational purposes, and (5) are not warranted or represented to be correct, complete, accurate or timely. ZACKS shall not be responsible for investment decisions, damages or other losses resulting from, or related to, use of this information, data, analyses or opinions. Past performance is no guarantee of future performance. ZACKS is not affiliated with Chaikin Power Tools. This report from Chaikin Power Tools is for informational purposes only and is not a recommendation to buy or sell securities. LM 2.3 DS 3.0 LS 2.1 Data Provided by ZACKS Investment Research, Inc., www.zacks.com Special offers to trade stocks from optionsXpress: www.chaikinpowertools.com