Stock Research Report for MA as of 9/8/11 - Chaikin Power Tools
•
1 gefällt mir•150 views

To order a free Chaikin Power Gauge stock research report for MA go to http://www.chaikinpowertools.com/reports

Empfohlen
Empfohlen
Weitere ähnliche Inhalte
Mehr von Dan Oconnor
Mehr von Dan Oconnor (7)
Kürzlich hochgeladen
Kürzlich hochgeladen (20)
Stock Research Report for MA as of 9/8/11 - Chaikin Power Tools
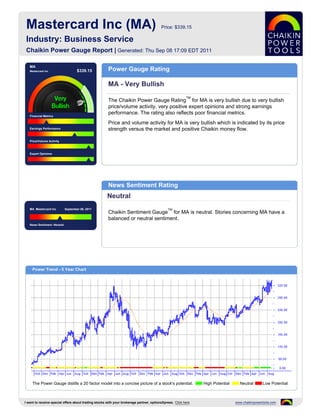
- 1. Mastercard Inc (MA) Price: $339.15 Industry: Business Service Chaikin Power Gauge Report | Generated: Thu Sep 08 17:09 EDT 2011 MA Mastercard Inc $339.15 Power Gauge Rating MA - Very Bullish TM The Chaikin Power Gauge Rating for MA is very bullish due to very bullish price/volume activity, very positive expert opinions and strong earnings performance. The rating also reflects poor financial metrics. Financial Metrics Price and volume activity for MA is very bullish which is indicated by its price Earnings Performance strength versus the market and positive Chaikin money flow. Price/Volume Activity Expert Opinions News Sentiment Rating Neutral MA Mastercard Inc September 06, 2011 TM Chaikin Sentiment Gauge for MA is neutral. Stories concerning MA have a balanced or neutral sentiment. News Sentiment :Neutral Power Trend - 5 Year Chart The Power Gauge distills a 20 factor model into a concise picture of a stock's potential. High Potential Neutral Low Potential I want to receive special offers about trading stocks with your brokerage partner, optionsXpress. Click here www.chaikinpowertools.com
- 2. Financials & Earnings Financial Metrics Financial Metrics Rating LT Debt/Equity Ratio Bearish Price to Book Value MA's financial metrics are poor. The company may be overvalued and has relatively low revenue per share. Return on Equity The rank is based on a low long term debt to equity ratio, high price to book value ratio, high return on equity, high price to sales ratio and relatively low cash flow. Price to Sales Ratio Business Value Assets and Liabilities Valuation Returns Ratio TTM Ratio TTM Ratio TTM Current Ratio 2.03 Price/Book 7.87 Return on Invest 40.5% LT Debt/Equity 0.00 Price/Sales 7.78 Return on Equity 40.5% Earnings Performance Earnings Performance Rating Earnings Growth Bullish Earnings Surprise MA's earnings performance has been strong. The company has a history of strong earnings growth and has a stable 5 year earnings trend. Earnings Trend The rank is based on high earnings growth over the past 3-5 years, better than expected earnings in recent quarters, a relatively high projected P/E ratio and Projected P/E Ratio consistent earnings over the past 5 years. Earnings Consistency 5 Year Revenue and Earnings Growth EPS Estimates 12/06 12/07 12/08 12/09 12/10 Factor Actual EPS Prev EST EPS Current Change Revenue(M) 3,326.07 4,067.60 5,526.10 5,098.68 5,539.00 Quarterly EPS $3.96 $4.82 +0.86 Rev % Growth 13.22% 22.29% 35.86% -7.73% 8.64% Yearly EPS $14.10 $17.69 +3.59 EPS $0.37 $8.05 $-1.95 $11.19 $14.10 Factor Actual EPS Growth Est EPS Growth Change EPS % Growth -86.14% 2,075.68% -124.22% 673.85% 26.01% 3-5 year EPS 14.46% 16.56% +2.10 EPS Surprise EPS Quarterly Results Estimate Actual Difference % Difference FY Qtr 1 Qtr 2 Qtr 3 Qtr 4 Total Latest Qtr $4.21 $4.76 $0.55 13.06 12/09 $2.81 $2.67 $3.46 $2.25 $11.19 1 Qtr Ago $4.10 $4.29 $0.19 4.63 12/10 $3.47 $3.50 $3.96 $3.17 $14.10 2 Qtr Ago $3.05 $3.16 $0.11 3.61 12/11 $4.31 $4.77 - - - 3 Qtr Ago $3.54 $3.94 $0.40 11.30 Fiscal Year End Month is December. I want to receive special offers about trading stocks with your brokerage partner, optionsXpress. Click here www.chaikinpowertools.com
- 3. Price Trend & Expert Opinions Price/Volume Activity Price/Volume Activity Rating Relative Strength vs Market Very Bullish Chaikin Money Flow Price and volume activity for MA is very bullish. MA has outperformed the S&P 500 over 26 weeks and is experiencing sustained buying. Price Trend The rank for MA is based on its price strength versus the market, positive Chaikin Price Trend ROC money flow, a positive Chaikin price trend, a negative Chaikin price trend ROC and an increasing volume trend. Volume Trend Relative Strength vs S&P500 Index Chaikin Money Flow Chart shows whether MA is performing better or worse than the market. Chaikin Money Flow analyzes supply and demand for a company's stock. Price Activity Price Activity Volume Activity Factor Value Factor Value Factor Value 52 Week High 339.10 % Change Price - 4 Weeks 11.65% Average Volume 20 Days 1,279,178 52 Week Low 191.98 % Change Price - 24 Weeks 37.36% Average Volume 90 Days 1,273,948 % Change YTD Rel S&P 500 53.29% % Change Price - 4 Wks Rel to S&P 4.40% Chaikin Money Flow Persistency 65% % Change Price - 24 Wks Rel to S&P 48.70% Expert Opinions Expert Opinions Earnings Estimate Revisions Very Bullish Short Interest Expert opinions about MA are very positive. Analysts are raising their EPS estimates for MA and shorting of MA is low. Insider Activity The rank for MA is based on analysts revising earnings estimates upward, a low short interest ratio, insiders not purchasing significant amounts of stock, optimistic Analyst Opinions analyst opinions and price strength of the stock versus the Business Service industry group. Relative Strength vs Industry Earnings Estimate Revisions Analyst Recommendations EPS Estimates Revision Summary Current 7 Days Ago % Change Factor Value Last Week Last 4 Weeks Current Qtr 4.82 4.82 0.00% Mean this Week Buy Up Down Up Down Next Qtr 3.93 3.93 0.00% Mean Last Week Buy Curr Qtr 0 0 0 0 Curr Yr 0 0 0 1 Current 30 Days Ago % Change Change 0.00 Next Qtr 0 0 0 0 Current FY 17.69 17.70 -0.01 Mean 5 Weeks Ago Strong Buy Next Yr 0 0 0 2 I want to receive special offers about trading stocks with your brokerage partner, optionsXpress. Click here www.chaikinpowertools.com
- 4. The Company & Its Competitors MA's Competitors in Business Service News Headlines for MA Company Power Historic EPS Projected EPS Profit Margin PEG PE Revenue(M) Bank of America to sell Canadian card business Gauge growth growth - Aug 15, 2011 MA 14.46% 16.56% 34.85% 1.16 21.00 5,539 Bank of America to sell Canadian card business HPY 17.72% 15.43% 1.74% 1.32 23.80 1,864 - Aug 15, 2011 Court approves credit card steering settlement - V 33.83% 16.60% 39.72% 1.07 18.95 8,065 Jul 20, 2011 LPS 3.62% 7.67% 9.69% 0.88 5.30 2,456 Competition Bureau could force Maple to sell off assets, insiders say - Jul 19, 2011 ADS 14.17% 15.00% 8.68% 0.92 14.86 2,791 Senate Votes Down A Delay in Rules On Debit FIS 61.33% 13.80% 7.82% 0.84 12.42 5,270 Card Fees - Jun 9, 2011 FISV 1.30% 12.50% 10.67% 0.96 12.77 4,133 GPN 15.68% 12.82% 11.25% 1.12 16.06 1,860 Company Details Company Profile MASTERCARD INC MASTERCARD INCORPORATED advances global commerce by providing a critical 2000 PURCHASE STREET economic link among financial institutions, businesses, cardholders and merchants PURCHASE, NY 10577 worldwide. As a franchisor, processor and advisor, MasterCard develops and markets USA payment solutions and provides industry-leading analysis and consulting services to Phone: 9142492000 financial institution customers and merchants. Its family of brands include MasterCard, Fax: 914-249-4206 Maestro and Cirrus. Website: http://http://www.mastercard.com Full Time Employees: 5,600 Sector: Business Services Power Gauge Ratings are created using a relative ranking system that assigns a rank of 0 to 100 (100 being the highest) to each stock in the universe. Rank is calculated by evaluating each of the stocks factors and combining them into a single number using a weighting formula. A stock's rank ranges from 100-0, where 100 is the strongest, and a rank of 95 indicates the stock is better than 95% of the stocks in the universe. Chaikin Stock Research(CSR) is not registered as a securities broker dealer or investment advisor with either the U.S. Securities and Exchange Commission or with any state securities regulatory authority. CSR is not responsible for trades executed by users of this research report, our web site or mobile app based on the information included herein. The information presented in this report does not represent a recommendation to buy or sell stocks or any financial instrument nor is it intended as an endorsement of any security or investment. The information in this report is generic by nature and is not personalized to the specific financial situation of any individual. The user bears complete responsibility for their own investment research and should seek the advice of a qualified investment professional before making any investment decisions. Copyright (c) 1978-(Present) by ZACKS Investment Research, Inc ("ZACKS"). The information, data, analyses and opinions contained herein (1) includes the confidential and proprietary information of ZACKS, (2) may not be copied or redistributed, for any purpose, (3) does not constitute investment advice offered by ZACKS, (4) are provided solely for informational purposes, and (5) are not warranted or represented to be correct, complete, accurate or timely. ZACKS shall not be responsible for investment decisions, damages or other losses resulting from, or related to, use of this information, data, analyses or opinions. Past performance is no guarantee of future performance. ZACKS is not affiliated with Chaikin Power Tools. This report from Chaikin Power Tools is for informational purposes only and is not a recommendation to buy or sell securities. LM 2.3 DS 3.0 LS 2.1 Data Provided by ZACKS Investment Research, Inc., www.zacks.com Special offers to trade stocks from optionsXpress: www.chaikinpowertools.com