Stock Research Report for DFS as of 7/27/11 - Chaikin Power Tools
•
1 gefällt mir•145 views

To order a free Chaikin Power Gauge stock research report for DFS go to http://www.chaikinpowertools.com/reports

Empfohlen
Weitere ähnliche Inhalte
Mehr von Dan Oconnor
Mehr von Dan Oconnor (10)
Kürzlich hochgeladen
Kürzlich hochgeladen (20)
Stock Research Report for DFS as of 7/27/11 - Chaikin Power Tools
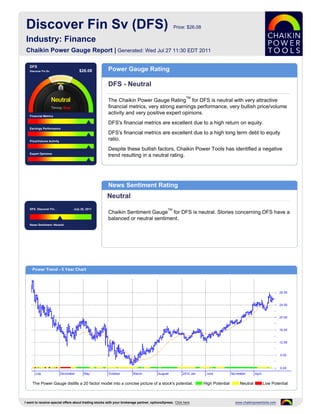
- 1. Discover Fin Sv (DFS) Price: $26.08 Industry: Finance Chaikin Power Gauge Report | Generated: Wed Jul 27 11:30 EDT 2011 DFS Discover Fin Sv $26.08 Power Gauge Rating DFS - Neutral TM The Chaikin Power Gauge Rating for DFS is neutral with very attractive financial metrics, very strong earnings performance, very bullish price/volume activity and very positive expert opinions. Financial Metrics DFS's financial metrics are excellent due to a high return on equity. Earnings Performance DFS's financial metrics are excellent due to a high long term debt to equity Price/Volume Activity ratio. Despite these bullish factors, Chaikin Power Tools has identified a negative Expert Opinions trend resulting in a neutral rating. News Sentiment Rating Neutral DFS Discover Fin .. July 20, 2011 TM Chaikin Sentiment Gauge for DFS is neutral. Stories concerning DFS have a balanced or neutral sentiment. News Sentiment :Neutral Power Trend - 5 Year Chart The Power Gauge distills a 20 factor model into a concise picture of a stock's potential. High Potential Neutral Low Potential I want to receive special offers about trading stocks with your brokerage partner, optionsXpress. Click here www.chaikinpowertools.com
- 2. Financials & Earnings Financial Metrics Financial Metrics Rating LT Debt/Equity Ratio Very Bullish Price to Book Value DFS's financial metrics are excellent. The company yields a high return on shareholder's equity and generates high free cash flow relative to market Return on Equity capitalization. The rank is based on a high long term debt to equity ratio, high return on equity Price to Sales Ratio and relatively high cash flow. Business Value Assets and Liabilities Valuation Returns Ratio TTM Ratio TTM Ratio TTM Current Ratio 1.44 Price/Book 2.20 Return on Invest 6.7% LT Debt/Equity 2.74 Price/Sales 1.73 Return on Equity 24.7% Earnings Performance Earnings Performance Rating Earnings Growth Very Bullish Earnings Surprise DFS's earnings performance has been very strong. The company has a history of strong earnings growth and has outperformed analysts' earnings estimates. Earnings Trend The rank is based on high earnings growth over the past 3-5 years, better than expected earnings in recent quarters, an upward trend in earnings this year, a Projected P/E Ratio relatively low projected P/E ratio and inconsistent earnings over the past 5 years. Earnings Consistency 5 Year Revenue and Earnings Growth EPS Estimates 11/06 11/07 11/08 11/09 11/10 Factor Actual EPS Prev EST EPS Current Change Revenue(M) 5,997.46 5,051.87 6,957.02 10,378.75 8,241.22 Quarterly EPS $0.47 $0.80 +0.33 Rev % Growth 17.32% -15.77% 37.71% 49.18% -20.60% Yearly EPS $1.23 $3.49 +2.26 EPS $2.26 $1.18 $1.93 $2.42 $1.23 Factor Actual EPS Growth Est EPS Growth Change EPS % Growth 86.78% -47.79% 63.56% 25.39% -49.17% 3-5 year EPS 13.57% 12.33% -1.24 EPS Surprise EPS Quarterly Results Estimate Actual Difference % Difference FY Qtr 1 Qtr 2 Qtr 3 Qtr 4 Total Latest Qtr $0.72 $1.09 $0.37 51.39 11/09 $0.25 $0.43 $1.09 $0.63 $2.40 1 Qtr Ago $0.53 $0.84 $0.31 58.49 11/10 $-0.22 $0.34 $0.47 $0.64 $1.23 2 Qtr Ago $0.42 $0.64 $0.22 52.38 11/11 $0.84 $1.09 - - - 3 Qtr Ago $0.35 $0.47 $0.12 34.29 Fiscal Year End Month is November. I want to receive special offers about trading stocks with your brokerage partner, optionsXpress. Click here www.chaikinpowertools.com
- 3. Price Trend & Expert Opinions Price/Volume Activity Price/Volume Activity Rating Relative Strength vs Market Very Bullish Chaikin Money Flow Price and volume activity for DFS is very bullish. DFS has outperformed the S&P 500 over 26 weeks and is experiencing sustained buying. Price Trend The rank for DFS is based on its price strength versus the market, positive Price Trend ROC Chaikin money flow, a positive Chaikin price trend, a negative Chaikin price trend ROC and an increasing volume trend. Volume Trend Relative Strength vs S&P500 Index Chaikin Money Flow Chart shows whether DFS is performing better or worse than the market. Chaikin Money Flow analyzes supply and demand for a company's stock. Price Activity Price Activity Volume Activity Factor Value Factor Value Factor Value 52 Week High 27.52 % Change Price - 4 Weeks 5.20% Average Volume 20 Days 7,344,930 52 Week Low 13.91 % Change Price - 24 Weeks 26.54% Average Volume 90 Days 6,437,471 % Change YTD Rel S&P 500 31.05% % Change Price - 4 Wks Rel to S&P 0.19% Chaikin Money Flow Persistency 80% % Change Price - 24 Wks Rel to S&P 24.54% Expert Opinions Expert Opinions Earnings Estimate Revisions Very Bullish Short Interest Expert opinions about DFS are very positive. Analysts are raising their EPS estimates for DFS and shorting of DFS is low. Insider Activity The rank for DFS is based on analysts revising earnings estimates upward, a low short interest ratio, insiders not purchasing significant amounts of stock and Analyst Opinions optimistic analyst opinions. Relative Strength vs Industry Earnings Estimate Revisions Analyst Recommendations EPS Estimates Revision Summary Current 7 Days Ago % Change Factor Value Last Week Last 4 Weeks Current Qtr 0.82 0.80 +2.50% Mean this Week Buy Up Down Up Down Next Qtr 0.78 0.77 +1.30% Mean Last Week Buy Curr Qtr 0 0 2 0 Curr Yr 0 0 4 0 Current 30 Days Ago % Change Change 0.00 Next Qtr 0 0 2 0 Current FY 3.55 3.33 0.22 Mean 5 Weeks Ago Buy Next Yr 0 0 4 0 I want to receive special offers about trading stocks with your brokerage partner, optionsXpress. Click here www.chaikinpowertools.com
- 4. The Company & Its Competitors DFS's Competitors in Finance News Headlines for DFS Company Power Historic EPS Projected EPS Profit Margin PEG PE Revenue(M) Business events scheduled for Thursday - Jun Gauge growth growth 22, 2011 DFS 13.57% 12.33% 22.75% 0.61 8.58 8,241 Discover Financial to buy back $1 billion in stock EZPW 28.83% 15.00% 13.64% 0.86 13.59 733 - Jun 15, 2011 Discover Financial Services Announces $1 AEA 4.31% 15.00% 6.71% 0.62 10.43 600 Billion Share Repurchase Program - Jun 15, CACC 17.31% - 39.20% - 13.56 442 2011 Tree.com sells mortgage unit to Discover COF 10.77% 9.80% 19.17% 0.69 6.43 19,067 Financial - May 12, 2011 NNI 1.51% 17.00% 17.91% 0.28 3.94 1,062 Discover to Acquire Mortgage Origination WRLD 15.15% - 18.57% - 12.15 491 Business from Tree.com for $55.9 Million - May 12, 2011 SLM 42.41% 10.00% 1.88% 0.89 7.80 6,776 Company Details Company Profile DISCOVER FIN SV Discover Financial Services operates the Discover Card with more than fifty million 2500 LAKE COOK ROAD cardmembers, the Discover Network with millions of merchant and cash access locations, RIVERWOODS, IL 60015 and the Goldfish credit card business in the United Kingdom. Discover Financial Services USA also operates the pulse ATM/debit network, which serves more than four thousand four Phone: 224-405-0900 hundred financial institutions and includes nearly two lakhs sixty thousand ATMs, as well Fax: 224-405-4993 as POS terminals, nationwide. Website: http://www.discoverfinancial.com Full Time Employees: 10,300 Sector: Finance Power Gauge Ratings are created using a relative ranking system that assigns a rank of 0 to 100 (100 being the highest) to each stock in the universe. Rank is calculated by evaluating each of the stocks factors and combining them into a single number using a weighting formula. A stock's rank ranges from 100-0, where 100 is the strongest, and a rank of 95 indicates the stock is better than 95% of the stocks in the universe. Chaikin Stock Research(CSR) is not registered as a securities broker dealer or investment advisor with either the U.S. Securities and Exchange Commission or with any state securities regulatory authority. CSR is not responsible for trades executed by users of this research report, our web site or mobile app based on the information included herein. The information presented in this report does not represent a recommendation to buy or sell stocks or any financial instrument nor is it intended as an endorsement of any security or investment. The information in this report is generic by nature and is not personalized to the specific financial situation of any individual. The user bears complete responsibility for their own investment research and should seek the advice of a qualified investment professional before making any investment decisions. Copyright (c) 1978-(Present) by ZACKS Investment Research, Inc ("ZACKS"). The information, data, analyses and opinions contained herein (1) includes the confidential and proprietary information of ZACKS, (2) may not be copied or redistributed, for any purpose, (3) does not constitute investment advice offered by ZACKS, (4) are provided solely for informational purposes, and (5) are not warranted or represented to be correct, complete, accurate or timely. ZACKS shall not be responsible for investment decisions, damages or other losses resulting from, or related to, use of this information, data, analyses or opinions. Past performance is no guarantee of future performance. ZACKS is not affiliated with Chaikin Power Tools. This report from Chaikin Power Tools is for informational purposes only and is not a recommendation to buy or sell securities. LM 2.3 DS 3.0 LS 2.1 Data Provided by ZACKS Investment Research, Inc., www.zacks.com Special offers to trade stocks from optionsXpress: www.chaikinpowertools.com