Stock Research Report for CI as of 6/23/11 - Chaikin Power Tools
•
1 gefällt mir•156 views

To order a free Chaikin Power Gauge stock research report for CI go to http://www.chaikinpowertools.com/reports

Empfohlen
Empfohlen
Weitere ähnliche Inhalte
Mehr von Dan Oconnor
Mehr von Dan Oconnor (7)
Kürzlich hochgeladen
Kürzlich hochgeladen (20)
Stock Research Report for CI as of 6/23/11 - Chaikin Power Tools
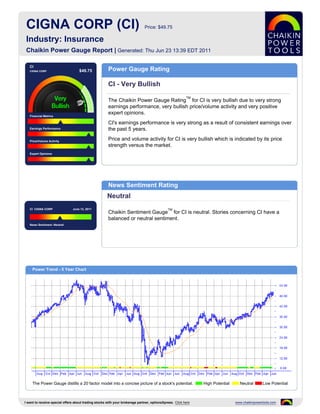
- 1. CIGNA CORP (CI) Price: $49.75 Industry: Insurance Chaikin Power Gauge Report | Generated: Thu Jun 23 13:39 EDT 2011 CI CIGNA CORP $49.75 Power Gauge Rating CI - Very Bullish TM The Chaikin Power Gauge Rating for CI is very bullish due to very strong earnings performance, very bullish price/volume activity and very positive expert opinions. Financial Metrics CI's earnings performance is very strong as a result of consistent earnings over Earnings Performance the past 5 years. Price/Volume Activity Price and volume activity for CI is very bullish which is indicated by its price strength versus the market. Expert Opinions News Sentiment Rating Neutral CI CIGNA CORP June 13, 2011 TM Chaikin Sentiment Gauge for CI is neutral. Stories concerning CI have a balanced or neutral sentiment. News Sentiment :Neutral Power Trend - 5 Year Chart The Power Gauge distills a 20 factor model into a concise picture of a stock's potential. High Potential Neutral Low Potential I want to receive special offers about trading stocks with your brokerage partner, optionsXpress. Click here www.chaikinpowertools.com
- 2. Financials & Earnings Financial Metrics Financial Metrics Rating LT Debt/Equity Ratio Neutral Price to Book Value CI's financial metrics are neutral. The company yields a high return on shareholder's equity and is carrying too much long term debt. Return on Equity The rank is based on a high long term debt to equity ratio, high return on equity, high price to sales ratio and relatively high cash flow. Price to Sales Ratio Business Value Assets and Liabilities Valuation Returns Ratio TTM Ratio TTM Ratio TTM Current Ratio 0.35 Price/Book 1.92 Return on Invest 15.1% LT Debt/Equity 0.34 Price/Sales 0.63 Return on Equity 20.9% Earnings Performance Earnings Performance Rating Earnings Growth Very Bullish Earnings Surprise CI's earnings performance has been very strong. The company has a stable 5 year earnings trend and has outperformed analysts' earnings estimates. Earnings Trend The rank is based on better than expected earnings in recent quarters, a relatively poor trend in earnings this year, a relatively low projected P/E ratio and Projected P/E Ratio consistent earnings over the past 5 years. Earnings Consistency 5 Year Revenue and Earnings Growth EPS Estimates 12/06 12/07 12/08 12/09 12/10 Factor Actual EPS Prev EST EPS Current Change Revenue(M) 16,547.00 17,623.00 - 18,414.00 21,253.00 Quarterly EPS $1.06 $1.26 +0.20 Rev % Growth -0.82% 6.50% - - 15.42% Yearly EPS $4.89 $5.01 +0.12 EPS $3.43 $3.87 $1.05 $4.73 $4.89 Factor Actual EPS Growth Est EPS Growth Change EPS % Growth -18.60% 12.93% -72.87% 350.48% 3.38% 3-5 year EPS 7.03% 9.28% +2.25 EPS Surprise EPS Quarterly Results Estimate Actual Difference % Difference FY Qtr 1 Qtr 2 Qtr 3 Qtr 4 Total Latest Qtr $1.09 $1.37 $0.28 25.69 12/09 $0.76 $1.58 $1.19 $1.19 $4.72 1 Qtr Ago $1.01 $1.15 $0.14 13.86 12/10 $1.02 $1.06 $1.13 $1.69 $4.90 2 Qtr Ago $1.06 $1.10 $0.04 3.77 12/11 $1.57 - - - - 3 Qtr Ago $1.01 $1.38 $0.37 36.63 Fiscal Year End Month is December. I want to receive special offers about trading stocks with your brokerage partner, optionsXpress. Click here www.chaikinpowertools.com
- 3. Price Trend & Expert Opinions Price/Volume Activity Price/Volume Activity Rating Relative Strength vs Market Very Bullish Chaikin Money Flow Price and volume activity for CI is very bullish. CI has outperformed the S&P 500 over 26 weeks and is experiencing sustained buying. Price Trend The rank for CI is based on its price strength versus the market, positive Chaikin Price Trend ROC money flow, a positive Chaikin price trend, a negative Chaikin price trend ROC and an increasing volume trend. Volume Trend Relative Strength vs S&P500 Index Chaikin Money Flow Chart shows whether CI is performing better or worse than the market. Chaikin Money Flow analyzes supply and demand for a company's stock. Price Activity Price Activity Volume Activity Factor Value Factor Value Factor Value 52 Week High 50.51 % Change Price - 4 Weeks 4.78% Average Volume 20 Days 2,619,961 52 Week Low 29.77 % Change Price - 24 Weeks 32.31% Average Volume 90 Days 2,475,262 % Change YTD Rel S&P 500 31.91% % Change Price - 4 Wks Rel to S&P 7.49% Chaikin Money Flow Persistency 92% % Change Price - 24 Wks Rel to S&P 31.23% Expert Opinions Expert Opinions Earnings Estimate Revisions Very Bullish Short Interest Expert opinions about CI are very positive. Analysts are raising their EPS estimates for CI and shorting of CI is low. Insider Activity The rank for CI is based on analysts revising earnings estimates upward, a low short interest ratio, insiders purchasing stock, optimistic analyst opinions and Analyst Opinions price strength of the stock versus the Insurance industry group. Relative Strength vs Industry Earnings Estimate Revisions Analyst Recommendations EPS Estimates Revision Summary Current 7 Days Ago % Change Factor Value Last Week Last 4 Weeks Current Qtr 1.26 1.26 0.00% Mean this Week Buy Up Down Up Down Next Qtr 1.21 1.21 0.00% Mean Last Week Buy Curr Qtr 1 0 1 0 Curr Yr 1 0 1 0 Current 30 Days Ago % Change Change 0.00 Next Qtr 0 0 0 0 Current FY 5.02 5.01 0.01 Mean 5 Weeks Ago Buy Next Yr 0 0 0 0 I want to receive special offers about trading stocks with your brokerage partner, optionsXpress. Click here www.chaikinpowertools.com
- 4. The Company & Its Competitors CI's Competitors in Insurance News Headlines for CI Company Power Historic EPS Projected EPS Profit Margin PEG PE Revenue(M) CIGNA Launches Dental HMO Product Suite for Gauge growth growth Public Sector and Taft-Hartley Groups - Jun 7, CI 7.03% 9.28% 6.95% 1.09 9.95 21,253 2011 MET 4.54% 9.00% 5.34% 0.89 8.87 52,717 Insurer Cigna's 1Q profit soars 52 percent - May 5, 2011 PUK -4.81% 9.00% - 1.32 - 73,661 CIGNA Launches Enhanced International AIG 214.74% 10.00% 8.64% 0.74 - 66,767 Employee Assistance Program - Apr 21, 2011 CIGNA Expands Global Presence to Singapore; Introduces Premier Group Health Care Product - Mar 31, 2011 CIGNA Enters Global Individual Health Market; Launches CIGNA Global Health Options - Mar 30, 2011 Company Details Company Profile CIGNA CORP CIGNA Corporation is an investor-owned employee benefits organizations in the United ONE LIBERTY PLACE States. Its subsidiaries are major providers of health care products and services, group PHILADELPHIA, PA 19192 life, accident and disability insurance, retirement products and services and investment USA management. CIGNA conducts its business through the following operating divisions: Phone: 2157611000 Employee Health Care, Life and Disability Benefits; Employee Retirement Benefits and Fax: 215-7615515 Investment Services; International Life, Health and Employee Benefits; and Other Website: Operations. http://http://www.cigna.com Full Time Employees: 30,600 Sector: Finance Power Gauge Ratings are created using a relative ranking system that assigns a rank of 0 to 100 (100 being the highest) to each stock in the universe. Rank is calculated by evaluating each of the stocks factors and combining them into a single number using a weighting formula. A stock's rank ranges from 100-0, where 100 is the strongest, and a rank of 95 indicates the stock is better than 95% of the stocks in the universe. Chaikin Stock Research(CSR) is not registered as a securities broker dealer or investment advisor with either the U.S. Securities and Exchange Commission or with any state securities regulatory authority. CSR is not responsible for trades executed by users of this research report, our web site or mobile app based on the information included herein. The information presented in this report does not represent a recommendation to buy or sell stocks or any financial instrument nor is it intended as an endorsement of any security or investment. The information in this report is generic by nature and is not personalized to the specific financial situation of any individual. The user bears complete responsibility for their own investment research and should seek the advice of a qualified investment professional before making any investment decisions. Copyright (c) 1978-(Present) by ZACKS Investment Research, Inc ("ZACKS"). The information, data, analyses and opinions contained herein (1) includes the confidential and proprietary information of ZACKS, (2) may not be copied or redistributed, for any purpose, (3) does not constitute investment advice offered by ZACKS, (4) are provided solely for informational purposes, and (5) are not warranted or represented to be correct, complete, accurate or timely. ZACKS shall not be responsible for investment decisions, damages or other losses resulting from, or related to, use of this information, data, analyses or opinions. Past performance is no guarantee of future performance. ZACKS is not affiliated with Chaikin Power Tools. This report from Chaikin Power Tools is for informational purposes only and is not a recommendation to buy or sell securities. LM 2.3 DS 3.0 LS 2.1 Data Provided by ZACKS Investment Research, Inc., www.zacks.com Special offers to trade stocks from optionsXpress: www.chaikinpowertools.com