Stock Research Report for ACN as of 7/27/11 - Chaikin Power Tools
•
0 gefällt mir•146 views

To order a free Chaikin Power Gauge stock research report for ACN go to http://www.chaikinpowertools.com/reports

Empfohlen
Empfohlen
Weitere ähnliche Inhalte
Kürzlich hochgeladen
Kürzlich hochgeladen (20)
Empfohlen
Empfohlen (20)
Stock Research Report for ACN as of 7/27/11 - Chaikin Power Tools
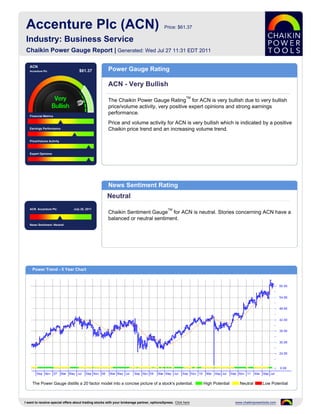
- 1. Accenture Plc (ACN) Price: $61.37 Industry: Business Service Chaikin Power Gauge Report | Generated: Wed Jul 27 11:31 EDT 2011 ACN Accenture Plc $61.37 Power Gauge Rating ACN - Very Bullish TM The Chaikin Power Gauge Rating for ACN is very bullish due to very bullish price/volume activity, very positive expert opinions and strong earnings performance. Financial Metrics Price and volume activity for ACN is very bullish which is indicated by a positive Earnings Performance Chaikin price trend and an increasing volume trend. Price/Volume Activity Expert Opinions News Sentiment Rating Neutral ACN Accenture Plc July 25, 2011 TM Chaikin Sentiment Gauge for ACN is neutral. Stories concerning ACN have a balanced or neutral sentiment. News Sentiment :Neutral Power Trend - 5 Year Chart The Power Gauge distills a 20 factor model into a concise picture of a stock's potential. High Potential Neutral Low Potential I want to receive special offers about trading stocks with your brokerage partner, optionsXpress. Click here www.chaikinpowertools.com
- 2. Financials & Earnings Financial Metrics Financial Metrics Rating LT Debt/Equity Ratio Neutral Price to Book Value ACN's financial metrics are neutral. The company does not hold much long term debt and may be overvalued. Return on Equity The rank is based on a low long term debt to equity ratio, high price to book value ratio and high return on equity. Price to Sales Ratio Business Value Assets and Liabilities Valuation Returns Ratio TTM Ratio TTM Ratio TTM Current Ratio 1.51 Price/Book 11.94 Return on Invest 57.0% LT Debt/Equity 0.00 Price/Sales 1.72 Return on Equity 57.0% Earnings Performance Earnings Performance Rating Earnings Growth Bullish Earnings Surprise ACN's earnings performance has been strong. The company has a stable 5 year earnings trend and has a history of strong earnings growth. Earnings Trend The rank is based on high earnings growth over the past 3-5 years and consistent earnings over the past 5 years. Projected P/E Ratio Earnings Consistency 5 Year Revenue and Earnings Growth EPS Estimates 08/06 08/07 08/08 08/09 08/10 Factor Actual EPS Prev EST EPS Current Change Revenue(M) 18,228.36 21,452.75 25,313.83 23,170.97 23,094.08 Quarterly EPS $0.70 $0.89 +0.19 Rev % Growth 6.63% 17.69% 18.00% -8.47% -0.33% Yearly EPS $2.79 $3.38 +0.59 EPS $1.65 $2.06 $2.77 $2.55 $2.79 Factor Actual EPS Growth Est EPS Growth Change EPS % Growth 3.12% 24.85% 34.47% -7.94% 9.41% 3-5 year EPS 6.70% 13.25% +6.55 EPS Surprise EPS Quarterly Results Estimate Actual Difference % Difference FY Qtr 1 Qtr 2 Qtr 3 Qtr 4 Total Latest Qtr $0.89 $0.93 $0.04 4.49 08/09 $0.77 $0.66 $0.71 $0.41 $2.55 1 Qtr Ago $0.71 $0.75 $0.04 5.63 08/10 $0.70 $0.63 $0.76 $0.70 $2.79 2 Qtr Ago $0.75 $0.81 $0.06 8.00 08/11 $0.84 $0.78 $0.96 - - 3 Qtr Ago $0.63 $0.66 $0.03 4.76 Fiscal Year End Month is August. I want to receive special offers about trading stocks with your brokerage partner, optionsXpress. Click here www.chaikinpowertools.com
- 3. Price Trend & Expert Opinions Price/Volume Activity Price/Volume Activity Rating Relative Strength vs Market Very Bullish Chaikin Money Flow Price and volume activity for ACN is very bullish. ACN has a rising price trend and is trading on higher volume than its 90 day average volume. Price Trend The rank for ACN is based on its price strength versus the market, positive Price Trend ROC Chaikin money flow, a positive Chaikin price trend, a negative Chaikin price trend ROC and an increasing volume trend. Volume Trend Relative Strength vs S&P500 Index Chaikin Money Flow Chart shows whether ACN is performing better or worse than the market. Chaikin Money Flow analyzes supply and demand for a company's stock. Price Activity Price Activity Volume Activity Factor Value Factor Value Factor Value 52 Week High 63.44 % Change Price - 4 Weeks 7.58% Average Volume 20 Days 13,779,789 52 Week Low 36.60 % Change Price - 24 Weeks 16.73% Average Volume 90 Days 6,163,280 % Change YTD Rel S&P 500 18.17% % Change Price - 4 Wks Rel to S&P 2.45% Chaikin Money Flow Persistency 63% % Change Price - 24 Wks Rel to S&P 14.88% Expert Opinions Expert Opinions Earnings Estimate Revisions Very Bullish Short Interest Expert opinions about ACN are very positive. Analysts are raising their EPS estimates for ACN and analysts's opinions on ACN have been more positive Insider Activity recently. The rank for ACN is based on analysts revising earnings estimates upward, a low Analyst Opinions short interest ratio, optimistic analyst opinions and price strength of the stock versus the Business Service industry group. Relative Strength vs Industry Earnings Estimate Revisions Analyst Recommendations EPS Estimates Revision Summary Current 7 Days Ago % Change Factor Value Last Week Last 4 Weeks Current Qtr 0.89 0.89 0.00% Mean this Week Buy Up Down Up Down Next Qtr 0.92 0.92 0.00% Mean Last Week Buy Curr Qtr 0 0 2 0 Curr Yr 0 0 2 0 Current 30 Days Ago % Change Change 0.00 Next Qtr 0 0 0 0 Current FY 3.38 3.37 0.01 Mean 5 Weeks Ago Strong Buy Next Yr 0 0 2 0 I want to receive special offers about trading stocks with your brokerage partner, optionsXpress. Click here www.chaikinpowertools.com
- 4. The Company & Its Competitors ACN's Competitors in Business Service News Headlines for ACN Company Power Historic EPS Projected EPS Profit Margin PEG PE Revenue(M) Accenture to buy stake in Al Faisaliah subsidiary Gauge growth growth - Jun 7, 2011 ACN 6.70% 13.25% 8.12% 1.37 19.47 23,094 Accenture To Strengthen Capabilities in Middle CBZ 5.61% 12.50% 3.61% 1.00 12.63 733 East Through Joint Venture with Al Faisaliah Group - Jun 7, 2011 FCN 22.03% 16.25% 5.63% 0.98 17.80 1,401 Crédit Agricole’s CEDICAM Subsidiary NCI 4.68% 13.50% 3.67% 1.14 17.55 704 Launched New Payment Processing Platform with Accenture’s Help - May 27, 2011 STN 23.80% 12.00% 7.33% 1.10 14.05 1,190 Accenture Unveils Enhanced Life Insurance TW 18.24% 12.00% 6.61% 1.14 17.69 - Software Platform - May 24, 2011 IT 5.82% 20.67% 8.02% 1.28 32.64 1,288 Analyst upgrades Accenture to 'Buy' from 'Hold' - Mar 18, 2011 CLGX -19.80% 8.50% -4.62% 1.79 13.24 1,623 Company Details Company Profile ACCENTURE PLC Accenture Plc is a management consulting, technology services and outsourcing 1 GRAND CANAL SQUARE organization. The Company's business is structured around five operating groups, GRAND CANAL HARBOUR namely, Communications & High Tech, Financial Services, Products, Public Service and DUBLIN, L2 D2 Resources. Combining unparalleled experience, comprehensive capabilities across all IRL industries and business functions, and extensive research on the world's most successful Phone: 353-1-646-2000 companies, Accenture collaborates with clients to help them become high-performance Fax: 353 1 646 2020 businesses and governments. Accenture Plc is headquartered in New York. Website: http://http://www.accenture.com/ Full Time Employees: 204,000 Sector: Business Services Power Gauge Ratings are created using a relative ranking system that assigns a rank of 0 to 100 (100 being the highest) to each stock in the universe. Rank is calculated by evaluating each of the stocks factors and combining them into a single number using a weighting formula. A stock's rank ranges from 100-0, where 100 is the strongest, and a rank of 95 indicates the stock is better than 95% of the stocks in the universe. Chaikin Stock Research(CSR) is not registered as a securities broker dealer or investment advisor with either the U.S. Securities and Exchange Commission or with any state securities regulatory authority. CSR is not responsible for trades executed by users of this research report, our web site or mobile app based on the information included herein. The information presented in this report does not represent a recommendation to buy or sell stocks or any financial instrument nor is it intended as an endorsement of any security or investment. The information in this report is generic by nature and is not personalized to the specific financial situation of any individual. The user bears complete responsibility for their own investment research and should seek the advice of a qualified investment professional before making any investment decisions. Copyright (c) 1978-(Present) by ZACKS Investment Research, Inc ("ZACKS"). The information, data, analyses and opinions contained herein (1) includes the confidential and proprietary information of ZACKS, (2) may not be copied or redistributed, for any purpose, (3) does not constitute investment advice offered by ZACKS, (4) are provided solely for informational purposes, and (5) are not warranted or represented to be correct, complete, accurate or timely. ZACKS shall not be responsible for investment decisions, damages or other losses resulting from, or related to, use of this information, data, analyses or opinions. Past performance is no guarantee of future performance. ZACKS is not affiliated with Chaikin Power Tools. This report from Chaikin Power Tools is for informational purposes only and is not a recommendation to buy or sell securities. LM 2.3 DS 3.0 LS 2.1 Data Provided by ZACKS Investment Research, Inc., www.zacks.com Special offers to trade stocks from optionsXpress: www.chaikinpowertools.com