Market Watch APRIL 2015
•
0 gefällt mir•294 views

- Record home sales were reported in the Greater Toronto Area (GTA) in April 2015, with 11,303 sales representing a 17% increase from April 2014. - The average home price in the GTA rose 10% year-over-year to $635,932 in April 2015. Price growth was strongest for low-rise homes but condominium prices also increased above the rate of inflation. - Demand continued to outpace new listings, and annual home price growth is expected to remain strong until listings grow at a faster pace than sales.

Empfohlen
Empfohlen
Weitere ähnliche Inhalte
Was ist angesagt?
Was ist angesagt? (18)
Ähnlich wie Market Watch APRIL 2015
Ähnlich wie Market Watch APRIL 2015 (20)
Mehr von Chaba Tamasi
Mehr von Chaba Tamasi (13)
Kürzlich hochgeladen
Kürzlich hochgeladen (20)
Market Watch APRIL 2015
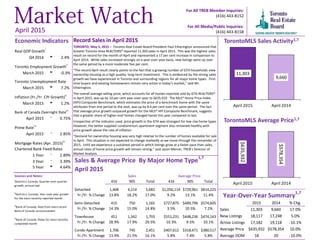
- 1. Record Sales in April 2015 TORONTO, May 5, 2015 – Toronto Real Estate Board President Paul Etherington announced that Greater Toronto Area REALTORS® reported 11,303 sales in April 2015. This was the highest sales result on record for the month of April and represented a 17 per cent increase in comparison to April 2014. While sales increased strongly on a year-over-year basis, new listings were up over the same period by a more moderate five per cent. “The record April result clearly points to the fact that a growing number of GTA households view ownership housing as a high quality, long-term investment. This is evidenced by the strong sales growth we have experienced in Toronto and surrounding regions for all major home types. First- time buyers and existing homeowners remain very active in today’s market,” said Mr. Etherington. The overall average selling price, which accounts for all homes reported sold by GTA REALTORS® in April 2015, was up by 10 per cent year-over-year to $635,932. The MLS® Home Price Index (HPI) Composite Benchmark, which estimates the price of a benchmark home with the same attributes from one period to the next, was up by 8.4 per cent over the same period. The fact that average price growth outpaced growth for the MLS® HPI Composite Benchmark, suggests that a greater share of higher-end homes changed hands this year compared to last. Irrespective of the indicator used, price growth in the GTA was strongest for low-rise home types. However, the better supplied condominium apartment segment also remained healthy with price growth above the rate of inflation. “Demand for ownership housing was very high relative to the number of homes available for sale in April. This situation is not expected to change markedly as we move through the remainder of 2015. Until we experience a sustained period in which listings grow at a faster pace than sales, annual rates of home price growth will remain strong,” said Jason Mercer, TREB’s Director of Market Analysis. 11,303 9,660 April 2015 April 2014 $635,932 $578,354 April 2015 April 2014 For All TREB Member Inquiries: (416) 443-8152 For All Media/Public Inquiries: (416) 443-8158April 2015 Real GDP Growthi Q4 2014 t 2.4% Toronto Employment Growthii March 2015 u -0.3% Toronto Unemployment Rate March 2015 u 7.2% Inflation (Yr./Yr. CPI Growth)ii March 2015 t 1.2% Bank of Canada Overnight Rateiii April 2015 q 0.75% Prime Rate iv April 2015 q 2.85% Mortgage Rates (Apr. 2015) iv Chartered Bank Fixed Rates 1 Year q 2.89% 3 Year q 3.39% 5 Year u 4.64% Sources and Notes: Economic Indicators i Statistics Canada, Quarter-over-quarter growth, annualized ii Statistics Canada, Year-over-year growth for the most recently reported month iii Bank of Canada, Rate from most recent Bank of Canada announcement iv Bank of Canada, Rates for most recently completed month Sales & Average Price By Major Home Type1,7 416 905 Total 416 905 Total Detached 1,468 4,214 5,682 $1,056,114 $729,961 $814,225 Yr./Yr. % Change 13.8% 18.2% 17.0% 9.2% 13.1% 11.4% Semi-Detached 415 750 1,165 $727,875 $489,796 $574,605 Yr./Yr. % Change 14.3% 15.0% 14.8% 3.5% 10.5% 7.2% Townhouse 451 1,342 1,793 $551,231 $448,236 $474,143 Yr./Yr. % Change 28.9% 17.9% 20.5% 10.3% 9.5% 10.1% Condo Apartment 1,706 745 2,451 $407,612 $318,471 $380,517 Yr./Yr. % Change 13.9% 21.5% 16.1% 5.8% 7.4% 5.8% April 2015 Sales Average Price 2015 2014 % Chg. Sales 11,303 9,660 17.0% New Listings 18,117 17,248 5.0% Active Listings 17,182 19,118 -10.1% Average Price $635,932 $578,354 10.0% Average DOM 18 20 -10.0% Year-Over-Year Summary 1,7 TorontoMLS Sales Activity1,7 TorontoMLS Average Price1,7
- 2. Price Range Detached Semi-Detached Att/Row/Twnhouse Condo Townhouse Condo Apt Link Co-op Apt Det Condo Co-ownership Apt Total $0 to $99,999 0 0 1 1 4 0 0 0 0 6 $100,000 to $199,999 18 1 2 38 138 0 4 0 1 202 $200,000 to $299,999 115 46 41 153 760 11 2 0 3 1,131 $300,000 to $399,999 417 101 160 266 791 54 2 5 1 1,797 $400,000 to $499,999 674 340 256 226 375 21 1 4 0 1,897 $500,000 to $599,999 855 272 191 96 185 18 3 0 1 1,621 $600,000 to $699,999 872 181 146 34 87 33 1 1 0 1,355 $700,000 to $799,999 671 101 81 28 41 28 0 1 0 951 $800,000 to $899,999 522 53 24 5 17 13 0 0 0 634 $900,000 to $999,999 365 29 15 11 11 3 0 0 0 434 $1,000,000 to $1,249,999 473 26 9 3 17 1 0 0 0 529 $1,250,000 to $1,499,999 288 7 2 0 13 0 0 0 0 310 $1,500,000 to $1,749,999 145 1 1 1 4 0 0 0 0 152 $1,750,000 to $1,999,999 84 3 0 0 2 0 0 0 0 89 $2,000,000 + 183 4 1 1 6 0 0 0 0 195 Total Sales 5,682 1,165 930 863 2,451 182 13 11 6 11,303 Share of Total Sales 50.3% 10.3% 8.2% 7.6% 21.7% 1.6% 0.1% 0.1% 0.1% - Average Price $814,225 $574,605 $531,602 $412,222 $380,517 $538,782 $355,654 $439,545 $298,467 $635,932 Price Range Detached Semi-Detached Att/Row/Twnhouse Condo Townhouse Condo Apt Link Co-op Apt Det Condo Co-ownership Apt Total $0 to $99,999 4 0 1 5 31 0 1 0 1 43 $100,000 to $199,999 68 6 3 122 547 0 12 0 2 760 $200,000 to $299,999 379 135 127 449 2,345 30 3 1 9 3,478 $300,000 to $399,999 1,211 352 494 726 2,361 133 3 8 7 5,295 $400,000 to $499,999 2,002 875 738 553 1,078 61 3 7 0 5,317 $500,000 to $599,999 2,351 700 493 210 485 63 9 2 1 4,314 $600,000 to $699,999 2,272 412 347 80 217 80 3 4 0 3,415 $700,000 to $799,999 1,724 222 186 55 123 68 0 2 0 2,380 $800,000 to $899,999 1,362 135 55 19 44 25 1 0 0 1,641 $900,000 to $999,999 889 60 35 16 36 4 0 1 0 1,041 $1,000,000 to $1,249,999 1,153 57 26 12 53 1 0 0 0 1,302 $1,250,000 to $1,499,999 711 23 9 2 29 0 0 1 0 775 $1,500,000 to $1,749,999 354 6 1 2 13 0 0 0 0 376 $1,750,000 to $1,999,999 231 7 1 0 5 0 1 0 0 245 $2,000,000 + 440 7 5 1 19 0 0 0 0 472 Total Sales 15,151 2,997 2,521 2,252 7,386 465 36 26 20 30,854 Share of Total Sales 49.1% 9.7% 8.2% 7.3% 23.9% 1.5% 0.1% 0.1% 0.1% - Average Price $787,317 $558,834 $520,444 $397,310 $369,508 $526,836 $406,000 $517,423 $273,420 $609,903 SALES BY PRICE RANGE AND HOUSE TYPE1,7 APRIL 2015 SALES BY PRICE RANGE AND HOUSE TYPE1,7 YEAR-TO-DATE, 2015 Market Watch, April 2015 2 Toronto Real Estate Board
- 3. ALL HOME TYPES, APRIL 2015 ALL TREB AREAS Number of Sales Dollar Volume 1 Average Price 1 Median Price 1 New Listings 2 SNLR (Trend) 8 Active Listings 3 Mos. Inv. (Trend)9 Avg. SP/LP 4 Avg. DOM 5 TREB Total 11,303 $7,187,935,831 $635,932 $539,000 18,117 60.9% 17,182 2.1 101% 18 Halton Region 972 $654,845,346 $673,709 $588,250 1,474 65.1% 1,524 2.0 99% 20 Burlington 222 $139,586,987 $628,770 $565,000 298 68.9% 329 2.1 98% 23 Halton Hills 118 $66,045,360 $559,706 $524,000 168 65.8% 188 2.2 99% 26 Milton 269 $145,189,460 $539,738 $500,000 386 69.1% 315 1.5 99% 14 Oakville 363 $304,023,539 $837,530 $725,000 622 60.3% 692 2.4 98% 20 Peel Region 2,337 $1,246,419,655 $533,342 $487,000 3,742 60.8% 3,261 2.0 99% 17 Brampton 1,030 $497,786,694 $483,288 $461,500 1,568 63.6% 1,141 1.6 99% 16 Caledon 117 $76,601,836 $654,717 $590,000 212 56.8% 265 3.2 97% 25 Mississauga 1,190 $672,031,125 $564,732 $511,500 1,962 58.9% 1,855 2.1 100% 18 City of Toronto 4,071 $2,810,051,927 $690,261 $550,000 7,175 56.9% 7,466 2.3 102% 19 York Region 2,211 $1,725,768,288 $780,537 $700,500 3,378 61.3% 2,989 2.0 101% 16 Aurora 116 $92,104,519 $794,004 $702,750 181 64.7% 161 1.9 100% 15 E. Gwillimbury 37 $22,688,678 $613,208 $535,000 70 62.1% 70 2.5 98% 16 Georgina 99 $38,762,100 $391,536 $395,000 152 67.3% 181 2.1 98% 23 King 35 $32,150,698 $918,591 $882,000 86 42.0% 191 6.1 97% 33 Markham 633 $500,807,732 $791,165 $743,000 951 62.2% 744 1.7 105% 14 Newmarket 186 $110,882,340 $596,142 $566,500 285 73.0% 187 1.2 101% 15 Richmond Hill 440 $406,770,760 $924,479 $828,000 721 58.2% 583 2.1 101% 17 Vaughan 548 $432,166,528 $788,625 $708,995 777 59.1% 712 2.2 99% 17 Whitchurch-Stouffville 117 $89,434,934 $764,401 $675,000 155 65.7% 160 2.3 99% 19 Durham Region 1,315 $578,798,607 $440,151 $417,000 1,816 72.1% 1,273 1.4 101% 15 Ajax 265 $130,225,863 $491,418 $468,800 340 77.9% 168 0.9 102% 11 Brock 25 $8,019,185 $320,767 $290,000 59 54.1% 98 4.7 97% 23 Clarington 215 $84,860,982 $394,702 $360,000 273 70.8% 204 1.5 100% 17 Oshawa 323 $112,696,388 $348,905 $328,500 434 74.3% 248 1.1 101% 13 Pickering 169 $87,351,389 $516,872 $485,000 238 70.7% 163 1.3 101% 14 Scugog 36 $18,238,850 $506,635 $484,900 83 55.7% 107 3.5 98% 26 Uxbridge 40 $23,938,088 $598,452 $515,000 65 58.2% 92 3.6 97% 36 Whitby 242 $113,467,863 $468,875 $445,000 324 75.2% 193 1.1 101% 14 Dufferin County 76 $29,838,000 $392,605 $361,750 79 71.9% 88 2.4 98% 25 Orangeville 76 $29,838,000 $392,605 $361,750 79 71.9% 88 2.4 98% 25 Simcoe County 321 $142,214,008 $443,034 $395,500 453 62.9% 581 3.0 98% 31 Adjala-Tosorontio 19 $9,618,600 $506,242 $499,000 29 54.8% 67 4.9 96% 60 Bradford West Gwillimbury 87 $47,151,200 $541,968 $528,000 115 64.9% 121 2.3 98% 24 Essa 69 $26,423,673 $382,952 $324,950 85 67.0% 93 2.7 99% 25 Innisfil 68 $29,507,635 $433,936 $394,750 115 55.5% 171 3.7 97% 31 New Tecumseth 78 $29,512,900 $378,371 $354,250 109 70.3% 129 2.6 98% 35 SUMMARY OF EXISTING HOME TRANSACTIONS ! TURN PAGE FOR CITY OF TORONTO TABLES OR CLICK HERE: Market Watch, April 2015 3 Toronto Real Estate Board
- 4. Market Watch, April 2015 July 2010Page 3 4 Toronto Real Estate Board ALL HOME TYPES, APRIL 2015 CITY OF TORONTO MUNICIPAL BREAKDOWN Number of Sales Dollar Volume 1 Average Price 1 Median Price 1 New Listings 2 SNLR (Trend) 8 Active Listings 3 Mos. Inv. (Trend)9 Avg. SP/LP 4 Avg. DOM 5 TREB Total 11,303 $7,187,935,831 $635,932 $539,000 18,117 60.9% 17,182 2.1 101% 18 City of Toronto Total 4,071 $2,810,051,927 $690,261 $550,000 7,175 56.9% 7,466 2.3 102% 19 Toronto West 1,067 $649,965,973 $609,153 $531,500 1,830 57.8% 1,933 2.3 102% 19 Toronto W01 67 $53,507,637 $798,621 $748,510 144 50.0% 143 2.6 104% 14 Toronto W02 108 $79,524,185 $736,335 $704,000 167 69.2% 124 1.3 108% 12 Toronto W03 81 $43,313,237 $534,731 $540,000 121 62.0% 84 1.6 103% 14 Toronto W04 93 $42,893,556 $461,221 $472,000 153 62.3% 144 2.0 102% 18 Toronto W05 135 $59,613,068 $441,578 $475,000 223 61.7% 259 2.3 99% 23 Toronto W06 157 $86,602,330 $551,607 $509,000 318 46.5% 439 3.5 101% 23 Toronto W07 41 $38,407,335 $936,764 $885,000 76 67.2% 52 1.4 104% 14 Toronto W08 230 $175,409,096 $762,648 $634,500 380 55.7% 454 2.6 100% 21 Toronto W09 49 $31,733,288 $647,618 $679,900 93 65.6% 86 1.9 104% 15 Toronto W10 106 $38,962,241 $367,568 $399,500 155 60.5% 148 2.2 100% 23 Toronto Central 1,887 $1,499,585,658 $794,693 $535,000 3,726 51.2% 4,423 2.8 101% 22 Toronto C01 527 $273,441,924 $518,865 $420,000 1,090 45.9% 1,527 3.5 100% 25 Toronto C02 79 $99,965,250 $1,265,383 $1,041,000 203 49.0% 248 3.4 102% 23 Toronto C03 65 $79,334,310 $1,220,528 $780,000 109 54.7% 122 2.3 101% 26 Toronto C04 113 $183,275,640 $1,621,908 $1,458,888 216 57.3% 180 2.0 102% 15 Toronto C06 45 $33,568,482 $745,966 $821,000 78 53.5% 85 2.9 103% 21 Toronto C07 154 $118,052,188 $766,573 $538,500 290 53.4% 297 2.7 102% 24 Toronto C08 204 $104,366,028 $511,598 $428,000 355 53.5% 424 2.5 100% 23 Toronto C09 31 $53,486,271 $1,725,364 $1,700,000 82 54.5% 88 2.8 100% 17 Toronto C10 76 $62,953,303 $828,333 $737,500 123 60.4% 112 2.0 103% 17 Toronto C11 60 $39,922,587 $665,376 $400,950 89 73.2% 66 1.3 103% 17 Toronto C12 48 $105,658,000 $2,201,208 $1,940,000 105 49.2% 152 3.8 100% 19 Toronto C13 97 $76,753,618 $791,274 $675,000 170 65.0% 142 1.5 104% 17 Toronto C14 213 $147,824,639 $694,012 $458,800 425 47.4% 558 3.2 100% 26 Toronto C15 175 $120,983,418 $691,334 $546,000 391 51.5% 422 2.6 103% 18 Toronto East 1,117 $660,500,296 $591,316 $578,300 1,619 68.2% 1,110 1.3 105% 14 Toronto E01 106 $79,787,321 $752,711 $701,000 141 69.6% 80 1.0 109% 10 Toronto E02 83 $74,489,666 $897,466 $782,000 139 67.4% 90 1.2 107% 9 Toronto E03 118 $87,704,193 $743,256 $701,500 159 72.0% 80 0.9 108% 9 Toronto E04 145 $71,336,141 $491,973 $540,000 209 69.9% 129 1.3 104% 14 Toronto E05 125 $70,066,666 $560,533 $546,800 173 72.2% 108 1.1 106% 14 Toronto E06 49 $36,832,700 $751,688 $600,000 76 57.8% 54 1.5 101% 13 Toronto E07 107 $50,173,629 $468,912 $325,000 155 64.8% 132 1.7 104% 23 Toronto E08 82 $45,963,200 $560,527 $540,500 108 67.2% 80 1.6 100% 16 Toronto E09 130 $58,451,086 $449,624 $490,893 210 66.5% 186 1.6 104% 17 Toronto E10 81 $47,134,168 $581,903 $575,000 117 65.5% 77 1.5 102% 13 Toronto E11 91 $38,561,526 $423,753 $411,500 132 72.3% 94 1.3 104% 15 SUMMARY OF EXISTING HOME TRANSACTIONS
- 5. ALL HOME TYPES, YEAR-TO-DATE 2015 ALL TREB AREAS Number of Sales Dollar Volume 1 Average Price 1 Median Price 1 New Listings 2 Avg. SP/LP 4 Avg. DOM 5 TREB Total 30,854 $18,817,946,661 $609,903 $513,000 53,536 100% 21 Halton Region 2,702 $1,785,050,288 $660,640 $571,000 4,468 98% 23 Burlington 641 $379,762,827 $592,454 $540,000 954 98% 28 Halton Hills 310 $169,923,155 $548,139 $497,250 509 98% 29 Milton 735 $388,296,065 $528,294 $498,500 1,144 99% 17 Oakville 1,016 $847,068,241 $833,729 $725,000 1,861 98% 23 Peel Region 6,269 $3,234,053,871 $515,880 $471,800 10,683 99% 21 Brampton 2,837 $1,339,571,873 $472,179 $450,000 4,487 99% 18 Caledon 290 $183,568,131 $632,994 $575,000 598 97% 28 Mississauga 3,142 $1,710,913,867 $544,530 $495,000 5,598 99% 22 City of Toronto 11,161 $7,289,577,415 $653,129 $513,000 21,359 102% 23 York Region 6,013 $4,502,845,724 $748,852 $680,000 10,002 101% 20 Aurora 337 $243,646,379 $722,986 $635,000 539 100% 19 E. Gwillimbury 106 $65,044,862 $613,631 $537,500 184 97% 28 Georgina 280 $107,175,280 $382,769 $371,000 474 98% 26 King 113 $102,290,879 $905,229 $805,000 286 96% 43 Markham 1,585 $1,232,071,362 $777,332 $722,000 2,704 103% 17 Newmarket 559 $329,065,791 $588,669 $567,500 795 100% 17 Richmond Hill 1,226 $1,047,953,013 $854,774 $763,000 2,046 101% 19 Vaughan 1,510 $1,154,375,501 $764,487 $700,000 2,483 99% 20 Whitchurch-Stouffville 297 $221,222,658 $744,857 $656,000 491 99% 24 Durham Region 3,629 $1,554,509,536 $428,358 $400,000 5,297 100% 17 Ajax 678 $324,987,041 $479,332 $450,000 935 101% 13 Brock 64 $20,393,085 $318,642 $273,250 150 96% 42 Clarington 624 $238,630,868 $382,421 $357,000 890 100% 19 Oshawa 912 $310,221,055 $340,155 $327,500 1,269 101% 15 Pickering 442 $225,680,840 $510,590 $479,450 659 101% 17 Scugog 96 $45,212,268 $470,961 $426,000 211 98% 34 Uxbridge 96 $52,442,288 $546,274 $477,500 193 98% 36 Whitby 717 $336,942,092 $469,933 $442,000 990 101% 14 Dufferin County 236 $89,700,849 $380,088 $354,900 300 98% 31 Orangeville 236 $89,700,849 $380,088 $354,900 300 98% 31 Simcoe County 844 $362,208,979 $429,158 $400,000 1,427 98% 33 Adjala-Tosorontio 63 $28,038,900 $445,062 $425,000 116 97% 61 Bradford West Gwillimbury 257 $133,971,268 $521,289 $515,000 405 98% 26 Essa 120 $44,323,123 $369,359 $322,740 209 99% 29 Innisfil 186 $73,786,623 $396,702 $366,500 359 98% 35 New Tecumseth 218 $82,089,065 $376,555 $358,500 338 98% 34 ! TURN PAGE FOR CITY OF TORONTO TABLES OR CLICK HERE: SUMMARY OF EXISTING HOME TRANSACTIONS Market Watch, April 2015 July 2010Page 3 5 Toronto Real Estate Board
- 6. Market Watch, April 2015 July 2010Page 3 6 Toronto Real Estate Board ALL HOME TYPES, YEAR-TO-DATE 2015 CITY OF TORONTO MUNICIPAL BREAKDOWN Number of Sales Dollar Volume 1 Average Price 1 Median Price 1 New Listings 2 Avg. SP/LP 4 Avg. DOM 5 TREB Total 30,854 $18,817,946,661 $609,903 $513,000 53,536 100% 21 City of Toronto Total 11,161 $7,289,577,415 $653,129 $513,000 21,359 102% 23 Toronto West 2,825 $1,585,424,356 $561,212 $498,500 5,380 101% 24 Toronto W01 189 $137,250,020 $726,191 $596,000 396 104% 22 Toronto W02 256 $178,068,362 $695,580 $665,556 419 106% 18 Toronto W03 224 $115,880,887 $517,325 $516,500 360 102% 18 Toronto W04 264 $125,666,465 $476,009 $475,000 457 101% 23 Toronto W05 363 $150,349,898 $414,187 $449,900 668 99% 27 Toronto W06 410 $212,398,011 $518,044 $482,750 1,011 101% 27 Toronto W07 88 $76,622,623 $870,712 $813,000 160 103% 19 Toronto W08 590 $399,200,413 $676,611 $502,250 1,200 100% 24 Toronto W09 149 $84,639,241 $568,049 $601,000 247 103% 20 Toronto W10 292 $105,348,436 $360,782 $343,250 462 99% 29 Toronto Central 5,302 $4,044,707,857 $762,865 $495,000 11,360 101% 25 Toronto C01 1,426 $694,750,871 $487,203 $406,000 3,520 99% 28 Toronto C02 261 $309,803,682 $1,186,987 $1,020,000 570 100% 33 Toronto C03 178 $192,101,629 $1,079,223 $790,500 340 102% 20 Toronto C04 324 $479,676,740 $1,480,484 $1,391,250 611 102% 18 Toronto C06 130 $96,523,138 $742,486 $795,500 229 101% 23 Toronto C07 426 $318,434,939 $747,500 $526,250 843 101% 25 Toronto C08 567 $275,474,302 $485,845 $420,000 1,180 99% 26 Toronto C09 112 $181,547,671 $1,620,961 $1,411,000 217 99% 22 Toronto C10 198 $159,269,608 $804,392 $666,000 336 103% 20 Toronto C11 148 $87,754,827 $592,938 $337,450 243 102% 19 Toronto C12 136 $277,353,670 $2,039,365 $1,662,450 315 98% 26 Toronto C13 258 $188,464,083 $730,481 $582,250 450 105% 18 Toronto C14 642 $451,534,445 $703,325 $443,000 1,418 100% 28 Toronto C15 496 $332,018,252 $669,392 $470,000 1,088 103% 23 Toronto East 3,034 $1,659,445,202 $546,950 $540,000 4,619 104% 17 Toronto E01 282 $205,578,969 $729,003 $705,500 421 108% 13 Toronto E02 218 $174,951,663 $802,531 $751,000 359 106% 11 Toronto E03 321 $221,507,911 $690,056 $655,000 450 106% 12 Toronto E04 384 $174,868,109 $455,386 $505,500 577 104% 16 Toronto E05 319 $163,913,388 $513,835 $445,000 455 105% 17 Toronto E06 128 $84,564,405 $660,659 $580,000 217 102% 15 Toronto E07 288 $131,366,737 $456,135 $322,000 453 103% 26 Toronto E08 220 $115,171,251 $523,506 $511,750 318 100% 21 Toronto E09 409 $168,358,536 $411,635 $365,000 664 103% 20 Toronto E10 213 $116,877,504 $548,721 $551,000 328 102% 19 Toronto E11 252 $102,286,730 $405,900 $409,750 377 103% 17 SUMMARY OF EXISTING HOME TRANSACTIONS
- 7. Market Watch, April 2015 Industrial Leasing July 2010Page 3 7 Toronto Real Estate Board ALL TREB AREAS Sales 1 Dollar Volume 1 Average Price 1 Median Price 1 New Listings 2 Active Listings 3 Avg. SP/LP 4 Avg. DOM 5 TREB Total 5,682 $4,626,428,424 $814,225 $685,000 8,846 7,519 101% 17- - - - - - - - Halton Region 583 $479,770,406 $822,934 $705,000 933 1,012 98% 21 Burlington 123 $99,758,688 $811,046 $680,000 170 188 98% 26 Halton Hills 98 $58,531,650 $597,262 $577,250 139 171 98% 26 Milton 133 $87,833,150 $660,400 $625,625 226 220 99% 16 Oakville 229 $233,646,918 $1,020,292 $890,000 398 433 98% 20- - - - - - - - Peel Region 1,114 $764,723,452 $686,466 $632,250 1,847 1,545 99% 17 Brampton 568 $321,757,544 $566,475 $545,150 927 693 99% 16 Caledon 90 $64,082,836 $712,032 $640,000 174 237 97% 28 Mississauga 456 $378,883,072 $830,884 $744,000 746 615 100% 15- - - - - - - - City of Toronto 1,468 $1,550,374,790 $1,056,114 $830,000 2,324 1,649 103% 13 - - - - - - - - York Region 1,304 $1,244,101,795 $954,066 $860,100 2,004 1,733 101% 15 Aurora 80 $73,114,765 $913,935 $785,500 116 100 100% 12 E. Gwillimbury 28 $19,050,578 $680,378 $615,750 63 69 98% 19 Georgina 83 $33,116,300 $398,992 $400,000 131 164 98% 25 King 27 $27,943,698 $1,034,952 $925,000 74 152 98% 25 Markham 297 $313,655,068 $1,056,078 $952,000 458 294 105% 11 Newmarket 124 $82,491,640 $665,255 $648,500 201 137 101% 17 Richmond Hill 268 $314,581,438 $1,173,811 $1,035,500 414 301 101% 15 Vaughan 305 $303,682,362 $995,680 $875,000 421 367 99% 15 Whitchurch-Stouffville 92 $76,465,946 $831,152 $702,500 126 149 98% 21- - - - - - - - Durham Region 899 $441,191,779 $490,758 $469,000 1,312 1,000 100% 16 Ajax 174 $95,511,509 $548,917 $541,000 231 118 101% 12 Brock 24 $7,786,685 $324,445 $306,000 55 93 97% 24 Clarington 146 $63,171,982 $432,685 $390,000 195 162 99% 19 Oshawa 221 $86,818,268 $392,843 $375,000 305 187 101% 14 Pickering 95 $60,364,935 $635,420 $595,000 143 106 100% 16 Scugog 35 $17,911,850 $511,767 $489,900 81 106 98% 27 Uxbridge 36 $22,484,088 $624,558 $547,500 58 79 97% 33 Whitby 168 $87,142,463 $518,705 $482,000 244 149 101% 13- - - - - - - - Dufferin County 56 $24,399,000 $435,696 $378,500 58 76 98% 29 Orangeville 56 $24,399,000 $435,696 $378,500 58 76 98% 29- - - - - - - - Simcoe County 258 $121,867,203 $472,353 $425,000 368 504 98% 32 Adjala-Tosorontio 19 $9,618,600 $506,242 $499,000 29 67 96% 60 Bradford West Gwillimbury 69 $40,231,400 $583,064 $560,000 90 103 98% 27 Essa 51 $21,333,573 $418,305 $345,000 67 84 99% 27 Innisfil 62 $27,772,130 $447,938 $415,750 107 163 97% 32 New Tecumseth 57 $22,911,500 $401,956 $374,900 75 87 98% 30 SUMMARY OF EXISTING HOME TRANSACTIONS DETACHED HOUSES, APRIL 2015 ! TURN PAGE FOR CITY OF TORONTO TABLES OR CLICK HERE:
- 8. Market Watch, April 2015 Industrial Leasing July 2010Page 3 8 Toronto Real Estate Board CITY OF TORONTO MUNICIPAL BREAKDOWN Sales1 Dollar Volume1 Average Price1 Median Price1 New Listings2 Active Listings3 Avg. SP/LP4 Avg. DOM5 TREB Total 5,682 $4,626,428,424 $814,225 $685,000 8,846 7,519 101% 17 City of Toronto Total 1,468 $1,550,374,790 $1,056,114 $830,000 2,324 1,649 103% 13 Toronto West 456 $393,646,312 $863,259 $710,000 763 617 103% 13 Toronto W01 20 $26,742,437 $1,337,122 $1,335,000 35 18 105% 10 Toronto W02 33 $35,770,583 $1,083,957 $1,050,000 58 38 109% 9 Toronto W03 41 $23,070,500 $562,695 $544,900 66 43 102% 13 Toronto W04 45 $26,961,056 $599,135 $565,000 93 79 103% 10 Toronto W05 42 $26,796,900 $638,021 $625,450 67 66 100% 16 Toronto W06 55 $40,939,904 $744,362 $650,000 72 51 104% 11 Toronto W07 34 $34,667,718 $1,019,639 $952,500 65 41 104% 12 Toronto W08 110 $130,883,186 $1,189,847 $980,000 181 185 101% 16 Toronto W09 32 $25,226,288 $788,322 $741,000 50 41 105% 12 Toronto W10 44 $22,587,740 $513,358 $513,000 76 55 101% 16 Toronto Central 475 $756,067,551 $1,591,721 $1,312,500 778 630 103% 15 Toronto C01 9 $10,209,751 $1,134,417 $1,050,000 19 12 118% 7 Toronto C02 20 $34,339,300 $1,716,965 $1,475,500 34 22 103% 9 Toronto C03 36 $60,091,860 $1,669,218 $1,034,500 51 48 100% 19 Toronto C04 96 $173,454,740 $1,806,820 $1,627,500 174 130 102% 14 Toronto C06 29 $28,063,206 $967,697 $880,000 40 25 104% 18 Toronto C07 61 $76,824,699 $1,259,421 $1,175,000 100 78 104% 18 Toronto C08 3 $3,630,018 $1,210,006 $1,325,000 4 3 102% 7 Toronto C09 18 $42,766,271 $2,375,904 $2,264,000 35 35 100% 17 Toronto C10 23 $30,991,500 $1,347,457 $1,250,000 28 13 105% 10 Toronto C11 16 $21,655,500 $1,353,469 $1,341,000 26 19 105% 8 Toronto C12 31 $90,924,000 $2,933,032 $2,460,000 62 92 101% 19 Toronto C13 44 $54,280,718 $1,233,653 $1,000,000 53 30 105% 11 Toronto C14 42 $67,994,500 $1,618,917 $1,475,000 78 71 103% 16 Toronto C15 47 $60,841,488 $1,294,500 $1,102,000 74 52 104% 13 Toronto East 537 $400,660,927 $746,110 $672,000 783 402 105% 11 Toronto E01 21 $21,031,514 $1,001,501 $849,900 28 15 109% 11 Toronto E02 40 $43,492,911 $1,087,323 $985,000 67 35 105% 9 Toronto E03 78 $63,838,443 $818,442 $731,000 107 44 108% 8 Toronto E04 81 $48,572,641 $599,662 $610,000 107 48 106% 10 Toronto E05 45 $36,563,966 $812,533 $810,000 67 31 106% 10 Toronto E06 42 $32,917,400 $783,748 $625,000 64 40 101% 14 Toronto E07 30 $23,171,288 $772,376 $764,000 47 20 108% 9 Toronto E08 47 $35,747,700 $760,589 $650,000 67 48 100% 13 Toronto E09 66 $39,054,986 $591,742 $577,650 97 45 106% 11 Toronto E10 58 $37,717,478 $650,301 $644,250 82 47 102% 13 Toronto E11 29 $18,552,600 $639,745 $635,000 50 29 107% 8 DETACHED HOUSES, APRIL 2015 SUMMARY OF EXISTING HOME TRANSACTIONS
- 9. Industrial Leasing Toronto Real Estate Board ALL TREB AREAS Sales 1 Dollar Volume 1 Average Price 1 Median Price 1 New Listings 2 Active Listings 3 Avg. SP/LP 4 Avg. DOM 5 TREB Total 1,165 $669,415,288 $574,605 $530,000 1,628 884 104% 11- - - - - - - - Halton Region 56 $28,845,890 $515,105 $499,500 78 61 99% 13 Burlington 9 $4,694,400 $521,600 $523,000 17 17 99% 12 Halton Hills 1 $456,000 $456,000 $456,000 1 - 102% 6 Milton 34 $16,380,900 $481,791 $484,250 39 24 100% 12 Oakville 12 $7,314,590 $609,549 $610,495 21 20 98% 15- - - - - - - - Peel Region 420 $200,442,932 $477,245 $469,950 600 337 100% 12 Brampton 220 $96,156,361 $437,074 $434,500 305 174 100% 12 Caledon 14 $6,510,000 $465,000 $457,000 15 8 99% 10 Mississauga 186 $97,776,571 $525,680 $522,500 280 155 101% 11- - - - - - - - City of Toronto 415 $302,068,129 $727,875 $678,000 574 313 107% 10 - - - - - - - - York Region 164 $100,375,206 $612,044 $615,000 226 108 104% 10 Aurora 7 $3,810,854 $544,408 $543,800 11 8 99% 16 E. Gwillimbury 2 $1,055,000 $527,500 $527,500 2 1 97% 2 Georgina 3 $1,319,000 $439,667 $404,000 6 4 100% 6 King - - - - - - - - Markham 48 $31,791,339 $662,320 $640,000 76 34 107% 8 Newmarket 23 $11,164,400 $485,409 $495,000 35 16 102% 8 Richmond Hill 23 $14,887,925 $647,301 $607,000 25 11 104% 11 Vaughan 52 $33,162,188 $637,734 $637,500 62 31 102% 12 Whitchurch-Stouffville 6 $3,184,500 $530,750 $529,500 9 3 103% 5- - - - - - - - Durham Region 91 $31,615,631 $347,425 $345,000 125 52 104% 7 Ajax 28 $11,828,317 $422,440 $427,500 33 9 105% 5 Brock - - - - - - - - Clarington 3 $900,000 $300,000 $310,000 5 3 101% 15 Oshawa 38 $9,949,214 $261,821 $269,450 58 27 103% 9 Pickering 14 $5,898,100 $421,293 $441,500 17 5 105% 6 Scugog - - - - - - - - Uxbridge - - - - - 1 - - Whitby 8 $3,040,000 $380,000 $375,500 12 7 102% 8- - - - - - - - Dufferin County 10 $2,765,500 $276,550 $274,750 12 5 98% 13 Orangeville 10 $2,765,500 $276,550 $274,750 12 5 98% 13- - - - - - - - Simcoe County 9 $3,302,000 $366,889 $368,000 13 8 99% 12 Adjala-Tosorontio - - - - - - - - Bradford West Gwillimbury 6 $2,415,000 $402,500 $415,750 10 4 99% 12 Essa 2 $586,000 $293,000 $293,000 2 - 99% 15 Innisfil - - - - - - - - New Tecumseth 1 $301,000 $301,000 $301,000 1 4 101% 6 ! TURN PAGE FOR CITY OF TORONTO TABLES OR CLICK HERE: SUMMARY OF EXISTING HOME TRANSACTIONS SEMI-DETACHED HOUSES, APRIL 2015 July 2010Page 3 Market Watch, April 2015 9
- 10. Industrial Leasing July 2010Page 3 Toronto Real Estate Board Market Watch, April 2015 CITY OF TORONTO MUNICIPAL BREAKDOWN Sales1 Dollar Volume1 Average Price1 Median Price1 New Listings2 Active Listings3 Avg. SP/LP4 Avg. DOM5 TREB Total 1,165 $669,415,288 $574,605 $530,000 1,628 884 104% 11 City of Toronto Total 415 $302,068,129 $727,875 $678,000 574 313 107% 10 Toronto West 144 $87,891,510 $610,358 $561,000 196 123 106% 12 Toronto W01 14 $11,949,910 $853,565 $800,000 15 8 109% 10 Toronto W02 33 $25,068,569 $759,654 $755,000 46 23 112% 9 Toronto W03 31 $17,410,812 $561,639 $565,000 40 23 105% 11 Toronto W04 12 $6,011,000 $500,917 $517,000 9 8 100% 18 Toronto W05 36 $18,224,400 $506,233 $499,200 63 47 100% 14 Toronto W06 4 $2,258,000 $564,500 $587,000 5 2 109% 9 Toronto W07 - - - - - - - - Toronto W08 4 $2,296,818 $574,205 $552,500 4 3 103% 16 Toronto W09 1 $529,000 $529,000 $529,000 1 1 100% 7 Toronto W10 9 $4,143,001 $460,333 $475,000 13 8 101% 16 Toronto Central 121 $108,749,648 $898,757 $795,000 182 108 106% 10 Toronto C01 26 $24,730,806 $951,185 $877,500 40 21 106% 13 Toronto C02 14 $17,141,000 $1,224,357 $931,500 26 22 107% 7 Toronto C03 11 $9,347,500 $849,773 $650,000 17 10 107% 19 Toronto C04 4 $3,806,000 $951,500 $1,000,500 9 4 113% 4 Toronto C06 - - - - - - - - Toronto C07 6 $3,768,300 $628,050 $636,250 7 3 101% 8 Toronto C08 6 $6,473,000 $1,078,833 $1,084,000 9 6 105% 6 Toronto C09 2 $4,120,000 $2,060,000 $2,060,000 4 7 102% 7 Toronto C10 9 $7,840,475 $871,164 $840,000 11 5 109% 10 Toronto C11 8 $7,336,887 $917,111 $845,000 6 1 108% 9 Toronto C12 1 $680,000 $680,000 $680,000 1 2 97% 18 Toronto C13 8 $5,216,000 $652,000 $636,500 21 12 106% 7 Toronto C14 - - - - - - - - Toronto C15 26 $18,289,680 $703,449 $685,000 31 15 107% 9 Toronto East 150 $105,426,971 $702,846 $681,000 196 82 109% 8 Toronto E01 47 $35,909,427 $764,030 $726,429 58 22 111% 8 Toronto E02 30 $24,274,025 $809,134 $755,000 39 16 110% 6 Toronto E03 27 $20,417,500 $756,204 $690,000 31 13 110% 8 Toronto E04 9 $4,684,000 $520,444 $485,000 17 8 106% 7 Toronto E05 7 $4,576,000 $653,714 $658,000 13 7 115% 8 Toronto E06 3 $1,869,900 $623,300 $600,000 6 2 100% 9 Toronto E07 8 $4,850,133 $606,267 $595,400 8 3 105% 13 Toronto E08 1 $395,000 $395,000 $395,000 2 1 99% 2 Toronto E09 4 $1,920,000 $480,000 $482,000 1 - 109% 8 Toronto E10 4 $2,005,900 $501,475 $510,000 6 3 101% 12 Toronto E11 10 $4,525,086 $452,509 $425,650 15 7 103% 15 SUMMARY OF EXISTING HOME TRANSACTIONS SEMI-DETACHED HOUSES, APRIL 2015 10
- 11. Industrial Leasing July 2010Page 3 Toronto Real Estate Board Market Watch, April 2015 ALL TREB AREAS Sales 1 Dollar Volume 1 Average Price 1 Median Price 1 New Listings 2 Active Listings 3 Avg. SP/LP 4 Avg. DOM 5 TREB Total 863 $355,747,323 $412,222 $392,000 1,214 1,036 101% 18- - - - - - - - Halton Region 82 $31,033,124 $378,453 $342,000 113 103 99% 19 Burlington 32 $13,021,900 $406,934 $351,500 44 38 99% 21 Halton Hills 5 $1,268,400 $253,680 $228,500 7 6 100% 24 Milton 20 $6,855,334 $342,767 $322,625 15 4 100% 13 Oakville 25 $9,887,490 $395,500 $372,000 47 55 100% 22- - - - - - - - Peel Region 295 $110,574,951 $374,830 $372,000 396 331 100% 18 Brampton 83 $25,290,545 $304,705 $290,000 110 87 99% 21 Caledon - - - - 1 2 - - Mississauga 212 $85,284,406 $402,285 $398,000 285 242 100% 17- - - - - - - - City of Toronto 295 $137,286,913 $465,379 $430,000 459 428 102% 19 - - - - - - - - York Region 107 $53,483,534 $499,846 $465,900 145 102 101% 16 Aurora 7 $3,908,500 $558,357 $442,500 14 18 98% 31 E. Gwillimbury - - - - - - - - Georgina - - - - 3 3 - - King - - - - - - - - Markham 51 $25,790,296 $505,692 $465,900 63 38 103% 11 Newmarket 13 $5,588,700 $429,900 $391,000 16 9 101% 14 Richmond Hill 17 $8,298,538 $488,149 $484,900 23 16 101% 17 Vaughan 19 $9,897,500 $520,921 $490,000 26 18 98% 27 Whitchurch-Stouffville - - - - - - - -- - - - - - - - Durham Region 79 $22,106,801 $279,833 $291,500 96 67 101% 18 Ajax 16 $5,409,400 $338,088 $331,000 19 12 102% 23 Brock - - - - 2 4 - - Clarington 2 $815,000 $407,500 $407,500 7 11 97% 26 Oshawa 25 $4,937,301 $197,492 $190,000 24 11 101% 16 Pickering 24 $7,596,700 $316,529 $306,000 28 16 101% 17 Scugog - - - - - - - - Uxbridge 1 $404,000 $404,000 $404,000 3 4 100% 70 Whitby 11 $2,944,400 $267,673 $284,900 13 9 100% 13- - - - - - - - Dufferin County 2 $390,000 $195,000 $195,000 2 2 98% 17 Orangeville 2 $390,000 $195,000 $195,000 2 2 98% 17- - - - - - - - Simcoe County 3 $872,000 $290,667 $295,000 3 3 99% 31 Adjala-Tosorontio - - - - - - - - Bradford West Gwillimbury 1 $295,000 $295,000 $295,000 1 1 97% 43 Essa - - - - - - - - Innisfil - - - - - - - - New Tecumseth 2 $577,000 $288,500 $288,500 2 2 100% 25 ! TURN PAGE FOR CITY OF TORONTO TABLES OR CLICK HERE: SUMMARY OF EXISTING HOME TRANSACTIONS CONDOMINIUM TOWNHOUSES, APRIL 2015 11
- 12. Industrial Leasing July 2010Page 3 Toronto Real Estate Board Market Watch, April 2015 12 CITY OF TORONTO MUNICIPAL BREAKDOWN Sales1 Dollar Volume1 Average Price1 Median Price1 New Listings2 Active Listings3 Avg. SP/LP4 Avg. DOM5 TREB Total 863 $355,747,323 $412,222 $392,000 1,214 1,036 101% 18 City of Toronto Total 295 $137,286,913 $465,379 $430,000 459 428 102% 19 Toronto West 78 $29,972,163 $384,259 $348,450 115 116 99% 24 Toronto W01 8 $3,681,500 $460,188 $428,500 7 6 99% 17 Toronto W02 14 $6,849,355 $489,240 $479,500 14 8 102% 15 Toronto W03 - - - - 1 1 - - Toronto W04 7 $2,303,000 $329,000 $307,500 8 8 99% 42 Toronto W05 20 $4,906,480 $245,324 $240,500 35 48 97% 34 Toronto W06 5 $3,021,325 $604,265 $645,700 12 13 97% 21 Toronto W07 - - - - - - - - Toronto W08 7 $3,067,103 $438,158 $438,000 12 10 99% 17 Toronto W09 6 $3,122,900 $520,483 $519,000 11 9 100% 24 Toronto W10 11 $3,020,500 $274,591 $300,000 15 13 98% 18 Toronto Central 118 $67,792,200 $574,510 $518,500 201 193 102% 17 Toronto C01 33 $19,293,200 $584,642 $570,000 55 57 103% 20 Toronto C02 2 $2,813,000 $1,406,500 $1,406,500 6 7 110% 14 Toronto C03 - - - - - 4 - - Toronto C04 - - - - 4 4 - - Toronto C06 1 $465,000 $465,000 $465,000 1 3 98% 27 Toronto C07 11 $5,313,450 $483,041 $467,000 13 12 101% 23 Toronto C08 8 $4,466,100 $558,263 $438,900 14 13 101% 13 Toronto C09 1 $720,000 $720,000 $720,000 1 1 100% 0 Toronto C10 1 $950,000 $950,000 $950,000 5 6 111% 4 Toronto C11 4 $1,228,900 $307,225 $209,000 5 3 106% 8 Toronto C12 7 $6,719,900 $959,986 $753,000 15 16 97% 17 Toronto C13 4 $1,802,000 $450,500 $423,550 5 5 103% 18 Toronto C14 18 $10,857,850 $603,214 $550,000 25 31 99% 19 Toronto C15 28 $13,162,800 $470,100 $464,250 52 31 106% 11 Toronto East 99 $39,522,550 $399,218 $415,000 143 119 103% 17 Toronto E01 9 $4,430,800 $492,311 $465,000 12 10 102% 17 Toronto E02 6 $3,267,730 $544,622 $518,865 9 8 102% 26 Toronto E03 2 $833,000 $416,500 $416,500 1 2 101% 4 Toronto E04 14 $5,952,300 $425,164 $420,000 18 15 103% 15 Toronto E05 17 $7,442,500 $437,794 $445,000 22 15 111% 15 Toronto E06 - - - - - - - - Toronto E07 8 $3,656,620 $457,078 $449,000 11 9 102% 16 Toronto E08 11 $3,706,000 $336,909 $388,000 13 8 99% 20 Toronto E09 10 $3,547,000 $354,700 $347,500 16 11 102% 17 Toronto E10 7 $2,059,500 $294,214 $288,000 13 10 103% 20 Toronto E11 15 $4,627,100 $308,473 $309,000 28 31 100% 17 SUMMARY OF EXISTING HOME TRANSACTIONS CONDOMINIUM TOWNHOUSES, APRIL 2015
- 13. Industrial Leasing July 2010Page 3 Toronto Real Estate Board Market Watch, April 2015 ALL TREB AREAS Sales 1 Dollar Volume 1 Average Price 1 Median Price 1 New Listings 2 Active Listings 3 Avg. SP/LP 4 Avg. DOM 5 TREB Total 2,451 $932,647,002 $380,517 $333,000 4,887 6,837 98% 28- - - - - - - - Halton Region 76 $27,064,072 $356,106 $299,000 120 197 98% 28 Burlington 32 $9,937,299 $310,541 $287,500 35 59 98% 18 Halton Hills 2 $554,810 $277,405 $277,405 4 5 97% 91 Milton 13 $4,135,800 $318,138 $322,500 18 22 98% 24 Oakville 29 $12,436,163 $428,833 $360,000 63 111 98% 38- - - - - - - - Peel Region 342 $96,139,915 $281,111 $260,000 640 887 98% 28 Brampton 58 $13,667,717 $235,650 $225,000 89 109 98% 28 Caledon 2 $819,000 $409,500 $409,500 1 - 99% 17 Mississauga 282 $81,653,198 $289,550 $266,000 550 778 98% 28- - - - - - - - City of Toronto 1,706 $695,386,284 $407,612 $356,000 3,524 4,866 98% 28 - - - - - - - - York Region 269 $98,646,187 $366,714 $335,000 528 807 98% 32 Aurora 3 $985,000 $328,333 $315,000 16 25 98% 68 E. Gwillimbury - - - - - - - - Georgina 1 $162,000 $162,000 $162,000 1 5 96% 12 King 4 $1,209,000 $302,250 $312,000 7 31 97% 96 Markham 102 $36,336,266 $356,238 $325,000 175 292 98% 33 Newmarket 5 $1,485,500 $297,100 $281,500 11 14 98% 20 Richmond Hill 58 $20,035,541 $345,440 $319,750 133 191 98% 34 Vaughan 96 $38,432,880 $400,343 $377,500 185 249 98% 26 Whitchurch-Stouffville - - - - - - - -- - - - - - - - Durham Region 54 $14,353,044 $265,797 $253,950 68 66 100% 27 Ajax 4 $824,490 $206,123 $209,500 9 11 99% 22 Brock - - - - - - - - Clarington 10 $2,349,000 $234,900 $218,000 12 11 99% 26 Oshawa 9 $1,972,000 $219,111 $184,000 11 11 101% 27 Pickering 17 $5,187,154 $305,127 $268,254 24 19 100% 14 Scugog 1 $327,000 $327,000 $327,000 2 1 102% 8 Uxbridge 1 $230,000 $230,000 $230,000 2 5 96% 83 Whitby 12 $3,463,400 $288,617 $278,500 8 8 100% 47- - - - - - - - Dufferin County - - - - - 2 - - Orangeville - - - - - 2 - -- - - - - - - - Simcoe County 4 $1,057,500 $264,375 $267,250 7 12 97% 136 Adjala-Tosorontio - - - - - - - - Bradford West Gwillimbury 1 $232,500 $232,500 $232,500 2 2 93% 4 Essa - - - - - - - - Innisfil - - - - - - - - New Tecumseth 3 $825,000 $275,000 $302,000 5 10 98% 179 ! TURN PAGE FOR CITY OF TORONTO TABLES OR CLICK HERE: SUMMARY OF EXISTING HOME TRANSACTIONS CONDOMINIUM APARTMENT, APRIL 2015 13
- 14. Industrial Leasing July 2010Page 3 Toronto Real Estate Board Market Watch, April 2015 14 CITY OF TORONTO MUNICIPAL BREAKDOWN Sales1 Dollar Volume1 Average Price1 Median Price1 New Listings2 Active Listings3 Avg. SP/LP4 Avg. DOM5 TREB Total 2,451 $932,647,002 $380,517 $333,000 4,887 6,837 98% 28 City of Toronto Total 1,706 $695,386,284 $407,612 $356,000 3,524 4,866 98% 28 Toronto West 345 $110,589,095 $320,548 $300,000 695 1,028 98% 29 Toronto W01 21 $7,599,790 $361,895 $360,000 83 109 99% 22 Toronto W02 24 $9,012,378 $375,516 $338,750 37 46 99% 20 Toronto W03 9 $2,831,925 $314,658 $310,000 11 13 97% 24 Toronto W04 27 $6,507,500 $241,019 $230,000 40 46 99% 25 Toronto W05 31 $6,965,400 $224,690 $208,000 48 85 97% 39 Toronto W06 80 $32,242,513 $403,031 $350,000 219 368 98% 33 Toronto W07 3 $1,302,000 $434,000 $335,000 8 9 98% 36 Toronto W08 101 $33,483,489 $331,520 $305,000 175 251 98% 26 Toronto W09 9 $2,382,100 $264,678 $310,000 26 31 102% 24 Toronto W10 40 $8,262,000 $206,550 $207,500 48 70 97% 35 Toronto Central 1,110 $516,308,321 $465,143 $395,000 2,448 3,383 98% 28 Toronto C01 443 $205,890,767 $464,765 $396,500 947 1,414 98% 27 Toronto C02 38 $38,178,700 $1,004,703 $750,000 123 181 98% 39 Toronto C03 14 $8,774,450 $626,746 $546,500 34 53 99% 52 Toronto C04 9 $4,712,900 $523,656 $390,000 25 36 98% 24 Toronto C06 14 $4,270,276 $305,020 $306,500 36 57 98% 28 Toronto C07 70 $26,954,939 $385,071 $371,000 161 198 98% 31 Toronto C08 174 $78,392,022 $450,529 $408,500 310 387 99% 25 Toronto C09 5 $3,276,000 $655,200 $618,000 33 36 100% 16 Toronto C10 43 $23,171,328 $538,868 $524,000 78 87 99% 23 Toronto C11 32 $9,701,300 $303,166 $275,000 52 43 98% 24 Toronto C12 9 $7,334,100 $814,900 $755,000 25 40 103% 19 Toronto C13 39 $14,001,900 $359,023 $321,800 79 86 99% 26 Toronto C14 148 $63,913,989 $431,851 $394,400 313 442 98% 30 Toronto C15 72 $27,735,650 $385,217 $324,500 232 323 98% 27 Toronto East 251 $68,488,868 $272,864 $258,000 381 455 98% 25 Toronto E01 12 $6,051,000 $504,250 $514,000 20 21 99% 12 Toronto E02 4 $1,466,000 $366,500 $390,000 16 27 101% 11 Toronto E03 10 $1,995,250 $199,525 $204,300 17 19 98% 22 Toronto E04 28 $5,138,300 $183,511 $163,250 49 48 97% 26 Toronto E05 42 $13,002,500 $309,583 $301,400 55 49 98% 20 Toronto E06 4 $2,045,400 $511,350 $458,700 6 12 105% 15 Toronto E07 54 $14,314,588 $265,085 $264,500 73 94 98% 35 Toronto E08 21 $5,183,000 $246,810 $225,000 24 23 99% 22 Toronto E09 50 $13,929,100 $278,582 $280,000 96 130 98% 26 Toronto E10 2 $422,490 $211,245 $211,245 5 14 98% 24 Toronto E11 24 $4,941,240 $205,885 $220,000 20 18 99% 23 SUMMARY OF EXISTING HOME TRANSACTIONS CONDOMINIUM APARTMENT, APRIL 2015
- 15. Industrial Leasing July 2010Page 3 Toronto Real Estate Board Market Watch, April 2015 ALL TREB AREAS Sales 1 Dollar Volume 1 Average Price 1 Median Price 1 New Listings 2 Active Listings 3 Avg. SP/LP 4 Avg. DOM 5 TREB Total 182 $98,058,314 $538,782 $550,444 230 120 104% 10- - - - - - - - Halton Region 7 $3,673,500 $524,786 $535,000 9 6 101% 6 Burlington 1 $460,000 $460,000 $460,000 1 1 101% 7 Halton Hills - - - - 1 1 - - Milton 1 $520,000 $520,000 $520,000 1 - 100% 3 Oakville 5 $2,693,500 $538,700 $548,000 6 4 101% 7- - - - - - - - Peel Region 11 $5,695,600 $517,782 $555,000 18 15 100% 10 Brampton 1 $378,000 $378,000 $378,000 6 6 98% 11 Caledon 1 $437,000 $437,000 $437,000 - 1 99% 4 Mississauga 9 $4,880,600 $542,289 $562,500 12 8 101% 11- - - - - - - - City of Toronto 12 $7,458,300 $621,525 $616,150 15 8 107% 9 - - - - - - - - York Region 76 $54,391,309 $715,675 $713,000 106 46 106% 9 Aurora 4 $2,455,500 $613,875 $640,000 5 2 104% 10 E. Gwillimbury - - - - - - - - Georgina 2 $718,000 $359,000 $359,000 1 - 100% 7 King 1 $825,000 $825,000 $825,000 2 2 97% 7 Markham 49 $36,564,609 $746,217 $733,333 65 26 107% 8 Newmarket 1 $429,100 $429,100 $429,100 1 - 100% 8 Richmond Hill 10 $7,518,100 $751,810 $730,500 16 7 105% 9 Vaughan 9 $5,881,000 $653,444 $629,000 16 9 102% 13 Whitchurch-Stouffville - - - - - - - -- - - - - - - - Durham Region 60 $21,388,305 $356,472 $338,900 59 23 102% 10 Ajax 6 $2,189,000 $364,833 $354,000 4 1 100% 12 Brock - - - - - - - - Clarington 35 $11,994,200 $342,691 $339,900 29 7 103% 9 Oshawa 9 $2,651,105 $294,567 $301,000 11 3 103% 7 Pickering 2 $1,011,000 $505,500 $505,500 5 4 105% 2 Scugog - - - - - - - - Uxbridge 1 $385,000 $385,000 $385,000 2 2 99% 55 Whitby 7 $3,158,000 $451,143 $440,000 8 6 100% 16- - - - - - - - Dufferin County - - - - - - - - Orangeville - - - - - - - -- - - - - - - - Simcoe County 16 $5,451,300 $340,706 $319,250 23 22 99% 17 Adjala-Tosorontio - - - - - - - - Bradford West Gwillimbury 6 $2,413,000 $402,167 $390,000 8 9 99% 15 Essa 7 $2,123,800 $303,400 $309,000 8 7 99% 21 Innisfil - - - - 2 3 - - New Tecumseth 3 $914,500 $304,833 $300,000 5 3 99% 13 SUMMARY OF EXISTING HOME TRANSACTIONS LINK, APRIL 2015 ! TURN PAGE FOR CITY OF TORONTO TABLES OR CLICK HERE: 15
- 16. Industrial Leasing July 2010Page 3 Toronto Real Estate Board Market Watch, April 2015 16 CITY OF TORONTO MUNICIPAL BREAKDOWN Sales1 Dollar Volume1 Average Price1 Median Price1 New Listings2 Active Listings3 Avg. SP/LP4 Avg. DOM5 TREB Total 182 $98,058,314 $538,782 $550,444 230 120 104% 10 City of Toronto Total 12 $7,458,300 $621,525 $616,150 15 8 107% 9 Toronto West - - - - 2 2 - - Toronto W01 - - - - - - - - Toronto W02 - - - - - - - - Toronto W03 - - - - - - - - Toronto W04 - - - - - - - - Toronto W05 - - - - - - - - Toronto W06 - - - - - - - - Toronto W07 - - - - - - - - Toronto W08 - - - - - - - - Toronto W09 - - - - - - - - Toronto W10 - - - - 2 2 - - Toronto Central 1 $707,000 $707,000 $707,000 3 2 103% 8 Toronto C01 - - - - - - - - Toronto C02 - - - - - - - - Toronto C03 - - - - - - - - Toronto C04 - - - - - - - - Toronto C06 - - - - - - - - Toronto C07 - - - - 1 1 - - Toronto C08 - - - - - - - - Toronto C09 - - - - - - - - Toronto C10 - - - - - - - - Toronto C11 - - - - - - - - Toronto C12 - - - - - - - - Toronto C13 - - - - 1 1 - - Toronto C14 - - - - - - - - Toronto C15 1 $707,000 $707,000 $707,000 1 - 103% 8 Toronto East 11 $6,751,300 $613,755 $611,500 10 4 107% 9 Toronto E01 - - - - - - - - Toronto E02 - - - - - - - - Toronto E03 - - - - - - - - Toronto E04 - - - - - - - - Toronto E05 6 $3,863,300 $643,883 $632,900 2 1 107% 9 Toronto E06 - - - - - - - - Toronto E07 4 $2,428,000 $607,000 $571,500 6 1 110% 10 Toronto E08 - - - - - - - - Toronto E09 - - - - - - - - Toronto E10 - - - - - - - - Toronto E11 1 $460,000 $460,000 $460,000 2 2 102% 6 SUMMARY OF EXISTING HOME TRANSACTIONS LINK, APRIL 2015
- 17. Industrial Leasing July 2010Page 3 Toronto Real Estate Board Market Watch, April 2015 ALL TREB AREAS Sales 1 Dollar Volume 1 Average Price 1 Median Price 1 New Listings 2 Active Listings 3 Avg. SP/LP 4 Avg. DOM 5 TREB Total 930 $494,390,180 $531,602 $500,000 1,248 698 102% 12- - - - - - - - Halton Region 167 $83,803,354 $501,816 $468,888 217 142 100% 14 Burlington 25 $11,714,700 $468,588 $450,000 27 23 100% 22 Halton Hills 12 $5,234,500 $436,208 $428,000 16 5 102% 10 Milton 68 $29,464,276 $433,298 $431,000 87 45 100% 10 Oakville 62 $37,389,878 $603,063 $570,000 87 69 99% 16- - - - - - - - Peel Region 152 $67,367,805 $443,209 $429,000 236 141 100% 13 Brampton 99 $40,134,027 $405,394 $405,000 129 70 100% 12 Caledon 9 $4,023,000 $447,000 $464,000 19 16 98% 25 Mississauga 44 $23,210,778 $527,518 $513,000 88 55 101% 14- - - - - - - - City of Toronto 156 $111,318,211 $713,578 $652,500 241 147 104% 11 - - - - - - - - York Region 290 $174,105,258 $600,363 $598,500 366 189 103% 12 Aurora 15 $7,829,900 $521,993 $513,000 19 8 105% 10 E. Gwillimbury 7 $2,583,100 $369,014 $377,000 5 - 101% 6 Georgina 10 $3,446,800 $344,680 $323,500 10 5 99% 11 King 3 $2,173,000 $724,333 $735,000 3 6 97% 33 Markham 86 $56,670,154 $658,955 $642,500 114 59 106% 13 Newmarket 20 $9,723,000 $486,150 $485,500 21 11 102% 13 Richmond Hill 64 $41,449,218 $647,644 $637,500 108 55 103% 11 Vaughan 67 $41,110,598 $613,591 $620,000 67 38 101% 13 Whitchurch-Stouffville 18 $9,119,488 $506,638 $505,000 19 7 102% 10- - - - - - - - Durham Region 131 $47,818,047 $365,023 $370,100 156 64 103% 9 Ajax 36 $14,138,147 $392,726 $401,750 44 16 104% 7 Brock 1 $232,500 $232,500 $232,500 2 1 99% 6 Clarington 19 $5,630,800 $296,358 $290,100 25 10 102% 11 Oshawa 21 $6,368,500 $303,262 $327,000 25 9 102% 11 Pickering 17 $7,293,500 $429,029 $420,000 21 13 104% 9 Scugog - - - - - - - - Uxbridge 1 $435,000 $435,000 $435,000 - 1 100% 35 Whitby 36 $13,719,600 $381,100 $380,500 39 14 103% 8- - - - - - - - Dufferin County 8 $2,283,500 $285,438 $275,000 7 3 98% 16 Orangeville 8 $2,283,500 $285,438 $275,000 7 3 98% 16- - - - - - - - Simcoe County 26 $7,694,005 $295,923 $288,750 25 12 99% 14 Adjala-Tosorontio - - - - - - - - Bradford West Gwillimbury 4 $1,564,300 $391,075 $421,250 4 2 99% 10 Essa 9 $2,380,300 $264,478 $274,900 8 2 99% 17 Innisfil 6 $1,735,505 $289,251 $303,000 6 5 98% 16 New Tecumseth 7 $2,013,900 $287,700 $290,000 7 3 100% 11 ! TURN PAGE FOR CITY OF TORONTO TABLES OR CLICK HERE: SUMMARY OF EXISTING HOME TRANSACTIONS ATTACHED/ROW/TOWNHOUSE, APRIL 2015 17
- 18. Industrial Leasing July 2010Page 3 Toronto Real Estate Board Market Watch, April 2015 18 CITY OF TORONTO MUNICIPAL BREAKDOWN Sales1 Dollar Volume1 Average Price1 Median Price1 New Listings2 Active Listings3 Avg. SP/LP4 Avg. DOM5 TREB Total 930 $494,390,180 $531,602 $500,000 1,248 698 102% 12 City of Toronto Total 156 $111,318,211 $713,578 $652,500 241 147 104% 11 Toronto West 40 $26,863,893 $671,597 $660,950 51 33 102% 13 Toronto W01 4 $3,534,000 $883,500 $895,500 4 2 107% 8 Toronto W02 4 $2,823,300 $705,825 $650,000 11 7 108% 8 Toronto W03 - - - - 3 4 - - Toronto W04 2 $1,111,000 $555,500 $555,500 3 3 100% 15 Toronto W05 5 $2,592,888 $518,578 $520,000 8 8 99% 13 Toronto W06 11 $7,549,588 $686,326 $672,000 9 2 103% 11 Toronto W07 3 $2,152,617 $717,539 $690,717 3 2 101% 10 Toronto W08 8 $5,678,500 $709,813 $711,500 7 4 99% 22 Toronto W09 1 $473,000 $473,000 $473,000 2 1 105% 3 Toronto W10 2 $949,000 $474,500 $474,500 1 - 101% 13 Toronto Central 49 $45,442,638 $927,401 $838,800 87 68 103% 10 Toronto C01 16 $13,317,400 $832,338 $728,250 27 19 105% 11 Toronto C02 5 $7,493,250 $1,498,650 $1,200,000 11 11 101% 7 Toronto C03 - - - - 1 1 - - Toronto C04 1 $755,000 $755,000 $755,000 2 2 99% 8 Toronto C06 1 $770,000 $770,000 $770,000 1 - 107% 4 Toronto C07 6 $5,190,800 $865,133 $869,500 8 5 100% 14 Toronto C08 13 $11,404,888 $877,299 $840,000 17 11 105% 12 Toronto C09 - - - - 2 2 - - Toronto C10 - - - - - - - - Toronto C11 - - - - - - - - Toronto C12 - - - - 1 1 - - Toronto C13 2 $1,453,000 $726,500 $726,500 10 7 100% 6 Toronto C14 5 $5,058,300 $1,011,660 $996,500 7 9 98% 6 Toronto C15 - - - - - - - - Toronto East 67 $39,011,680 $582,264 $575,000 103 46 107% 11 Toronto E01 17 $12,364,580 $727,328 $690,000 23 12 112% 11 Toronto E02 3 $1,989,000 $663,000 $641,000 7 2 116% 5 Toronto E03 1 $620,000 $620,000 $620,000 3 2 104% 0 Toronto E04 12 $6,750,900 $562,575 $582,500 17 10 102% 16 Toronto E05 8 $4,618,400 $577,300 $575,500 14 5 110% 7 Toronto E06 - - - - - - - - Toronto E07 3 $1,753,000 $584,333 $595,000 10 5 108% 8 Toronto E08 2 $931,500 $465,750 $465,750 2 - 105% 10 Toronto E09 - - - - - - - - Toronto E10 10 $4,928,800 $492,880 $489,750 11 3 103% 12 Toronto E11 11 $5,055,500 $459,591 $430,000 16 7 105% 12 SUMMARY OF EXISTING HOME TRANSACTIONS ATTACHED/ROW/TOWNHOUSE, APRIL 2015
- 19. Industrial Leasing July 2010Page 3 Toronto Real Estate Board Market Watch, April 2015 ALL TREB AREAS Sales 1 Dollar Volume 1 Average Price 1 Median Price 1 New Listings 2 Active Listings 3 Avg. SP/LP 4 Avg. DOM 5 TREB Total 13 $4,623,500 $355,654 $342,000 25 38 97% 35- - - - - - - - Halton Region 1 $655,000 $655,000 $655,000 2 1 97% 83 Burlington - - - - 2 1 - - Halton Hills - - - - - - - - Milton - - - - - - - - Oakville 1 $655,000 $655,000 $655,000 - - 97% 83- - - - - - - - Peel Region - - - - - 1 - - Brampton - - - - - - - - Caledon - - - - - - - - Mississauga - - - - - 1 - -- - - - - - - - City of Toronto 12 $3,968,500 $330,708 $313,500 21 33 97% 31 - - - - - - - - York Region - - - - 2 3 - - Aurora - - - - - - - - E. Gwillimbury - - - - - - - - Georgina - - - - - - - - King - - - - - - - - Markham - - - - - 1 - - Newmarket - - - - - - - - Richmond Hill - - - - 2 2 - - Vaughan - - - - - - - - Whitchurch-Stouffville - - - - - - - -- - - - - - - - Durham Region - - - - - - - - Ajax - - - - - - - - Brock - - - - - - - - Clarington - - - - - - - - Oshawa - - - - - - - - Pickering - - - - - - - - Scugog - - - - - - - - Uxbridge - - - - - - - - Whitby - - - - - - - -- - - - - - - - Dufferin County - - - - - - - - Orangeville - - - - - - - -- - - - - - - - Simcoe County - - - - - - - - Adjala-Tosorontio - - - - - - - - Bradford West Gwillimbury - - - - - - - - Essa - - - - - - - - Innisfil - - - - - - - - New Tecumseth - - - - - - - - SUMMARY OF EXISTING HOME TRANSACTIONS CO-OP APARTMENT, APRIL 2015 ! TURN PAGE FOR CITY OF TORONTO TABLES OR CLICK HERE: 19
- 20. Industrial Leasing July 2010Page 3 Toronto Real Estate Board Market Watch, April 2015 20 CITY OF TORONTO MUNICIPAL BREAKDOWN Sales1 Dollar Volume1 Average Price1 Median Price1 New Listings2 Active Listings3 Avg. SP/LP4 Avg. DOM5 TREB Total 13 $4,623,500 $355,654 $342,000 25 38 97% 35 City of Toronto Total 12 $3,968,500 $330,708 $313,500 21 33 97% 31 Toronto West 4 $1,003,000 $250,750 $208,000 6 10 95% 31 Toronto W01 - - - - - - - - Toronto W02 - - - - - 1 - - Toronto W03 - - - - - - - - Toronto W04 - - - - - - - - Toronto W05 1 $127,000 $127,000 $127,000 1 2 89% 5 Toronto W06 2 $591,000 $295,500 $295,500 1 3 95% 42 Toronto W07 1 $285,000 $285,000 $285,000 - - 97% 35 Toronto W08 - - - - 1 1 - - Toronto W09 - - - - 3 3 - - Toronto W10 - - - - - - - - Toronto Central 7 $2,727,500 $389,643 $399,000 13 21 98% 35 Toronto C01 - - - - 2 4 - - Toronto C02 - - - - 2 4 - - Toronto C03 2 $525,500 $262,750 $262,750 2 3 98% 24 Toronto C04 1 $123,000 $123,000 $123,000 - 2 98% 94 Toronto C06 - - - - - - - - Toronto C07 - - - - - - - - Toronto C08 - - - - - - - - Toronto C09 4 $2,079,000 $519,750 $545,000 6 6 98% 25 Toronto C10 - - - - - - - - Toronto C11 - - - - - - - - Toronto C12 - - - - - - - - Toronto C13 - - - - - - - - Toronto C14 - - - - 1 1 - - Toronto C15 - - - - - 1 - - Toronto East 1 $238,000 $238,000 $238,000 2 2 99% 5 Toronto E01 - - - - - - - - Toronto E02 - - - - 1 2 - - Toronto E03 - - - - - - - - Toronto E04 1 $238,000 $238,000 $238,000 1 - 99% 5 Toronto E05 - - - - - - - - Toronto E06 - - - - - - - - Toronto E07 - - - - - - - - Toronto E08 - - - - - - - - Toronto E09 - - - - - - - - Toronto E10 - - - - - - - - Toronto E11 - - - - - - - - SUMMARY OF EXISTING HOME TRANSACTIONS CO-OP APARTMENT, APRIL 2015
- 21. Industrial Leasing July 2010Page 3 Toronto Real Estate Board Market Watch, April 2015 ALL TREB AREAS Sales 1 Dollar Volume 1 Average Price 1 Median Price 1 New Listings 2 Active Listings 3 Avg. SP/LP 4 Avg. DOM 5 TREB Total 11 $4,835,000 $439,545 $400,000 24 29 98% 38- - - - - - - - Halton Region - - - - 2 2 - - Burlington - - - - 2 2 - - Halton Hills - - - - - - - - Milton - - - - - - - - Oakville - - - - - - - -- - - - - - - - Peel Region 3 $1,475,000 $491,667 $402,500 5 4 98% 29 Brampton 1 $402,500 $402,500 $402,500 2 2 96% 50 Caledon 1 $730,000 $730,000 $730,000 2 1 97% 24 Mississauga 1 $342,500 $342,500 $342,500 1 1 99% 14- - - - - - - - City of Toronto 1 $400,000 $400,000 $400,000 2 1 93% 6 - - - - - - - - York Region 1 $665,000 $665,000 $665,000 1 1 98% 43 Aurora - - - - - - - - E. Gwillimbury - - - - - - - - Georgina - - - - - - - - King - - - - - - - - Markham - - - - - - - - Newmarket - - - - - - - - Richmond Hill - - - - - - - - Vaughan - - - - - - - - Whitchurch-Stouffville 1 $665,000 $665,000 $665,000 1 1 98% 43- - - - - - - - Durham Region 1 $325,000 $325,000 $325,000 - 1 99% 9 Ajax 1 $325,000 $325,000 $325,000 - 1 99% 9 Brock - - - - - - - - Clarington - - - - - - - - Oshawa - - - - - - - - Pickering - - - - - - - - Scugog - - - - - - - - Uxbridge - - - - - - - - Whitby - - - - - - - -- - - - - - - - Dufferin County - - - - - - - - Orangeville - - - - - - - -- - - - - - - - Simcoe County 5 $1,970,000 $394,000 $390,000 14 20 98% 55 Adjala-Tosorontio - - - - - - - - Bradford West Gwillimbury - - - - - - - - Essa - - - - - - - - Innisfil - - - - - - - - New Tecumseth 5 $1,970,000 $394,000 $390,000 14 20 98% 55 ! TURN PAGE FOR CITY OF TORONTO TABLES OR CLICK HERE: SUMMARY OF EXISTING HOME TRANSACTIONS DETACHED CONDOMINIUM, APRIL 2015 21
- 22. Industrial Leasing July 2010Page 3 Toronto Real Estate Board Market Watch, April 2015 22 CITY OF TORONTO MUNICIPAL BREAKDOWN Sales1 Dollar Volume1 Average Price1 Median Price1 New Listings2 Active Listings3 Avg. SP/LP4 Avg. DOM5 TREB Total 11 $4,835,000 $439,545 $400,000 24 29 98% 38 City of Toronto Total 1 $400,000 $400,000 $400,000 2 1 93% 6 Toronto West - - - - - - - - Toronto W01 - - - - - - - - Toronto W02 - - - - - - - - Toronto W03 - - - - - - - - Toronto W04 - - - - - - - - Toronto W05 - - - - - - - - Toronto W06 - - - - - - - - Toronto W07 - - - - - - - - Toronto W08 - - - - - - - - Toronto W09 - - - - - - - - Toronto W10 - - - - - - - - Toronto Central - - - - 1 1 - - Toronto C01 - - - - - - - - Toronto C02 - - - - - - - - Toronto C03 - - - - - - - - Toronto C04 - - - - - - - - Toronto C06 - - - - - - - - Toronto C07 - - - - - - - - Toronto C08 - - - - - - - - Toronto C09 - - - - - - - - Toronto C10 - - - - - - - - Toronto C11 - - - - - - - - Toronto C12 - - - - 1 1 - - Toronto C13 - - - - - - - - Toronto C14 - - - - - - - - Toronto C15 - - - - - - - - Toronto East 1 $400,000 $400,000 $400,000 1 - 93% 6 Toronto E01 - - - - - - - - Toronto E02 - - - - - - - - Toronto E03 - - - - - - - - Toronto E04 - - - - - - - - Toronto E05 - - - - - - - - Toronto E06 - - - - - - - - Toronto E07 - - - - - - - - Toronto E08 - - - - - - - - Toronto E09 - - - - - - - - Toronto E10 - - - - - - - - Toronto E11 1 $400,000 $400,000 $400,000 1 - 93% 6 SUMMARY OF EXISTING HOME TRANSACTIONS DETACHED CONDOMINIUM, APRIL 2015
- 23. Industrial Leasing July 2010Page 3 Toronto Real Estate Board Market Watch, April 2015 23 ALL TREB AREAS Sales 1 Dollar Volume 1 Average Price 1 Median Price 1 New Listings 2 Active Listings 3 Avg. SP/LP 4 Avg. DOM 5 TREB Total 6 $1,790,800 $298,467 $253,400 15 21 99% 20- - - - - - - - Halton Region - - - - - - - - Burlington - - - - - - - - Halton Hills - - - - - - - - Milton - - - - - - - - Oakville - - - - - - - -- - - - - - - - Peel Region - - - - - - - - Brampton - - - - - - - - Caledon - - - - - - - - Mississauga - - - - - - - -- - - - - - - - City of Toronto 6 $1,790,800 $298,467 $253,400 15 21 99% 20 - - - - - - - - York Region - - - - - - - - Aurora - - - - - - - - E. Gwillimbury - - - - - - - - Georgina - - - - - - - - King - - - - - - - - Markham - - - - - - - - Newmarket - - - - - - - - Richmond Hill - - - - - - - - Vaughan - - - - - - - - Whitchurch-Stouffville - - - - - - - -- - - - - - - - Durham Region - - - - - - - - Ajax - - - - - - - - Brock - - - - - - - - Clarington - - - - - - - - Oshawa - - - - - - - - Pickering - - - - - - - - Scugog - - - - - - - - Uxbridge - - - - - - - - Whitby - - - - - - - -- - - - - - - - Dufferin County - - - - - - - - Orangeville - - - - - - - -- - - - - - - - Simcoe County - - - - - - - - Adjala-Tosorontio - - - - - - - - Bradford West Gwillimbury - - - - - - - - Essa - - - - - - - - Innisfil - - - - - - - - New Tecumseth - - - - - - - - ! TURN PAGE FOR CITY OF TORONTO TABLES OR CLICK HERE: SUMMARY OF EXISTING HOME TRANSACTIONS CO-OWNERSHIP APARTMENT, APRIL 2015
- 24. Industrial Leasing July 2010Page 3 Toronto Real Estate Board Market Watch, April 2015 24 CITY OF TORONTO MUNICIPAL BREAKDOWN Sales1 Dollar Volume1 Average Price1 Median Price1 New Listings2 Active Listings3 Avg. SP/LP4 Avg. DOM5 TREB Total 6 $1,790,800 $298,467 $253,400 15 21 99% 20 City of Toronto Total 6 $1,790,800 $298,467 $253,400 15 21 99% 20 Toronto West - - - - 2 4 - - Toronto W01 - - - - - - - - Toronto W02 - - - - 1 1 - - Toronto W03 - - - - - - - - Toronto W04 - - - - - - - - Toronto W05 - - - - 1 3 - - Toronto W06 - - - - - - - - Toronto W07 - - - - - - - - Toronto W08 - - - - - - - - Toronto W09 - - - - - - - - Toronto W10 - - - - - - - - Toronto Central 6 $1,790,800 $298,467 $253,400 13 17 99% 20 Toronto C01 - - - - - - - - Toronto C02 - - - - 1 1 - - Toronto C03 2 $595,000 $297,500 $297,500 4 3 96% 35 Toronto C04 2 $424,000 $212,000 $212,000 2 2 98% 13 Toronto C06 - - - - - - - - Toronto C07 - - - - - - - - Toronto C08 - - - - 1 4 - - Toronto C09 1 $525,000 $525,000 $525,000 1 1 101% 21 Toronto C10 - - - - 1 1 - - Toronto C11 - - - - - - - - Toronto C12 - - - - - - - - Toronto C13 - - - - 1 1 - - Toronto C14 - - - - 1 4 - - Toronto C15 1 $246,800 $246,800 $246,800 1 - 103% 5 Toronto East - - - - - - - - Toronto E01 - - - - - - - - Toronto E02 - - - - - - - - Toronto E03 - - - - - - - - Toronto E04 - - - - - - - - Toronto E05 - - - - - - - - Toronto E06 - - - - - - - - Toronto E07 - - - - - - - - Toronto E08 - - - - - - - - Toronto E09 - - - - - - - - Toronto E10 - - - - - - - - Toronto E11 - - - - - - - - SUMMARY OF EXISTING HOME TRANSACTIONS CO-OWNERSHIP APARTMENT, APRIL 2015
- 25. Industrial Leasing July 2010Page 3 Toronto Real Estate Board Market Watch, April 2015 25 FOCUS ON THE MLS® HOME PRICE INDEX INDEX AND BENCHMARK PRICE, APRIL 2015 ALL TREB AREAS Index Benchmark Yr./Yr. % Chg. Index Benchmark Yr./Yr. % Chg. Index Benchmark Yr./Yr. % Chg. Index Benchmark Yr./Yr. % Chg. Index Benchmark Yr./Yr. % Chg. TREB Total 178.7 $545,400 8.43% 182.3 $678,300 9.82% 187.2 $529,300 9.28% 172.1 $376,400 7.23% 160.5 $322,600 4.02% Halton Region 188.1 $616,200 8.48% 185.9 $689,900 8.71% 188.1 $488,100 7.61% 180.0 $354,900 9.22% - - - Burlington 189.8 $569,700 7.60% 188.5 $664,000 7.53% 188.0 $448,100 6.03% 185.0 $366,800 8.95% - - - Halton Hills 171.5 $499,300 7.79% 170.1 $544,200 6.91% 181.0 $445,800 6.35% 169.5 $305,600 9.14% - - - Milton 177.6 $490,400 6.28% 167.6 $581,100 6.55% 180.9 $451,600 6.41% - - - - - - Oakville 198.3 $731,200 9.68% 197.1 $816,900 9.56% 199.9 $541,200 9.90% 183.3 $404,800 9.04% - - - Peel Region 170.3 $466,200 8.54% 172.9 $586,000 9.50% 175.8 $448,500 10.22% 173.1 $358,200 6.72% 146.0 $251,600 3.18% Brampton 164.9 $420,800 10.08% 164.8 $482,000 10.01% 167.4 $394,300 10.57% 158.8 $294,900 8.77% 134.0 $209,700 6.94% Caledon 156.4 $558,200 7.42% 157.6 $579,900 7.80% 169.1 $418,100 4.58% - - - - - - Mississauga 175.9 $492,200 7.65% 185.5 $692,500 9.44% 186.4 $509,200 10.43% 177.8 $381,800 6.28% 148.3 $260,100 2.70% City of Toronto 179.6 $588,900 6.34% 189.9 $823,300 8.39% 194.3 $645,600 6.41% 175.6 $424,400 6.30% 163.2 $337,200 3.75% York Region 195.9 $672,300 11.94% 197.3 $775,600 12.29% 201.1 $582,700 12.28% 177.4 $450,800 10.05% 161.7 $350,800 5.07% Aurora 183.8 $591,600 10.19% 184.3 $684,700 10.43% 189.0 $488,700 9.50% 146.3 $370,600 6.71% 158.6 $328,000 9.61% E. Gwillimbury 161.7 $524,100 4.86% 162.8 $536,500 5.30% 170.3 $360,600 3.15% - - - - - - Georgina 163.9 $340,200 9.93% 171.2 $352,700 10.45% 180.2 $355,100 11.58% - - - - - - King 174.1 $738,100 7.34% 175.1 $738,800 6.90% - - - - - - - - - Markham 205.4 $706,900 14.24% 211.5 $869,400 15.26% 210.0 $625,400 15.64% 185.1 $459,800 10.18% 163.0 $375,800 2.32% Newmarket 179.1 $528,200 11.87% 177.6 $597,900 12.26% 185.1 $436,500 11.71% 173.5 $350,300 12.30% 159.0 $267,800 7.94% Richmond Hill 206.7 $749,500 12.40% 219.3 $932,200 13.27% 211.2 $640,400 10.87% 168.6 $471,900 6.44% 157.6 $328,300 4.93% Vaughan 191.3 $691,500 9.56% 183.8 $765,100 9.47% 197.4 $600,700 9.67% 189.7 $518,300 13.12% 164.5 $365,100 8.37% Whitchurch-Stouffville 197.1 $743,100 14.46% 196.3 $753,300 13.47% 177.7 $488,100 15.09% - - - - - - Durham Region 162.9 $383,200 11.35% 161.8 $421,700 11.13% 170.6 $341,800 12.61% 147.6 $242,000 7.74% 157.0 $282,200 12.14% Ajax 171.6 $424,100 12.16% 171.1 $458,300 12.20% 179.0 $385,000 12.23% 156.0 $285,100 11.51% 149.7 $254,200 10.40% Brock 134.6 $254,400 3.94% 135.4 $256,400 4.07% 0.0 $0 0.00% - - - - - - Clarington 160.9 $340,500 13.79% 153.7 $369,400 11.78% 166.4 $317,700 15.00% 162.5 $290,900 2.01% 157.2 $222,500 13.01% Oshawa 154.9 $296,700 9.86% 154.9 $329,900 10.33% 163.3 $273,600 11.70% 129.9 $173,800 6.30% 151.2 $204,000 8.23% Pickering 170.2 $460,200 10.45% 171.2 $535,000 9.81% 178.0 $414,900 11.67% 159.9 $287,100 9.97% 164.6 $322,300 14.07% Scugog 151.6 $393,400 8.60% 155.6 $400,700 8.36% 143.9 $301,200 6.59% - - - - - - Uxbridge 152.9 $467,500 7.68% 153.3 $474,800 7.88% 146.1 $358,500 5.03% - - - - - - Whitby 165.5 $431,800 12.59% 166.9 $479,500 12.77% 170.2 $375,000 13.62% 147.2 $269,900 5.22% 152.3 $297,100 10.36% Dufferin County 160.4 $367,600 6.01% 166.7 $379,900 6.93% 157.1 $294,500 5.72% - - - - - - Orangeville 160.4 $367,600 6.01% 166.7 $379,900 6.93% 157.1 $294,500 5.72% - - - - - - Simcoe County 156.6 $333,900 6.10% 151.6 $335,900 5.72% 163.7 $314,200 6.71% - - - - - - Adjala-Tosorontio 137.4 $487,600 7.60% 137.4 $487,600 7.60% - - - - - - - - - Bradford West Gwillimbury 172.8 $429,500 5.95% 156.0 $477,800 5.83% 176.1 $366,100 4.88% - - - - - - Essa 155.2 $363,500 6.81% 153.9 $389,200 7.47% 156.4 $266,400 8.16% - - - - - - Innisfil 152.9 $282,800 4.80% 152.8 $283,200 4.44% 168.0 $261,300 6.40% - - - - - - New Tecumseth 146.4 $338,100 7.73% 143.1 $368,600 7.59% 152.0 $290,200 7.73% - - - - - - Townhouse Apartment ! TURN PAGE FOR CITY OF TORONTO TABLES OR CLICK HERE: Composite Single-Family Detached Single-Family Attached CLICK HERE FOR MORE BACKGROUND INFORMATION ON THE MLS® HPI
- 26. Industrial Leasing July 2010Page 3 Toronto Real Estate Board Market Watch, April 2015 26 FOCUS ON THE MLS® HOME PRICE INDEX INDEX AND BENCHMARK PRICE, APRIL 2015 CITY OF TORONTO Index Benchmark Yr./Yr. % Chg. Index Benchmark Yr./Yr. % Chg. Index Benchmark Yr./Yr. % Chg. Index Benchmark Yr./Yr. % Chg. Index Benchmark Yr./Yr. % Chg. TREB Total 178.7 $545,400 8.43% 182.3 $678,300 9.82% 187.2 $529,300 9.28% 172.1 $376,400 7.23% 160.5 $322,600 4.02% City of Toronto 179.6 $588,900 6.34% 189.9 $823,300 8.39% 194.3 $645,600 6.41% 175.6 $424,400 6.30% 163.2 $337,200 3.75% Toronto W01 166.4 $678,800 2.53% 175.6 $905,100 5.47% 188.6 $727,700 7.65% 204.0 $420,100 -2.35% 142.1 $331,400 0.42% Toronto W02 197.0 $709,900 3.74% 206.2 $846,400 8.76% 230.2 $705,200 4.30% 149.9 $413,300 5.41% 136.7 $554,500 3.09% Toronto W03 192.7 $499,700 10.62% 197.0 $535,800 10.86% 199.7 $511,600 10.33% - - - 136.3 $259,900 5.74% Toronto W04 168.8 $442,100 9.97% 177.6 $560,400 10.31% 176.3 $512,700 10.74% 143.2 $347,900 2.87% 147.3 $217,000 8.87% Toronto W05 156.2 $371,600 7.06% 173.1 $577,100 6.92% 160.8 $470,100 7.49% 150.8 $248,000 4.43% 126.4 $166,000 8.13% Toronto W06 157.6 $459,300 3.62% 198.0 $628,400 7.78% 166.6 $505,100 10.26% 161.9 $477,000 5.75% 120.7 $301,500 -4.13% Toronto W07 177.0 $754,400 7.01% 184.3 $796,500 6.29% 172.4 $706,900 12.02% 134.6 $494,800 1.28% 111.5 $452,100 0.45% Toronto W08 155.4 $632,200 4.09% 170.3 $890,800 4.74% 173.1 $657,100 4.40% 146.2 $357,400 5.71% 140.3 $282,400 4.31% Toronto W09 167.2 $430,100 7.66% 179.8 $672,700 4.35% 168.3 $471,800 7.61% 159.6 $412,500 5.21% 145.2 $186,200 12.65% Toronto W10 160.1 $371,600 10.95% 176.6 $519,600 12.27% 172.0 $465,100 11.91% 138.8 $250,100 11.13% 134.4 $205,200 6.33% Toronto C01 189.8 $470,400 1.77% 190.0 $670,700 -5.43% 200.6 $698,600 -5.02% 187.5 $558,500 6.41% 187.4 $390,200 2.52% Toronto C02 196.9 $934,900 10.62% 183.7 $1,456,100 12.84% 208.0 $1,094,500 14.92% 180.7 $845,000 4.45% 193.5 $539,600 7.68% Toronto C03 202.4 $1,041,700 12.26% 198.7 $1,197,500 11.69% 209.4 $775,200 14.36% - - - 198.7 $524,900 11.50% Toronto C04 180.2 $1,116,500 7.71% 186.6 $1,304,400 8.36% 183.7 $878,200 6.06% 160.8 $600,700 1.07% 148.9 $354,000 2.97% Toronto C06 186.9 $745,600 4.59% 194.9 $834,200 5.87% 172.7 $645,100 7.40% 0.0 $0 0.00% 176.9 $391,200 2.25% Toronto C07 177.5 $609,600 7.58% 207.9 $951,700 8.96% 170.5 $609,100 2.71% 148.6 $436,200 3.99% 155.1 $365,300 5.51% Toronto C08 176.0 $453,200 1.91% 153.7 $477,400 -3.88% 188.7 $786,800 4.37% 174.7 $529,800 -4.85% 176.0 $388,200 2.15% Toronto C09 131.1 $973,600 -3.32% 122.2 $1,535,000 -0.97% 139.0 $1,131,100 -2.66% 164.3 $848,100 2.18% 136.9 $453,600 -5.78% Toronto C10 195.2 $761,400 4.11% 194.1 $1,191,100 9.04% 191.5 $945,800 6.86% 224.2 $514,100 4.18% 196.0 $469,600 1.92% Toronto C11 174.2 $624,200 8.67% 170.7 $1,144,600 5.89% 188.4 $834,900 2.11% 113.9 $181,700 -6.26% 178.8 $254,500 12.17% Toronto C12 165.2 $1,415,800 4.96% 159.3 $1,712,000 5.78% 184.0 $789,800 5.69% 178.1 $603,300 7.16% 177.5 $558,300 1.54% Toronto C13 170.5 $629,000 6.63% 185.4 $993,400 6.31% 173.9 $558,000 6.43% 164.9 $469,600 7.15% 151.5 $299,700 5.35% Toronto C14 181.9 $618,100 4.90% 220.2 $1,194,700 11.04% 194.1 $946,900 2.64% 224.9 $759,900 -3.39% 163.6 $411,400 2.38% Toronto C15 184.4 $616,500 10.62% 213.0 $998,400 11.99% 195.5 $636,500 12.75% 194.3 $478,700 8.79% 151.7 $354,500 7.82% Toronto E01 214.5 $666,600 5.10% 213.1 $719,700 6.82% 227.3 $716,700 6.71% 198.0 $400,400 -7.78% 188.6 $447,400 0.43% Toronto E02 195.4 $728,500 3.22% 179.2 $789,200 2.22% 205.4 $686,700 3.53% 200.0 $640,800 5.15% 192.7 $528,100 7.29% Toronto E03 185.2 $570,500 6.74% 189.3 $635,900 8.11% 186.0 $605,700 5.38% - - - 146.6 $219,300 5.77% Toronto E04 183.8 $461,400 5.03% 191.9 $566,600 6.32% 183.6 $445,500 4.20% 176.7 $381,900 3.15% 175.6 $266,000 0.69% Toronto E05 178.5 $477,400 10.12% 201.3 $710,800 8.81% 197.1 $542,800 8.00% 182.2 $396,100 10.96% 149.8 $294,300 11.21% Toronto E06 189.9 $536,200 2.76% 190.0 $543,000 2.37% 184.9 $439,900 -3.80% - - - 182.6 $402,600 10.13% Toronto E07 194.3 $479,400 11.86% 220.3 $721,000 14.56% 212.9 $556,500 16.09% 192.0 $416,000 8.47% 164.4 $281,500 9.38% Toronto E08 179.5 $440,900 10.60% 192.6 $601,300 9.62% 155.6 $399,700 -3.71% 173.8 $354,800 5.40% 146.9 $234,500 9.63% Toronto E09 173.4 $418,700 9.68% 194.0 $552,100 12.73% 177.7 $436,100 8.35% 170.4 $314,000 10.43% 149.2 $279,800 5.07% Toronto E10 189.2 $535,600 14.95% 191.5 $613,000 15.36% 183.3 $476,800 12.45% 189.1 $331,200 11.17% 138.9 $223,900 6.76% Toronto E11 176.4 $388,900 12.21% 195.1 $541,800 11.81% 189.0 $428,400 12.90% 149.7 $294,200 14.98% 145.5 $217,200 10.06% ApartmentComposite Single-Family Detached Single-Family Attached Townhouse CLICK HERE FOR MORE BACKGROUND INFORMATION ON THE MLS® HPI
- 27. July 2010Page 3 Toronto Real Estate Board Market Watch, April 2015 27 YEAR SALES AVERAGE PRICE 2004 83,501 $315,231 2005 84,145 $335,907 2006 83,084 $351,941 2007 93,193 $376,236 2008 74,552 $379,347 2009 87,308 $395,460 2010 85,545 $431,276 2011 89,096 $465,014 2012 85,496 $497,130 2013 87,049 $522,958 2014 92,788 $566,627 January 4,103 $526,965 February 5,696 $552,859 March 8,052 $557,982 April 9,660 $578,354 May 11,013 $584,946 June 10,133 $569,174 July 9,152 $550,685 August 7,567 $546,511 September 8,002 $574,447 October 8,513 $587,906 November 6,476 $577,502 December 4,421 $556,209 Annual 92,788 $566,627 January 4,323 $553,049 February 6,311 $596,632 March 8,917 $613,865 April 11,303 $635,932 May - - June - - July - - August - - September - - October - - November - - December - - Year-to-Date 30,854 $609,903 HISTORIC ANNUAL STATISTICS1,6,7 2015 MONTHLY STATISTICS1,7 2014 MONTHLY STATISTICS1,7 *For historic annual sales and average price data over a longer time frame go to: http://www.torontorealestateboard.com/market_news/market_watch/histori c_stats/pdf/TREB_historic_statistics.pdf NOTES 8 SNLR = Sales-to-New Listings Ratio. Calculated using a 12-month moving average (sales/new listings). 9 Mos. Inv. = Months of Inventory. Calculated using a 12-month moving average (active listings/sales). 7 Past monthly and year-to-date figures are revised on a monthly basis. 1 Sales, dollar volume, average sale prices and median sale prices are based on firm transactions entered into the TorontoMLS® system between the first and last day of the month/period being reported. 2 New listings entered into the TorontoMLS® system between the first and last day of the month/period being reported. 3 Active listings at the end of the last day of the month/period being reported. 4 Ratio of the average selling price to the average listing price for firm transactions entered into the TorontoMLS® system between the first and last day of the month/period being reported. 5 Average number of days on the market for firm transactions entered into the TorontoMLS® system between the first and last day of the month/period being reported. 6 Due to past changes to TREB's service area, caution should be exercised when making historical comparisons. Copyright® 2015 Toronto Real Estate Board