FEATURE REVERSAL: A NEW TEST OF ASSOCIATIVE LEARNING THEORIES

Theories of learning aim at elucidating how organisms utilize experiences to guide behavior in similar future conditions. Here we present results from a new experimental design, dubbed “feature reversal,” aimed at contrasting several theories of associative learning: the Rescorla & Wagner (1972) model, the “replaced elements model” (REM) of Brandon et al. (2000), and the “configural model” of Pearce (1987, 1994). The experiment has two learning phases and a final test. The first phase consists of reinforced presentations of stimulus A; the second phase of unreinforced presentations of A intermixed with reinforced presentations of A together with a second stimulus B. Schematically: Phase 1: A+; Phase 2: A0, AB+ In the final test, responding to B alone is assessed – different models making different predictions. Varying the similarity between A and B further differentiates model predictions (see THEORY). We ran this experiment using colored squares as stimuli A and B, presented on a computer screen. We planned to collect data from 60 subjects, divided into three groups with varying similarity between A and B. Subjects were instructed that pressing the spacebar in response to some stimuli would cause a smiley face to appear, and that they had to learn to press solely in response to those stimuli which they thought would yield a smiley face. Thus the smiley face served to reinforce pressing the spacebar.

Empfohlen
Weitere ähnliche Inhalte
Ähnlich wie FEATURE REVERSAL: A NEW TEST OF ASSOCIATIVE LEARNING THEORIES
Ähnlich wie FEATURE REVERSAL: A NEW TEST OF ASSOCIATIVE LEARNING THEORIES (12)
Mehr von Goldy Landau
Mehr von Goldy Landau (8)
Kürzlich hochgeladen
Kürzlich hochgeladen (20)
FEATURE REVERSAL: A NEW TEST OF ASSOCIATIVE LEARNING THEORIES
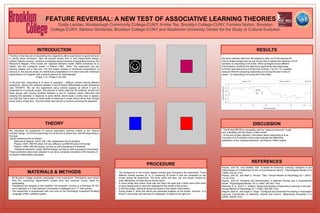
- 1. FEATURE REVERSAL: A NEW TEST OF ASSOCIATIVE LEARNING THEORIES Goldy Landau, Kinsborough Community College-CUNY, Kristie Tse, Brooklyn College-CUNY, Furness Norton, Brooklyn College-CUNY, Stefano Ghirlanda, Brooklyn College-CUNY and Stockholm University Center for the Study of Cultural Evolution * The finding RB<RA is compatible with the “replaced elements” model and, potentially with the Pearce (1994) model. * At the end of data collection, information about responding to B as a function of A-B similarity will be used evaluate the differential predictions of the "replaced elements" and Pearce (1994) models. DISCUSSION Pearce, John M., and Geoffrey Hall. "A Model for Pavlovian Learning: Variations in the Effectiveness of Conditioned but Not of Unconditioned Stimuli." Psychological Review 87.6 (1980): 532-52. Print. Pearce, John M., and Mark E. Bouton. "Tala." Annual Review of Psychology 52.1 (2001): 111-39. Print. Pearce, John M. "Similarity and Discrimination: A Selective Review and a Connectionist Model." Psychological Review 101.4 (1994): 587-607. Print. Rescorla, R. A., and P. C. Holland. "Behavioral Studies of Associative Learning in Animals." Annual Review of Psychology 33.1 (1982): 265-308. Print. Wagner, Allan R., and Edgar H. Vogel. "Configural and Elemental Processing in Associative Learning: Commentary on Melchers, Shanks and Lachnit." Behavioural Processes 77.3 (2008): 446-50. Print. REFERENCES We have collected data from 28 subjects to date, out of the planned 60. Due to limited sample size we are not yet able to assess the influence of A-B similarity on responding to B at test. When averaged across different A-B similarity conditions the data show significantly less responding to B than was observed to A at the end of phase 1 (p<10^-10, repeated measure ANOVA comparing responding to A during the last 5 trials of phase 1 to responding to B during the 5 test trials). RESULTS We calculated the predictions of various associative learning models in the “feature reversal” design. Let RA be responding to A at the end of phase one, and RB responding to B at test. Model predictions are as follows: • Rescorla & Wagner (1972): RA = RB, independent of A-B similarity • Pearce (1987): RB<RA when A-B very different, but RB>RA when A-B similar • Pearce (1994): RB>RA always, but less so with increasing A-B similarity • “Replaced elements” model: RB<RA always, but less so with increasing A-B similarity. These predictions have been obtained in our lab by computer simulation of the theories or by explicit mathematical calculation. THEORY • 60 Brooklyn College students participated in the experiment. Participants were drawn from the psychology department’s subject pool and received course credit for participating. • Participants are assigned a Dell OptiPlex 745 computer, running on a Windows XP OS, and a standard U.S. Dell keyboard. Information is displayed on a 17” Dell monitor. • The experiment is programmed with and runs on the Psychology Experiment Building Language (PEBL) software system. MATERIALS & METHODS Theories of learning aim at elucidating how organisms utilize experiences to guide behavior in similar future conditions. Here we present results from a new experimental design, dubbed “feature reversal,” aimed at contrasting several theories of associative learning: the Rescorla & Wagner (1972) model, the “replaced elements model” (REM) of Brandon et al. (2000), and the “configural model” of Pearce (1987, 1994). The experiment has two learning phases and a final test. The first phase consists of reinforced presentations of stimulus A; the second phase of unreinforced presentations of A intermixed with reinforced presentations of A together with a second stimulus B. Schematically: Phase 1: A+; Phase 2: A0, AB+ In the final test, responding to B alone is assessed – different models making different predictions. Varying the similarity between A and B further differentiates model predictions (see THEORY). We ran this experiment using colored squares as stimuli A and B, presented on a computer screen. We planned to collect data from 60 subjects, divided into three groups with varying similarity between A and B. Subjects where instructed that pressing the spacebar in response to some stimuli would cause a smiley face to appear, and that they had to learn to press solely in response to those stimuli which they thought would yield a smiley face. Thus the smiley face served to reinforce pressing the spacebar. INTRODUCTION • The background of the screen display remains gray throughout the experiment. Three different colored squares (A, B, C) measuring 50 pixels in side are presented on the screen during the experiment. The three colors are blue, red, and purple. Except for color differences, all three stimuli are the same. • A round smiley face (black circle with two black dot eyes and a black semi-circle smile on gray background) is used and displayed at the center of the screen. • In the first phase, individual stimuli are shown in the center of the screen. • During phase 2, when two stimuli are presented together on the screen, stimulus A is shown in the center and stimulus B is displayed 15 pixels to the right of A. PROCEDURE