The Elephant in the Room: Examining the Link between Food Access and Health Outcomes
•
2 gefällt mir•381 views


Empfohlen
Empfohlen
Weitere ähnliche Inhalte
Ähnlich wie The Elephant in the Room: Examining the Link between Food Access and Health Outcomes
Ähnlich wie The Elephant in the Room: Examining the Link between Food Access and Health Outcomes (20)
Mehr von Community Food Security Coalition
Mehr von Community Food Security Coalition (20)
Kürzlich hochgeladen
Kürzlich hochgeladen (20)
The Elephant in the Room: Examining the Link between Food Access and Health Outcomes
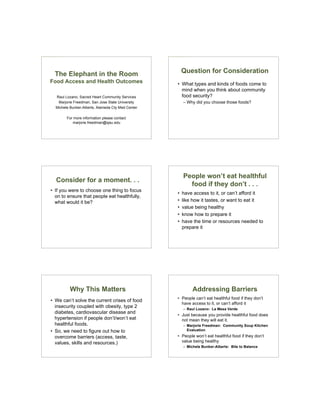
- 1. The Elephant in the Room Question for Consideration Food Access and Health Outcomes • What types and kinds of foods come to mind when you think about community Raul Lozano, Sacred Heart Community Services food security? Marjorie Freedman, San Jose State University – Why did you choose those foods? Michele Bunker-Alberts, Alameda Cty Med Center For more information please contact marjorie.freedman@sjsu.edu People won’t eat healthful Consider for a moment. . . food if they don’t . . . • If you were to choose one thing to focus • have access to it, or can’t afford it on to ensure that people eat healthfully, what would it be? • like how it tastes, or want to eat it • value being healthy • know how to prepare it • have the time or resources needed to prepare it Why This Matters Addressing Barriers • People can’t eat healthful food if they don’t • We can’t solve the current crises of food have access to it, or can’t afford it insecurity coupled with obesity, type 2 – Raul Lozano: La Mesa Verde diabetes, cardiovascular disease and • Just because you provide healthful food does hypertension if people don’t/won’t eat not mean they will eat it. healthful foods. – Marjorie Freedman: Community Soup Kitchen • So, we need to figure out how to Evaluation overcome barriers (access, taste, • People won’t eat healthful food if they don’t values, skills and resources.) value being healthy – Michele Bunker-Alberts: Bite to Balance
- 2. La Mesa Verde Mission La Mesa Verde • To foster the widespread cultivation of organic home vegetable gardens in order to encourage healthier Raul Lozano eating, build community, promote Project Founder self-sufficiency and address food Sacred Heart Community Services insecurity in San Jose/Silicon Valley La Mesa Verde La Mesa Verde Program Overview Program History • Participants receive: • In 2009-10, 100 families were enrolled – 1 or 2 raised beds – Average household density: 5.3 individuals • Number depends on sunlight, space availability at – 5% (n=5) dropped before the first planting due to home and fsmily size home loss and economic hardship – Organic soil – 95% (n=95) began the program and – A custom-built drip irrigation system received all garden materials and plants – Heirloom vegetable seeds and seedlings for a minimum of 3 consecutive planting seasons • All participants receive same plants – Staff support and garden visits for duration of enrollment and thereafter Ethnic distribution Gardening Experience of 95 people who started program of 95 people who started program
- 3. Program Participation Program Completers • 70 families (74%) completed the entire year-long program in the first year • This represents almost 400 individuals. Factors Inhibiting Program Completion Provision of Raised Beds • 166 raised beds were provided and installed in participants’ homes La Mesa Verde: Time Spent in Garden per Evaluation Week • 70 of the first 100 families completed the year-long program –81% (n=57) of these families completed the survey for this evaluation
- 4. Participant Garden Knowledge Health of Home Gardens at End Indicators of Program Average Gross Annual Savings Vegetable Consumption at per Household End of Program 91% of respondents reported increased consumption Ranked Benefits of La Mesa Verde: Participating in La Mesa Verde Conclusion • If you provide raised beds, people will garden. • When people grow food, they save money, and they eat more vegetables • When they eat more vegetables, they are . . . ??? – Health outcomes were not measured
- 5. Soup Kitchen Evaluation Community Soup Kitchen Objective Evaluation • To examine food consumption patterns among community meal center guests – Protein, starch, fruit, vegetables and bread Marjorie R. Freedman, PhD Associate Professor Dept of Nutrition, Food Science and Packaging San Jose State University Soup Kitchen Evaluation Soup Kitchen Evaluation Study Rationale Methods • There is little information about the food • Two community meal centers serving adult men & women intake patterns of soup-kitchen clients. • Convenience sample of meal recipients – Are nutritional needs being met? • 4 study days at each site with one day • Centers work on limited budgets and eliminated (7 days of data) must maximize their resources. • Tray collection post meal service Decreasing food waste will save limited – 797 total tray observations resources and stretch dollars. – Food waste by component was collected and weighed Results Results Average Total Waste Per Day (oz) Average Per Person Waste (oz) Protein Starch Fruit Vegetable Bread Total Protein Starch Fruit Vegetable Bread Total Site 1 Site 1 26.88 67.5 193.97 248.83 92.75 629.93 0.17 0.43 1.23 1.57 0.59 3.99 Men Only Men Only Site 2 : Site 2 : 8.71 31.47 32.50 41.38 10.21 124.27 0.13 0.44 0.55 0.51 0.14 1.77 Men Men Site 2: Site 2: 8.54 21.17 24.25 26.42 18.42 98.80 0.26 0.70 0.69 0.70 0.64 3.00 Women Women
- 6. Soup Kitchen Evaluation Discussion Conclusions • More food distributed to clients resulted in more overall waste. • It’s not nutrition until it’s eaten – Providing healthful foods does not ensure – Average per day food waste was 3.5 times consumption higher in site 1 vs site 2 – Choice and quantity of food served impacts • Fruits, vegetables and bread were the consumption/waste patterns main items discarded; protein was rarely – Gender differences need further examination discarded • Further research concentrating on food – Waste may be a function of palatability and preparation and menu patterns in types/kinds of foods offered and overall relation to consumption patterns is taste preferences needed Bite to Balance Program Objective • To provide socioeconomically Bite to Balance challenged families with obese pediatric patients access to Michele Bunker-Alberts, RN healthy produce on a regular Alameda County Medical Center basis in their medical home. Funded by the American Association of Nurse Practitioners Bite to Balance Bite to Balance Program Setting Program Components • An urban pediatric clinic • The Alameda County Medical Center Veggie Box Program enables employees of the (Highland Hospital Pediatric medical center to sign up and receive a fresh Clinic) in Oakland CA serving bag of locally grown fruits and vegetables either weekly or bimonthly through a local primarily underinsured families urban farm, The People’s Grocery. • Expansion provides weekly bags to families struggling with pediatric obesity.
- 7. Bite to Balance Bite to Balance Program Components Participant Selection • Train Model Neighborhood Program students in • A selected group of 15 families with a customer service skills and interview techniques • Offer low-income uninsured families skills that can child between the ages of 10 and 18 support a strategy of creating environments years old (all with a BMI > 95%) were conducive to active living and better eating. selected based on a screening tool – 3 culturally appropriate food preparation targeting low-income, motivated families demonstrations during course of project with inadequate daily fruit and vegetable – People’s Grocery food access component – Celebrate differences between pre-and-post test intake. eating habits/trends/experiences – Prepare families post-grant period to budget weekly bags, use SNAP benefits Bite to Balance Bite to Balance Program Participants and Providers Outcomes: Attitudes and Knowledge – “Carmen esta comiendo mas verduras, • Pre- and post-study educational frutas – diario,” mama de Carmen questionnaires regarding general – It’s fun! nutrition, patient dining habits and – “It’s been great as a pediatric provider to attitudes for participants receiving have a program to refer families to when boxes they are struggling with these issues. So often, we talk about them but this group was really different.” Bite to Balance Bite to Balance Health Outcomes Program Deliverable • At monthly visits, feedback was given to • Video documentary of project to be the patient’s family via a “BMI Teaching submitted post-study filmed and Tool” which tracked the patient’s BMI produced by People’s Grocery over time • Program goal: stabilized BMI in 60% of participants – Obesity labs followed at 6-month intervals – Data comparison to be complete December 2011
- 8. Bite to Balance Bite to Balance May-October 2011 May-October 2011 • Families shared increased intake of fruits • Questionnaires and vegetables (anecdotal information) • Improved access • Monthly group meetings with a nutrition • Use of SNAP benefits to continue weekly educator and a clinic dietician included bags lessons, movement, recipes, food • Basic budgeting for weekly bag preparation, and fun purchase • Labs Bite to Balance The Elephant in the Room Looking to the Future • Connecting the dots . . . • Data gathering happening now Access • Results by early 2012 • Pilot program with goal to expand in 2012 Consumption • Work towards even more access through community/food/healthcare Health Outcomes partnerships and leadership Can we talk about food security without talking about nutrition and health outcomes?