SlideShare ist ein Scribd-Unternehmen logo
1 von 8
Downloaden Sie, um offline zu lesen
Colliers GTA | Office Statistics
2011 Q2

                                                                                                                                                    Proportion of           2011 Q2              2010 Q2              Net           Net          Wgt Avg.    Wgt Avg.      Net      Currently
     Office Market /                        Buildings              Office                 Vacant              Vacancy                Available        Sublease             Availability         Availability       Absorption    Absorption     Asking Net Asking Gross New Supply    Under
                                                                           1                                        2                                            3                                                                                         5
      Submarket                 Class       Surveyed             Inventory                Space                Rate                   Space          Availability             Rate                 Rate             2011 Q2      12 Months     Rental Rates Rental Rates 2011 Q2   Construction

Central                          AAA             11                12,721,647                578,225                   4.5%           1,733,096                12.6%                13.6%                  15.7%       240,000       698,290         $28.79      $59.98          0            0
Total:                            A              186               41,969,922              2,218,458                   5.3%           3,447,172                16.5%                 8.2%                  10.5%       313,848     2,398,160         $17.85      $35.43          0            0
                                  B              497               49,124,691              2,284,366                   4.7%           3,862,801                15.6%                 7.9%                  10.1%       193,522       843,725         $12.80      $25.44          0            0
                                  C              377               14,490,705                671,879                   4.6%           1,011,802                14.7%                 7.0%                   5.3%       124,777       208,876         $13.16      $26.14          0            0
                                  All           1071              118,306,965              5,752,928                   4.9%          10,054,871                15.3%                 8.5%                  10.2%       872,147     4,149,051         $17.39      $35.04          0      644,592

Financial Core                   AAA             11                 12,721,647               578,225                   4.5%            1,733,096               12.6%                13.6%                  15.7%       240,000       382,596         $28.79      $59.98          0            0
                                  A              26                 11,547,851               718,949                   6.2%            1,085,124                7.1%                 9.4%                  12.7%        90,859       370,251         $26.03      $52.73          0            0
                                  B              48                  6,741,218               379,007                   5.6%              546,971               18.0%                 8.1%                  10.9%       110,336       124,511         $19.87      $40.75          0            0
                                  C              24                  2,607,693                63,247                   2.4%              122,566               36.7%                 4.7%                   5.8%        23,327        19,507         $18.20      $37.75          0            0
                                  All            109                33,618,409             1,739,428                   5.2%            3,487,757               12.6%                10.4%                  12.8%       464,522       896,865         $26.30      $54.19          0            0

Downtown                         AAA             11                 12,721,647               578,225                   4.5%            1,733,096               12.6%                13.6%                  15.7%       240,000       698,290         $28.79      $59.98          0            0
                                  A              109                24,606,972             1,263,978                   5.1%            1,811,548               10.1%                 7.4%                  10.1%       251,893     1,550,061         $24.01      $47.23          0            0
                                  B              237                24,942,260             1,016,358                   4.1%            1,984,926               25.2%                 8.0%                   8.5%       172,781       628,184         $18.81      $35.76          0            0
                                  C              168                 8,111,142               362,877                   4.5%              531,248               20.6%                 6.5%                   3.3%       126,542       125,067         $16.69      $30.74          0            0
                                  All            525                70,382,021             3,221,437                   4.6%            6,060,817               16.7%                 8.6%                   9.7%       791,217     3,001,602         $23.30      $46.31          0      644,592

Midtown                           A              18                  4,773,486                237,630                  5.0%              372,584               26.3%                  7.8%                 12.4%       114,524       285,922         $21.06      $41.40          0            0
                                  B              98                  9,993,081                394,745                  4.0%              608,060                5.1%                  6.1%                 12.8%        45,278       174,554         $15.11      $33.85          0            0
                                  C              97                  3,465,733                223,523                  6.4%              337,658                6.3%                  9.7%                  8.4%        -6,340        40,312         $12.85      $28.76          0            0
                                  All            213                18,232,300                855,898                  4.7%            1,318,301               11.4%                  7.2%                 11.8%       153,463       500,787         $15.90      $34.25          0            0

Central North                     A              25                  6,381,370                380,955                  6.0%             547,259                32.4%                  8.6%                 11.3%         6,047       214,947         $17.58      $37.12          0            0
                                  B              57                  4,809,806                262,185                  5.5%             379,156                 3.0%                  7.9%                  4.1%        16,704       -86,439         $13.75      $27.96          0            0
                                  C              44                    900,359                 22,480                  2.5%              28,290                 2.9%                  3.1%                  4.8%           -10         8,681          $9.29      $18.04          0            0
                                  All            126                12,091,535                665,621                  5.5%             954,705                19.8%                  7.9%                  7.9%        22,741       137,189         $15.44      $32.03          0            0

Central East                      A              34                  6,208,094               335,894                   5.4%              715,781               15.3%                11.5%                   9.8%       -58,616       347,230         $13.61      $29.57          0            0
                                  B              105                 9,379,544               611,078                   6.5%              890,660                6.9%                 9.5%                  14.6%       -41,242       127,426         $11.20      $24.86          0            0
                                  C              68                  2,013,471                62,999                   3.1%              114,606               15.1%                 5.7%                   9.2%         4,585        34,817         $12.04      $23.51          0            0
                                  All            207                17,601,109             1,009,971                   5.7%            1,721,047               10.9%                 9.8%                  12.4%       -95,273       509,473         $12.21      $26.64          0            0


Suburb                            A              238                30,614,193             2,687,840                   8.8%            4,056,943               26.8%                13.3%                  12.5%       174,320       870,586         $15.81      $29.27           0           0
Total:                            B              460                25,793,605             1,706,138                   6.6%            2,603,540               15.0%                10.1%                  10.7%       222,071       398,891         $13.32      $24.11           0           0
                                  C              355                11,905,608               819,754                   6.9%            1,196,769                7.1%                10.1%                   9.2%         3,036       332,516         $11.76      $20.14           0           0
                                  All           1053                68,313,406             5,213,733                   7.6%            7,857,252               19.9%                11.5%                  11.2%       399,427     1,601,993         $14.22      $25.84     115,546     918,266

GTA North                         A              61                  6,747,441                475,000                  7.0%              844,510               40.9%                12.5%                  12.8%       118,928       449,515         $16.97      $30.43          0            0
                                  B              109                 6,071,968                324,435                  5.3%              467,948               13.0%                 7.7%                   8.2%        98,568       273,495         $14.10      $25.03          0            0
                                  C              78                  2,606,584                164,266                  6.3%              226,991                2.1%                 8.7%                   8.2%        -6,734        70,343         $11.16      $18.38          0            0
                                  All            248                15,425,993                963,702                  6.2%            1,539,449               26.7%                10.0%                  10.2%       210,762       793,353         $14.79      $26.11          0      122,798

GTA East                          A               17                  2,476,097               376,526                 15.2%             508,916                26.8%                20.6%                  15.3%        71,651        82,619          $9.94      $20.80           0           0
                                  B               44                  2,284,151                85,220                  3.7%             185,691                11.1%                 8.1%                  13.2%          -375        17,143          $7.33      $15.16           0           0
                                  C               29                    863,179                18,085                  2.1%              30,152                 0.0%                 3.5%                   9.7%       -12,600          -145          $6.48      $22.59           0           0
                                  All             90                  5,623,427               479,831                  8.5%             724,759                21.6%                12.9%                  13.5%        58,676        99,618          $9.00      $19.26     115,546           0

GTA West                          A              160                21,390,655             1,836,314                   8.6%            2,703,517               22.4%                12.6%                  12.1%       -16,259       338,451         $16.58      $30.50          0            0
                                  B              307                17,437,486             1,296,482                   7.4%            1,949,901               15.8%                11.2%                  11.3%       123,878       108,252         $13.73      $24.78          0
                                  C              248                 8,435,845               637,404                   7.6%              939,626                8.5%                11.1%                   9.5%        22,370       262,318         $12.10      $20.52          0            0
                                  All            715                47,263,986             3,770,199                   8.0%            5,593,044               17.7%                11.8%                  11.3%       129,989       709,022         $14.73      $26.59          0      795,468


GTA                              AAA             11                12,721,647                578,225                   4.5%           1,733,096                12.6%                13.6%                  15.7%       240,000       698,290         $28.79      $59.98           0            0
Total:                            A              424               72,584,115              4,906,298                   6.8%           7,504,115                22.1%                10.3%                  11.4%       488,168     3,268,745         $16.81      $32.31           0            0
                                  B              957               74,918,296              3,990,504                   5.3%           6,466,340                15.4%                 8.6%                  10.3%       415,594     1,242,616         $13.01      $24.90           0            0
                                  C              732               26,396,313              1,491,634                   5.7%           2,208,571                10.6%                 8.4%                   7.0%       127,813       541,392         $12.37      $22.77           0            0
                                  All           2124              186,620,371             10,966,660                   5.9%          17,912,123                17.3%                 9.6%                  10.6%     1,271,574     5,751,044         $16.04      $31.13     115,546    1,562,858


Survey results presented on this report have been condensed for reference.


Notes:
1
    Office Inventory: For the purpose of this report, buildings with less than 10,000 SF of office space and buildings owned and occupied by the government have not been included in the office inventory.
2
    Vacancy Rate: The Vacancy Rate is the amount of vacant space divided by the existing building inventory base. Vacant space is available and physically unoccupied, and it includes both head lease and sublease space.
3
    Proportion of sublease availability: This ratio represents the share of available sublease space of the total available space.
4
    Availability Rate: The Availability Rate is the amount of available space divided by the building inventory base. Available space is space that is available for lease and may or may not be vacant.
5
    Average Rental Rates: Average rental rates are calculated off available spaces which also quote rental figures.
Colliers Downtown | Office Statistics
2011 Q2

                                                                                                                                                    Proportion of           2011 Q2              2010 Q2              Net           Net          Wgt Avg.    Wgt Avg.      Net      Currently
     Office Market /                        Buildings              Office                 Vacant             Vacancy                 Available        Sublease             Availability         Availability       Absorption    Absorption     Asking Net Asking Gross New Supply    Under
                                                                           1                                       2
      Submarket                 Class       Surveyed             Inventory                Space               Rate                    Space          Availability3            Rate                 Rate             2011 Q2      12 Months
                                                                                                                                                                                                                                                           5
                                                                                                                                                                                                                                               Rental Rates Rental Rates 2011 Q2   Construction

Financial Core                   AAA                      11        12,721,647               578,225                   4.5%            1,733,096               12.6%                 13.6%                 15.7%       240,000       698,290         $28.79      $59.98          0            0
                                  A                       26        11,547,851               718,949                   6.2%            1,085,124                7.1%                  9.4%                 12.7%        90,859       423,031         $26.03      $52.73          0            0
                                  B                       48         6,741,218               379,007                   5.6%              546,971               18.0%                  8.1%                 10.9%       110,336       383,883         $19.87      $40.75          0            0
                                  C                       24         2,607,693                63,247                   2.4%              122,566               36.7%                  4.7%                  5.8%        23,327        55,259         $18.20      $37.75          0            0
                                  All                    109        33,618,409             1,739,428                   5.2%            3,487,757               12.6%                 10.4%                 12.8%       464,522     1,560,464         $26.30      $54.19          0            0

Downtown East                     A                       22          1,101,378                46,978                 4.3%               55,017                57.9%                  5.0%                  6.2%          -557        37,870         $16.61      $35.53          0            0
                                  B                       52          1,907,970               123,983                 6.5%              198,749                 3.7%                 10.4%                 12.0%        52,984        88,888         $20.99      $31.82          0            0
                                  C                       36            915,464                92,904                10.1%              132,658                 3.6%                 14.5%                 13.7%        46,316        75,508         $15.80      $24.13          0            0
                                  All                    110          3,924,812               263,865                 6.7%              386,423                11.4%                  9.8%                 10.7%        98,743       202,265         $18.76      $29.20          0            0

Downtown North                    A                       13         5,641,211                233,573                  4.1%             269,685                 9.1%                  4.8%                 6.1%         31,003       150,599         $23.00      $43.02          0            0
                                  B                       28         6,481,619                132,605                  2.0%             217,186                24.2%                  3.4%                 3.7%         22,835        21,583         $16.49      $36.16          0            0
                                  C                       33         2,595,629                 83,631                  3.2%             107,135                 0.0%                  4.1%                 5.0%          5,800       -57,068         $16.87      $35.88          0            0
                                  All                     74        14,718,459                449,809                  3.1%             594,006                13.0%                  4.0%                 4.8%         59,639       115,114         $19.65      $39.35          0            0

Downtown South                    A                        6          2,270,654                34,581                 1.5%               44,192                29.3%                  1.9%                  5.9%        35,908       722,014         $31.00      $53.90          0            0
                                  B                        5          1,271,110                97,966                 7.7%              175,289                77.2%                 13.8%                 12.1%        17,718       -47,644         $15.00      $29.31          0            0
                                  C                        7            273,699                56,840                20.8%               56,840               100.0%                 20.8%                  1.7%        11,900       -56,840         $13.25      $18.82          0            0
                                  All                     18          3,815,463               189,387                 5.0%              276,321                74.2%                  7.2%                  7.9%        65,526       617,530         $22.02      $40.09          0      644,952

Downtown West                     A                       42         4,045,878                229,897                  5.7%              357,530               10.2%                  8.8%                 11.3%        94,681       216,547         $18.28      $33.38          0            0
                                  B                      104         8,540,343                282,796                  3.3%              846,732               24.3%                  9.9%                  9.2%       -31,092       181,474         $18.24      $33.75          0            0
                                  C                       68         1,718,657                 66,255                  3.9%              112,049                2.6%                  6.5%                  7.1%        39,199       108,208         $16.47      $28.48          0            0
                                  All                    214        14,304,878                578,948                  4.0%            1,316,310               18.6%                  9.2%                  9.6%       102,788       506,229         $18.07      $33.10          0            0


Downtown                         AAA                      11        12,721,647               578,225                   4.5%            1,733,096               12.6%                 13.6%                 15.7%       240,000       698,290         $28.79      $59.98          0            0
Total:                            A                      109        24,606,972             1,263,978                   5.1%            1,811,548               10.1%                  7.4%                 10.1%       251,893     1,550,061         $24.01      $47.23          0            0
                                  B                      237        24,942,260             1,016,358                   4.1%            1,984,926               25.2%                  8.0%                  8.5%       172,781       628,184         $18.81      $35.76          0            0
                                  C                      168         8,111,142               362,877                   4.5%              531,248               20.6%                  6.5%                  6.5%       126,542       125,067         $16.69      $30.74          0            0
                                  All                    525        70,382,021             3,221,437                   4.6%            6,060,817               16.7%                  8.6%                 10.1%       791,217     3,001,602         $23.30      $46.31          0      644,952


Survey results presented on this report have been condensed for reference.


Notes:
1
    Office Inventory: For the purpose of this report, buildings with less than 10,000 SF of office space and buildings owned and occupied by the government have not been included in the office inventory.
2
    Vacancy Rate: The Vacancy Rate is the amount of vacant space divided by the existing building inventory base. Vacant space is available and physically unoccupied, and it includes both head lease and sublease space.
3
    Proportion of Sublease Availability: This ratio represents the share of available sublease space of the total available space.
4
    Availability Rate: The Availability Rate is the amount of available space divided by the building inventory base. Available space is space that is available for lease and may or may not be vacant.
5
    Average Rental Rates: Average rental rates are calculated off available spaces which also quote rental figures.
Colliers Midtown | Office Statistics
2011 Q2

                                                                                                                                                    Proportion of           2011 Q2              2010 Q2               Net           Net          Wgt Avg.    Wgt Avg.      Net      Currently
     Office Market /                        Buildings              Office                Vacant              Vacancy                 Available        Sublease             Availability         Availability        Absorption    Absorption     Asking Net Asking Gross New Supply    Under
                                                                           1                                       2                                             3                                                                                          5
      Submarket                Class        Surveyed             Inventory               Space                Rate                    Space          Availability             Rate                 Rate              2011 Q2      12 Months     Rental Rates Rental Rates 2011 Q2   Construction

Yonge-Bloor                       A                        8         2,656,355               157,728                   5.9%             230,973                17.7%                 8.7%                  10.6%         43,245        78,144         $22.83      $42.83          0            0
                                  B                       37         5,583,452               114,206                   2.0%             166,260                 2.4%                 3.0%                   3.5%          2,174       109,698         $15.56      $36.20          0            0
                                  C                       29         1,393,195               110,742                   7.9%             198,713                10.7%                14.3%                  11.2%         -4,450        16,234         $12.97      $30.59          0            0
                                  All                     74         9,633,002               382,676                   4.0%             595,946                11.1%                 6.2%                   6.6%         40,969       204,077         $17.51      $36.90          0            0

Yonge-St.Clair                    A                        4           798,771                 4,131                   0.5%              32,691                35.7%                  4.1%                 10.0%         27,778        68,443         $19.17      $41.91          0            0
                                  B                       19         1,586,172               102,060                   6.4%             134,966                 1.9%                  8.5%                  9.4%         22,593       -32,767         $15.68      $33.05          0            0
                                  C                       13           234,401                 1,523                   0.6%               3,843                 0.0%                  1.6%                  1.6%          1,523         1,523         $16.09      $32.74          0            0
                                  All                     36         2,619,344               107,714                   4.1%             171,500                 8.3%                  6.5%                  7.9%         51,894        37,198         $16.35      $34.73          0            0

Yonge-Eglinton                    A                        6         1,318,360                75,770                   5.7%             108,919                41.6%                 8.3%                  17.0%         43,501       139,334         $16.38      $36.97          0            0
                                  B                       28         2,535,072               153,794                   6.1%             282,149                 8.8%                11.1%                   9.3%          9,451        75,837         $14.55      $32.94          0            0
                                  C                       24           893,279                78,516                   8.8%              98,235                 0.0%                11.0%                  11.3%         -2,557        -4,142         $12.99      $27.36          0            0
                                  All                     58         4,746,711               308,080                   6.5%             489,304                14.3%                10.3%                  12.0%         50,395       211,029         $14.64      $32.72          0            0

Toronto West                      A                        0                 0                      0                  0.0%                   0                  0.0%                 0.0%                   0.0%             0             0          $0.00       $0.00          0            0
                                  B                       14           288,385                 24,685                  8.6%              24,685                  0.0%                 8.6%                 243.9%        11,060        21,786         $15.00      $32.09          0            0
                                  C                       31           944,858                 32,743                  3.5%              36,866                  0.0%                 3.9%                   6.1%          -855        26,696         $11.54      $23.29          0            0
                                  All                     45         1,233,243                 57,428                  4.7%              61,551                  0.0%                 5.0%                  59.6%        10,205        48,483         $12.93      $26.82          0            0


Midtown                           A                      18          4,773,486               237,629                   5.0%              372,584               26.3%                  7.8%                 12.4%        114,524       285,922         $21.06      $41.40          0            0
Total:                            B                      98          9,993,081               394,745                   4.0%              608,060                5.1%                  6.1%                 12.8%         45,278       174,554         $15.11      $33.85          0            0
                                  C                      97          3,465,733               223,523                   6.4%              337,658                6.3%                  9.7%                  8.4%         -6,340        40,312         $12.85      $28.76          0            0
                                  All                   213         18,232,300               855,898                   4.7%            1,318,301               11.4%                  7.2%                 11.8%        153,463       500,787         $15.90      $34.25          0            0


Survey results presented on this report have been condensed for reference.


Notes:
1
    Office Inventory: For the purpose of this report, buildings with less than 10,000 SF of office space and buildings owned and occupied by the government have not been included in the office inventory.
2
    Vacancy Rate: The Vacancy Rate is the amount of vacant space divided by the existing building inventory base. Vacant space is available and physically unoccupied, and it includes both head lease and sublease space.
3
    Proportion of Sublease Availability: This ratio represents the share of available sublease space of the total available space.
4
    Availability Rate: The Availability Rate is the amount of available space divided by the building inventory base. Available space is space that is available for lease and may or may not be vacant.
5
    Average Rental Rates: Average rental rates are calculated off available spaces which also quote rental figures.
Colliers Central East | Office Statistics
2011 Q2

                                                                                                                                                    Proportion of           2011 Q2              2010 Q2              Net           Net          Wgt Avg.    Wgt Avg.      Net      Currently
     Office Market /                        Buildings              Office                 Vacant             Vacancy                 Available        Sublease             Availability         Availability       Absorption    Absorption     Asking Net Asking Gross New Supply    Under
                                                                           1                                       2                                             3                                                                                         5
      Submarket                 Class       Surveyed             Inventory                Space               Rate                    Space          Availability             Rate                 Rate             2011 Q2      12 Months     Rental Rates Rental Rates 2011 Q2   Construction

Don Mills - Eglinton              A                        6          1,082,940                19,959                  1.8%              45,717                  0.0%                 4.2%                  2.6%             0        78,605         $12.56      $29.06          0            0
                                  B                       38          3,788,141               258,380                  6.8%             319,637                  2.2%                 8.4%                 19.2%       -33,426       -67,532         $11.32      $26.02          0            0
                                  C                       25            558,322                     0                  0.0%              26,340                  0.0%                 4.7%                  4.7%         5,970        23,623         $11.00      $25.02          0            0
                                  All                     69          5,429,403               278,339                  5.1%             391,694                  1.8%                 7.2%                 14.6%       -27,456        34,696         $11.44      $26.31          0            0

Duncan Mill                       A                        3            528,307                 9,917                  1.9%              20,504                49.6%                  3.9%                  7.0%        -3,520       245,610         $14.00      $28.46          0            0
                                  B                       20          1,405,763                92,187                  6.6%             123,386                34.2%                  8.8%                  4.4%             0        42,143          $8.71      $22.90          0            0
                                  C                       15            374,146                 1,560                  0.4%              26,827                64.4%                  7.2%                 21.0%        -8,860          -413         $11.43      $26.12          0            0
                                  All                     38          2,308,216               103,664                  4.5%             170,716                40.8%                  7.4%                  7.2%       -12,380       287,340          $9.77      $24.07          0            0

Consumer Road                     A                        6          1,302,553                94,114                 7.2%              219,665                  7.5%                16.9%                 16.8%       -15,679        -1,359         $13.96      $31.41          0            0
                                  B                       16          1,972,881               183,941                 9.3%              325,039                  3.6%                16.5%                 20.1%       -12,541        31,553         $11.91      $26.33          0            0
                                  C                        8            473,993                48,789                10.3%               48,789                  0.0%                10.3%                 12.7%          -475         3,657         $13.86      $23.07          0            0
                                  All                     30          3,749,427               326,844                 8.7%              593,494                  4.8%                15.8%                 18.1%       -28,695        33,851         $12.83      $27.94          0            0

Woodbine Steeles                  A                       16          3,028,644               211,905                  7.0%             429,895                19.3%                 14.2%                 10.8%       -39,418        24,374         $13.52      $28.59          0            0
                                  B                       19          1,340,827                71,137                  5.3%              87,166                 0.0%                  6.5%                 11.6%         4,726        89,600         $10.12      $20.30          0            0
                                  C                       15            391,131                 5,600                  1.4%               5,600                 0.0%                  1.4%                  0.8%             0             0          $8.50      $19.40          0            0
                                  All                     50          4,749,602               288,642                  6.1%             522,661                15.9%                 11.0%                 10.3%       -34,692       113,974         $12.90      $27.11          0            0

Toronto East                      A                        3            265,650                     0                  0.0%                   0                  0.0%                 0.0%                  0.0%             0             0          $0.00       $0.00          0            0
                                  B                       12            871,932                 5,433                  0.6%              35,433                  0.0%                 4.1%                  3.5%             0        31,662         $12.35      $17.44          0            0
                                  C                        5            215,879                 7,050                  3.3%               7,050                  0.0%                 3.3%                 10.3%         7,950         7,950          $7.00      $20.70          0            0
                                  All                     20          1,353,461                12,483                  0.9%              42,483                  0.0%                 3.1%                  3.5%         7,950        39,612         $11.46      $17.98          0            0


Central East                      A                       34         6,208,094               335,894                   5.4%              715,781               15.3%                 11.5%                  9.8%       -58,616       347,230         $13.61      $29.57          0            0
Area                              B                      105         9,379,544               611,078                   6.5%              890,660                6.9%                  9.5%                 14.6%       -41,242       127,426         $11.20      $24.86          0            0
Total:                            C                       68         2,002,471                62,999                   3.1%              114,606               15.1%                  5.7%                  9.2%         4,585        34,817         $12.04      $23.51          0            0
                                  All                    207        17,590,109             1,009,971                   5.7%            1,721,047               10.9%                  9.8%                 12.4%       -95,273       509,473         $12.21      $26.64          0            0


Survey results presented on this report have been condensed for reference.


Notes:
1
    Office Inventory: For the purpose of this report, buildings with less than 10,000 SF of office space and buildings owned and occupied by the government have not been included in the office inventory.
2
    Vacancy Rate: The Vacancy Rate is the amount of vacant space divided by the existing building inventory base. Vacant space is available and physically unoccupied, and it includes both head lease and sublease space.
3
    Proportion of Sublease Availability: This ratio represents the share of available sublease space of the total available space.
4
    Availability Rate: The Availability Rate is the amount of available space divided by the building inventory base. Available space is space that is available for lease and may or may not be vacant.
5
    Average Rental Rates: Average rental rates are calculated off available spaces which also quote rental figures.
Colliers Central North | Office Statistics
2011 Q2

                                                                                                                                                     Proportion of            2011 Q2              2010 Q2            Net              Net          Wgt Avg.         Wgt Avg.         Net            Currently
      Office Market /                        Buildings               Office               Vacant              Vacancy                Available          Sublease            Availability         Availability      Absorption       Absorption     Asking Net       Asking Gross   New Supply          Under
                                                                               1                                       2                                            3                                                                                           5
       Submarket                Class        Surveyed             Inventory               Space                 Rate                  Space           Availability              Rate                 Rate           2011 Q2         12 Months     Rental Rates      Rental Rates    2011 Q2         Construction


Yorkdale                          A                        2           317,281                      0                  0.0%                    0                 0.0%                  0.0%                 0.5%                0        13,560           $0.00            $0.00                0                0
                                  B                       13         1,163,783                  9,950                  0.9%               20,929                 0.0%                  1.8%                 2.2%            5,200        15,000           $9.00           $25.37                0                0
                                  C                       13           306,220                 17,800                  5.8%               23,610                 3.4%                  7.7%                13.1%            1,000        20,800           $9.00           $17.08                0                0
                                  All                     28         1,787,284                 27,750                  1.6%               44,539                 1.8%                  2.5%                 3.7%            6,200        49,360           $9.00           $20.98                0                0

Dufferin Finch                    A                        0                 0                     0                  0.0%                    0                  0.0%                0.0%                   0.0%             0                0          $0.00             $0.00                0                0
                                  B                       17         1,109,157               192,511                 17.4%              208,338                  0.0%               18.8%                   1.8%           788         -165,552         $12.25            $23.94                0                0
                                  C                       15           301,078                 3,400                  1.1%                3,400                  0.0%                1.1%                   1.0%        -2,200            6,505          $7.95            $18.13                0                0
                                  All                     32         1,410,235               195,911                 13.9%              211,738                  0.0%               15.0%                   1.6%        -1,412         -159,047         $12.18            $23.85                0                0

North Yonge                       A                       23         6,064,089               380,955                   6.3%             547,259                32.4%                   9.0%                11.9%         6,047          201,387         $17.58            $37.12                0                0
Corridor                          B                       27         2,536,866                59,725                   2.4%             149,888                 7.5%                   5.9%                 5.9%        10,716           64,113         $16.72            $34.40                0                0
                                  C                       16           293,061                 1,280                   0.4%               1,280                 0.0%                   0.4%                 0.0%         1,190          -18,624         $18.00            $35.00                0                0
                                  All                     66         8,894,016               441,960                   5.0%             698,428                27.0%                   7.9%                 9.8%        17,953          246,876         $17.40            $36.53                0                0


Central North                     A                      25          6,381,370               380,955                   6.0%             547,259                32.4%                   8.6%                11.3%         6,047          214947          $17.58            $37.12                0                0
Area                              B                      57          4,809,806               262,185                   5.5%             379,156                 3.0%                   7.9%                 4.1%        16,704          -86439          $13.75            $27.96                0                0
Total:                            C                      44            900,359                22,480                   2.5%              28,290                 2.9%                   3.1%                 4.8%           -10            8681           $9.29            $18.04                0                0
                                  All                   126         12,091,535               665,621                   5.5%             954,705                19.8%                   7.9%                 7.9%        22,741          137189          $15.44            $32.03                0                0


Survey results presented on this report have been condensed for reference.


Notes:
1
    Office Inventory: For the purpose of this report, buildings with less than 10,000 SF of office space and buildings owned and occupied by the government have not been included in the office inventory.
2
    Vacancy Rate: The Vacancy Rate is the amount of vacant space divided by the existing building inventory base. Vacant space is available and physically unoccupied, and it includes both head lease and sublease space.
3
    Proportion of Sublease Availability: This ratio represents the share of available sublease space of the total available space.
4
    Availability Rate: The Availability Rate is the amount of available space divided by the building inventory base. Available space is space that is available for lease and may or may not be vacant.
5
    Average Rental Rates: Average rental rates are calculated off available spaces which also quote rental figures.
Colliers GTA East | Office Statistics
2011 Q2

                                                                                                                                                     Proportion             2011 Q2              2010 Q2              Net           Net          Wgt Avg.    Wgt Avg.      Net      Currently
     Office Market /                        Buildings              Office                Vacant              Vacancy                 Available       of Sublease           Availability         Availability       Absorption    Absorption     Asking Net Asking Gross New Supply    Under
                                                                           1                                       2                                             3                                                                                         5
      Submarket                Class        Surveyed             Inventory               Space                Rate                    Space          Availability             Rate                 Rate             2011 Q2      12 Months     Rental Rates Rental Rates 2011 Q2   Construction

Scarborough                       A                        6         1,488,002               278,497                 18.7%              409,187                33.3%                27.5%                  20.1%             0        20,568         $14.20      $30.73          0            0
Town Centre                       B                       30         1,765,570                81,641                  4.6%              158,620                 6.9%                 9.0%                  13.8%          -375         9,751         $12.94      $27.35          0            0
                                  C                       23           676,559                18,085                  2.7%               30,152                 0.0%                 4.5%                  12.1%       -12,600        12,455          $6.48      $22.59          0            0
                                  All                     59         3,930,131               378,223                  9.6%              597,959                24.6%                15.2%                  15.8%       -12,975        30,175         $13.48      $29.42          0            0

Pickering Oshawa                  A                       11           988,095                98,029                   9.9%              99,729                 0.0%                10.1%                  0.0%         71,651        62,051         $15.54      $29.77           0           0
                                  B                       14           518,581                 3,580                   0.7%              27,071                35.5%                 5.2%                  0.0%              0         7,392         $14.51      $25.02           0           0
                                  C                        6           186,620                     0                   0.0%                   0                 0.0%                 0.0%                  0.0%              0             0          $0.00       $0.00           0           0
                                  All                     31         1,693,296               101,609                   6.0%             126,800                 7.6%                 7.5%                  7.6%         71,651        69,443         $15.32      $28.75     115,546           0


GTA East                           A                      17         2,476,097               376,526                 15.2%              508,916                26.8%                20.6%                  15.3%        71,651        82,619          $9.94      $20.80           0           0
Area                               B                      44         2,284,151                85,220                  3.7%              185,691                11.1%                 8.1%                  13.2%          -375        17,143          $7.33      $15.16           0           0
Total:                             C                      29           863,179                18,085                  2.1%               30,152                 0.0%                 3.5%                   9.7%       -12,600        12,455          $6.48      $22.59           0           0
                                  All                     90         5,623,427               479,831                  8.5%              724,759                21.6%                12.9%                  13.5%        58,676        99,618          $9.13      $19.43     115,546           0


Survey results presented on this report have been condensed for reference.


Notes:
1
    Office Inventory: For the purpose of this report, buildings with less than 10,000 SF of office space and buildings owned and occupied by the government have not been included in the office inventory.
2
    Vacancy Rate: The Vacancy Rate is the amount of vacant space divided by the existing building inventory base. Vacant space is available and physically unoccupied, and it includes both head lease and sublease space.
3
    Proportion of Sublease Availability: This ratio represents the share of available sublease space of the total available space.
4
    Availability Rate: The Availability Rate is the amount of available space divided by the building inventory base. Available space is space that is available for lease and may or may not be vacant.
5
    Average Rental Rates: Average rental rates are calculated off available spaces which also quote rental figures.
Colliers GTA North | Office Statistics
2011 Q2

                                                                                                                                                    Proportion of           2011 Q2              2010 Q2              Net           Net          Wgt Avg.    Wgt Avg.      Net      Currently
     Office Market /                        Buildings              Office                Vacant              Vacancy                 Available        Sublease             Availability         Availability       Absorption    Absorption     Asking Net Asking Gross New Supply    Under
                                                                           1                                       2                                             3                                                                                         5
      Submarket                Class        Surveyed             Inventory               Space                Rate                    Space          Availability             Rate                 Rate             2011 Q2      12 Months     Rental Rates Rental Rates 2011 Q2   Construction

Vaughan                           A                       14           778,564                  3,969                  0.5%               3,969                 0.0%                  0.5%                 0.0%              0       132,861         $18.00      $25.42          0            0
                                  B                       31         1,449,195                 23,559                  1.6%              87,937                21.4%                  6.1%                 5.0%         44,031        62,136         $14.40      $24.58          0            0
                                  C                       15           530,069                 11,440                  2.2%              30,266                 0.0%                  5.7%                 5.1%              0        -5,200         $15.96      $25.30          0            0
                                  All                     60         2,757,828                 38,968                  1.4%             122,171                15.4%                  4.4%                 5.9%         44,031       189,797         $14.99      $24.82          0       63,515

Richmond Hill                     A                        3            462,205                      0                 0.0%                    0                 0.0%                 0.0%                 0.0%              0         9,982          $0.00       $0.00          0            0
                                  B                        7            235,022                  6,852                 2.9%                9,036                 0.0%                 3.8%                 0.0%            904         5,407         $12.85      $24.62          0            0
                                  C                        2             40,000                      0                 0.0%                    0                 0.0%                 0.0%                 0.0%              0             0          $0.00       $0.00          0            0
                                  All                     12            737,227                  6,852                 0.9%                9,036                 0.0%                 1.2%                 0.6%            904        15,389         $12.85      $24.62          0       59,283

Hwy404-Hwy407                     A                      33          4,220,288               336,763                   8.0%              635,517               39.8%                15.1%                   0.0%       119,656       310,341         $17.95      $31.91          0            0
                                  B                      47          2,602,315               238,922                   9.2%              256,757                0.5%                 9.9%                  12.8%        33,409       152,320         $14.55      $26.04          0            0
                                  C                      46          1,624,301                76,315                   4.7%              117,963                4.1%                 7.3%                   7.0%        -9,359        65,763         $10.91      $18.29          0            0
                                  All                   126          8,446,904               651,999                   7.7%            1,010,237               25.7%                12.0%                  13.2%       143,706       528,423         $15.73      $27.86          0            0

Markham                           A                       11         1,286,384               134,269                 10.4%              205,025                45.0%                15.9%                  11.0%          -728        -3,669         $13.59      $25.56          0            0
Town Centre                       B                       24         1,785,436                55,103                  3.1%              114,218                35.7%                 6.4%                   5.2%        20,225        53,633         $12.40      $22.02          0            0
                                  C                       15           412,214                76,512                 18.6%               78,762                 0.0%                19.1%                  17.2%         2,625         9,780          $9.67      $15.84          0            0
                                  All                     50         3,484,034               265,883                  7.6%              398,004                33.4%                11.4%                   8.8%        22,122        59,744         $12.09      $21.69          0            0


GTA North                         A                      61          6,747,441               475,000                   7.0%              844,510               40.9%                12.5%                  12.8%       118,928       449,515         $16.97      $30.43          0            0
Total:                            B                     109          6,071,968               324,435                   5.3%              467,948               13.0%                 7.7%                   8.2%        98,568       273,495         $14.10      $25.03          0            0
                                  C                      78          2,606,584               164,266                   6.3%              226,991                2.1%                 8.7%                   8.2%        -6,734        70,343         $11.16      $18.38          0            0
                                  All                   248         15,425,993               963,702                   6.2%            1,539,449               26.7%                10.0%                  10.3%       210,762       793,353         $14.79      $26.11          0      122,798


Survey results presented on this report have been condensed for reference.


Notes:
1
    Office Inventory: For the purpose of this report, buildings with less than 10,000 SF of office space and buildings owned and occupied by the government have not been included in the office inventory.
2
    Vacancy Rate: The Vacancy Rate is the amount of vacant space divided by the existing building inventory base. Vacant space is available and physically unoccupied, and it includes both head lease and sublease space.
3
    Proportion of Sublease Availability: This ratio represents the share of available sublease space of the total available space.
4
    Availability Rate: The Availability Rate is the amount of available space divided by the building inventory base. Available space is space that is available for lease and may or may not be vacant.
5
    Average Rental Rates: Average rental rates are calculated off available spaces which also quote rental figures.
Colliers GTA West | Office Statistics
2011 Q2

                                                                                                                                                    Proportion of           2011 Q2              2010 Q2              Net           Net          Wgt Avg.    Wgt Avg.      Net      Currently
     Office Market /                        Buildings              Office                Vacant              Vacancy                 Available        Sublease             Availability         Availability       Absorption    Absorption     Asking Net Asking Gross New Supply    Under
                                                                           1                                       2                                             3                                                                                         5
      Submarket                Class        Surveyed             Inventory               Space                Rate                    Space          Availability             Rate                 Rate             2011 Q2      12 Months     Rental Rates Rental Rates 2011 Q2   Construction

Airport                           A                       21         2,513,567               491,570                 19.6%               594,159               23.9%                23.6%                  25.8%       103,745       287,880         $18.60      $32.01          0            0
Corporate Centre                  B                       27         1,863,486               191,287                 10.3%               293,222               43.5%                15.7%                   8.5%        16,617       -66,668         $14.54      $28.10          0            0
                                  C                       31         1,383,218               226,860                 16.4%               318,462               14.5%                23.0%                   2.4%        -6,938       -15,520         $14.59      $23.22          0            0
                                  All                     79         5,760,271               909,717                 15.8%             1,205,843               26.2%                20.9%                  14.7%       113,424       205,692         $16.56      $28.74          0            0

Airport East                      A                        8           957,966               123,495                 12.9%              266,411                16.1%                27.8%                  27.3%        29,230        63,728         $15.08      $29.93          0            0
                                  B                       34         2,221,265               363,603                 16.4%              534,325                15.2%                24.1%                  26.4%       134,068       171,574         $12.45      $24.43          0            0
                                  C                       27           985,197                68,748                  7.0%               80,839                10.1%                 8.2%                  12.5%         3,970        35,000          $9.98      $18.57          0            0
                                  All                     69         4,164,428               555,845                 13.3%              881,575                15.0%                21.2%                  23.4%       167,268       270,302         $13.02      $25.56          0            0

Airport West                      A                       21         2,613,606                 49,783                  1.9%              87,267                15.3%                  3.3%                  3.3%             0        23,808         $13.07      $24.80          0            0
                                  B                       27         1,458,228                 30,836                  2.1%              54,736                 0.0%                  3.8%                  2.0%         1,170         4,171         $11.93      $21.88          0            0
                                  C                       11           339,719                 18,624                  5.5%              26,964                 0.0%                  7.9%                 16.3%        32,891        98,261          $7.81      $16.38          0            0
                                  All                     59         4,411,553                 99,243                  2.2%             168,968                 7.9%                  3.8%                  4.5%        34,061       126,241         $11.86      $22.51          0            0

Brampton                          A                       13           742,916                73,473                  9.9%              107,810                30.1%                14.5%                   4.1%         1,831        36,780         $16.92      $28.10          0            0
                                  B                       13         1,658,846                32,806                  2.0%               92,806                 0.0%                 5.6%                   0.2%             0             0         $12.70      $18.80          0            0
                                  C                        5           107,426                13,365                 12.4%               13,365                 0.0%                12.4%                  49.2%        16,214        16,709         $12.00      $23.75          0            0
                                  All                     31         2,509,188               119,644                  4.8%              213,981                15.1%                 8.5%                   3.5%        18,045        53,489         $14.78      $23.80          0            0

Burlington                        A                       19         1,754,171               149,400                   8.5%             225,814                27.2%                12.9%                  16.3%        -2,058        47,543         $17.42      $28.55          0            0
                                  B                       36         1,499,965                84,509                   5.6%             117,584                12.1%                 7.8%                   8.9%        36,325        11,431         $13.55      $22.01          0            0
                                  C                       29         1,048,162                50,735                   4.8%             104,556                 4.9%                10.0%                   8.8%         9,105        31,401         $11.23      $17.00          0            0
                                  All                     84         4,302,298               284,644                   6.6%             447,954                18.0%                10.4%                  12.0%        43,372        90,375         $14.96      $24.14          0            0

Cooksville                        A                        5           664,087                  9,356                  1.4%              20,156                27.8%                  3.0%                  3.2%         3,726         7,992         $15.58      $29.31          0            0
                                  B                       19           831,027                 57,642                  6.9%              57,642                 6.4%                  6.9%                  6.2%             0        12,058         $15.48      $26.01          0            0
                                  C                       13           323,292                 29,652                  9.2%              29,652                 0.0%                  9.2%                 10.1%         3,776        10,240          $7.00      $18.00          0            0
                                  All                     37         1,818,406                 96,650                  5.3%             107,450                 8.7%                  5.9%                  5.8%         7,502        30,291         $13.16      $24.42          0            0

Hwy401                            A                        9         1,763,830               132,265                   7.5%             239,696                24.9%                13.6%                  15.6%       -54,781       -78,583         $13.21      $25.29          0            0
Hurontario                        B                       12           743,944                32,597                   4.4%              42,350                 0.0%                 5.7%                   7.3%         4,876       -11,136         $11.62      $22.71          0            0
                                  C                       17           756,939                 8,320                   1.1%              27,036                24.7%                 3.6%                   4.4%        -8,320        12,127         $10.18      $19.87          0            0
                                  All                     38         3,264,713               173,182                   5.3%             309,082                21.5%                 9.5%                  11.1%       -58,225       -77,592         $12.73      $24.46          0            0

Hwy427                            A                       14         2,361,188               259,659                 11.0%              306,785                10.0%                13.0%                   8.1%      -155,302      -283,525         $14.58      $30.95          0            0
Bloor-Islington                   B                       34         1,555,926               121,154                  7.8%              135,570                 0.0%                 8.7%                  11.8%      -127,198      -102,086         $10.72      $23.99          0            0
                                  C                       25           638,776                11,867                  1.9%               50,905                 0.0%                 8.0%                   3.5%        -2,696        46,202          $8.54      $20.91          0            0
                                  All                     73         4,555,890               392,680                  8.6%              493,260                 6.2%                10.8%                   8.7%      -285,197      -339,409         $12.89      $28.00          0            0

Mississauga                       A                       14         3,002,934               232,663                   7.7%             449,339                16.5%                15.0%                  10.6%        34,438        95,481         $16.92      $33.02          0            0
City Centre                       B                        9           530,735                 7,561                   1.4%              13,691                44.8%                 2.6%                   4.0%         5,302        22,770         $13.50      $23.09          0            0
                                  C                       13           225,898                     0                   0.0%               4,581                 0.0%                 2.0%                   0.0%         1,456          -456         $14.00      $23.49          0            0
                                  All                     36         3,759,567               240,224                   6.4%             467,611                17.1%                12.4%                   9.0%        41,196       117,795         $16.79      $32.63          0            0

Meadowvale                        A                      18          3,221,780               132,352                  4.1%              211,352                60.8%                 6.6%                   5.1%        35,435        78,065         $18.17      $33.06          0            0
                                  B                      41          2,433,725               288,065                 11.8%              386,009                17.4%                15.9%                  16.6%        15,836       -16,697         $15.48      $26.31          0            0
                                  C                      41          1,609,387               164,107                 10.2%              200,084                 6.3%                12.4%                  15.2%       -13,641        35,133         $11.88      $18.34          0            0
                                  All                   100          7,264,892               584,524                  8.0%              797,445                26.1%                11.0%                  11.4%        37,630        96,501         $15.29      $26.10          0      375,000

Sheridan Winston                  A                        4           347,676                      0                  0.0%                   0                  0.0%                 0.0%                 14.7%             0        73,679          $0.00       $0.00          0            0
                                  B                       21         1,254,260                 15,180                  1.2%              21,480                  0.0%                 1.7%                  7.1%        13,810        18,032         $11.50      $22.06          0            0
                                  C                       13           439,916                  2,562                  0.6%               7,627                  0.0%                 1.7%                 10.7%        -6,475         -2562         $11.25      $16.22          0            0
                                  All                     38         2,041,852                 17,742                  0.9%              29,107                  0.0%                 1.4%                  9.1%         7,335         89149         $11.43      $20.53          0            0

Oakville                          A                       14         1,446,934               182,297                 12.6%              194,728                  7.4%               13.5%                  15.5%       -12,521       -14,398         $18.96      $30.74          0            0
                                  B                       34         1,386,079                71,244                  5.1%              200,487                  4.0%               14.5%                  17.0%        23,072        64,803         $16.59      $26.43          0            0
                                  C                       23           577,915                42,563                  7.4%               75,554                  1.5%               13.1%                   8.9%        -6,973         -4216         $13.34      $24.80          0            0
                                  All                     71         3,410,928               296,104                  8.7%              470,769                  5.0%               13.8%                  15.0%         3,578         46189         $17.05      $27.95          0      420,468


GTA West                          A                     160         21,390,655             1,836,314                   8.6%            2,703,517               22.4%                12.6%                  12.1%       -16,259       338,451         $16.58      $30.50          0            0
Total:                            B                     307         17,437,486             1,296,482                   7.4%            1,949,901               15.8%                11.2%                  11.3%       123,878       108,252         $13.73      $24.78          0            0
                                  C                     248          8,435,845               637,404                   7.6%              939,626                8.5%                11.1%                   9.5%        22,370       262,318         $12.10      $20.52          0            0
                                  All                   715         47,263,986             3,770,199                   8.0%            5,593,044               17.7%                11.8%                  11.3%       129,989       709,021         $14.73      $26.59          0      795,468


Survey results presented on this report have been condensed for reference.


Notes:
1
    Office Inventory: For the purpose of this report, buildings with less than 10,000 SF of office space and buildings owned and occupied by the government have not been included in the office inventory.
2
    Vacancy Rate: The Vacancy Rate is the amount of vacant space divided by the existing building inventory base. Vacant space is available and physically unoccupied, and it includes both head lease and sublease space.
3
    Proportion of Sublease Availability: This ratio represents the share of available sublease space of the total available space.
4
    Availability Rate: The Availability Rate is the amount of available space divided by the building inventory base. Available space is space that is available for lease and may or may not be vacant.
5
    Average Rental Rates: Average rental rates are calculated off available spaces which also quote rental figures.

Weitere ähnliche Inhalte

Was ist angesagt?

Financial Statement Analysis
Financial Statement AnalysisFinancial Statement Analysis
Financial Statement Analysismmclean487
 
coventry health care annual reports 2007
coventry health care annual reports 2007coventry health care annual reports 2007
coventry health care annual reports 2007finance27
 
2012 Mid Year Industrial Market Report
2012 Mid Year Industrial Market Report2012 Mid Year Industrial Market Report
2012 Mid Year Industrial Market Reportbrianparrish
 
ecolab Ecolab_BusDesc_FinHigh
ecolab  Ecolab_BusDesc_FinHighecolab  Ecolab_BusDesc_FinHigh
ecolab Ecolab_BusDesc_FinHighfinance37
 
ecolab Ecolab_2004_Final
ecolab  Ecolab_2004_Finalecolab  Ecolab_2004_Final
ecolab Ecolab_2004_Finalfinance37
 
merck 3Q07 Other Financial Disclosures
merck  	3Q07 Other Financial Disclosuresmerck  	3Q07 Other Financial Disclosures
merck 3Q07 Other Financial Disclosuresfinance11
 
Ecolab2005AR
Ecolab2005AREcolab2005AR
Ecolab2005ARfinance37
 
J.S. Die & Mold - Operations Review 2006-12-21
J.S. Die & Mold - Operations Review 2006-12-21J.S. Die & Mold - Operations Review 2006-12-21
J.S. Die & Mold - Operations Review 2006-12-21Bob Sloma
 
BBBY_AR2007_proxy_v3
BBBY_AR2007_proxy_v3BBBY_AR2007_proxy_v3
BBBY_AR2007_proxy_v3finance44
 
alltel 3Q05_Supplemental
alltel  3Q05_Supplementalalltel  3Q05_Supplemental
alltel 3Q05_Supplementalfinance27
 
39348363 google-earnings-slides-q3-2010
39348363 google-earnings-slides-q3-201039348363 google-earnings-slides-q3-2010
39348363 google-earnings-slides-q3-2010Pranav Bhatnagar
 
Case 2 aymaan hossain (1531434030)
Case 2  aymaan hossain (1531434030)Case 2  aymaan hossain (1531434030)
Case 2 aymaan hossain (1531434030)AymaanHossain1
 

Was ist angesagt? (19)

Financial Statement Analysis
Financial Statement AnalysisFinancial Statement Analysis
Financial Statement Analysis
 
coventry health care annual reports 2007
coventry health care annual reports 2007coventry health care annual reports 2007
coventry health care annual reports 2007
 
2012 Mid Year Industrial Market Report
2012 Mid Year Industrial Market Report2012 Mid Year Industrial Market Report
2012 Mid Year Industrial Market Report
 
ecolab Ecolab_BusDesc_FinHigh
ecolab  Ecolab_BusDesc_FinHighecolab  Ecolab_BusDesc_FinHigh
ecolab Ecolab_BusDesc_FinHigh
 
401k Calculator
401k Calculator401k Calculator
401k Calculator
 
ecolab Ecolab_2004_Final
ecolab  Ecolab_2004_Finalecolab  Ecolab_2004_Final
ecolab Ecolab_2004_Final
 
merck 3Q07 Other Financial Disclosures
merck  	3Q07 Other Financial Disclosuresmerck  	3Q07 Other Financial Disclosures
merck 3Q07 Other Financial Disclosures
 
Retail Analysis: Identifying Opportunities Through Spending Analysis
Retail Analysis: Identifying Opportunities Through Spending AnalysisRetail Analysis: Identifying Opportunities Through Spending Analysis
Retail Analysis: Identifying Opportunities Through Spending Analysis
 
Ecolab2005AR
Ecolab2005AREcolab2005AR
Ecolab2005AR
 
J.S. Die & Mold - Operations Review 2006-12-21
J.S. Die & Mold - Operations Review 2006-12-21J.S. Die & Mold - Operations Review 2006-12-21
J.S. Die & Mold - Operations Review 2006-12-21
 
Houston Market Report April 2010
Houston Market Report April 2010Houston Market Report April 2010
Houston Market Report April 2010
 
4Q12 Presentation
4Q12 Presentation4Q12 Presentation
4Q12 Presentation
 
BBBY_AR2007_proxy_v3
BBBY_AR2007_proxy_v3BBBY_AR2007_proxy_v3
BBBY_AR2007_proxy_v3
 
alltel 3Q05_Supplemental
alltel  3Q05_Supplementalalltel  3Q05_Supplemental
alltel 3Q05_Supplemental
 
39348363 google-earnings-slides-q3-2010
39348363 google-earnings-slides-q3-201039348363 google-earnings-slides-q3-2010
39348363 google-earnings-slides-q3-2010
 
Houston Market Report June 2010
Houston Market Report June 2010Houston Market Report June 2010
Houston Market Report June 2010
 
Cipla 20-09-2010
Cipla   20-09-2010Cipla   20-09-2010
Cipla 20-09-2010
 
Bank of rajasthan
Bank of rajasthanBank of rajasthan
Bank of rajasthan
 
Case 2 aymaan hossain (1531434030)
Case 2  aymaan hossain (1531434030)Case 2  aymaan hossain (1531434030)
Case 2 aymaan hossain (1531434030)
 

Andere mochten auch

Colliers North American Office Report Q1 2014
Colliers North American Office Report Q1 2014Colliers North American Office Report Q1 2014
Colliers North American Office Report Q1 2014Chris Fyvie
 
Global review instant offices
Global review   instant officesGlobal review   instant offices
Global review instant officesChris Fyvie
 
60 st. clair east flyer 2012
60 st. clair east flyer 201260 st. clair east flyer 2012
60 st. clair east flyer 2012Chris Fyvie
 
Giotan construction furniture moving cost sheets sept 2011
Giotan construction furniture moving cost sheets sept 2011Giotan construction furniture moving cost sheets sept 2011
Giotan construction furniture moving cost sheets sept 2011Chris Fyvie
 
Fc small - sept 2011
Fc   small - sept 2011Fc   small - sept 2011
Fc small - sept 2011Chris Fyvie
 

Andere mochten auch (8)

Dte july
Dte   julyDte   july
Dte july
 
Colliers North American Office Report Q1 2014
Colliers North American Office Report Q1 2014Colliers North American Office Report Q1 2014
Colliers North American Office Report Q1 2014
 
Global review instant offices
Global review   instant officesGlobal review   instant offices
Global review instant offices
 
60 st. clair east flyer 2012
60 st. clair east flyer 201260 st. clair east flyer 2012
60 st. clair east flyer 2012
 
Giotan construction furniture moving cost sheets sept 2011
Giotan construction furniture moving cost sheets sept 2011Giotan construction furniture moving cost sheets sept 2011
Giotan construction furniture moving cost sheets sept 2011
 
Dtw 1
Dtw 1Dtw 1
Dtw 1
 
Fc small - sept 2011
Fc   small - sept 2011Fc   small - sept 2011
Fc small - sept 2011
 
Dtn grid
Dtn gridDtn grid
Dtn grid
 

Ähnlich wie Gta office market statistics 2011 q2

Ltn200804281069 C
Ltn200804281069 CLtn200804281069 C
Ltn200804281069 Cguest54ca90
 
2222020 Report Pagehttpsww3.capsim.comcgi-bindispla.docx
2222020 Report Pagehttpsww3.capsim.comcgi-bindispla.docx2222020 Report Pagehttpsww3.capsim.comcgi-bindispla.docx
2222020 Report Pagehttpsww3.capsim.comcgi-bindispla.docxRAJU852744
 
Swifton - The Capital Network - Financial Projections
Swifton - The Capital Network - Financial ProjectionsSwifton - The Capital Network - Financial Projections
Swifton - The Capital Network - Financial ProjectionsDavid Fogel
 
Swifton CFOs - McCarter English - Fin Proj 100511
Swifton CFOs - McCarter English - Fin Proj 100511Swifton CFOs - McCarter English - Fin Proj 100511
Swifton CFOs - McCarter English - Fin Proj 100511David Fogel
 
Campus clothiers semmiannual financial projection
Campus clothiers semmiannual financial projectionCampus clothiers semmiannual financial projection
Campus clothiers semmiannual financial projectionbrittneytaylor
 
Apresentação 2 q12 eng
Apresentação 2 q12 engApresentação 2 q12 eng
Apresentação 2 q12 engLocaliza
 
Erin Parker Atvidcf V1
Erin Parker Atvidcf V1Erin Parker Atvidcf V1
Erin Parker Atvidcf V1Caneskid05
 
Caída Publicidad EEUU 2009
Caída Publicidad EEUU 2009Caída Publicidad EEUU 2009
Caída Publicidad EEUU 2009Juan Varela
 
Mk version2
Mk version2Mk version2
Mk version2owlpics
 
Big_Lots_AR2003
Big_Lots_AR2003Big_Lots_AR2003
Big_Lots_AR2003finance50
 
2012 q1 google_earnings_slides
2012 q1 google_earnings_slides2012 q1 google_earnings_slides
2012 q1 google_earnings_slidestheextraaedge
 
2012 q1 google_earnings_slides
2012 q1 google_earnings_slides2012 q1 google_earnings_slides
2012 q1 google_earnings_slidesDrew Olanoff
 
Financial Model Manufacturing And Retail Businesses
Financial Model Manufacturing And Retail BusinessesFinancial Model Manufacturing And Retail Businesses
Financial Model Manufacturing And Retail BusinessesElisha A. A. (Capital) Ltd
 
Ppp slideshow 8-12-12
Ppp   slideshow 8-12-12Ppp   slideshow 8-12-12
Ppp slideshow 8-12-12lizjen
 
Apresentação 2 t11 e 1s11 eng
Apresentação 2 t11 e 1s11 engApresentação 2 t11 e 1s11 eng
Apresentação 2 t11 e 1s11 engLocaliza
 

Ähnlich wie Gta office market statistics 2011 q2 (20)

Ltn200804281069 C
Ltn200804281069 CLtn200804281069 C
Ltn200804281069 C
 
2222020 Report Pagehttpsww3.capsim.comcgi-bindispla.docx
2222020 Report Pagehttpsww3.capsim.comcgi-bindispla.docx2222020 Report Pagehttpsww3.capsim.comcgi-bindispla.docx
2222020 Report Pagehttpsww3.capsim.comcgi-bindispla.docx
 
Swifton - The Capital Network - Financial Projections
Swifton - The Capital Network - Financial ProjectionsSwifton - The Capital Network - Financial Projections
Swifton - The Capital Network - Financial Projections
 
Swifton CFOs - McCarter English - Fin Proj 100511
Swifton CFOs - McCarter English - Fin Proj 100511Swifton CFOs - McCarter English - Fin Proj 100511
Swifton CFOs - McCarter English - Fin Proj 100511
 
Campus clothiers semmiannual financial projection
Campus clothiers semmiannual financial projectionCampus clothiers semmiannual financial projection
Campus clothiers semmiannual financial projection
 
3 d pie chart
3 d pie chart3 d pie chart
3 d pie chart
 
Presentation 4Q09
Presentation 4Q09Presentation 4Q09
Presentation 4Q09
 
Ppt ideko spx_team
Ppt ideko spx_teamPpt ideko spx_team
Ppt ideko spx_team
 
Apresentação 2 q12 eng
Apresentação 2 q12 engApresentação 2 q12 eng
Apresentação 2 q12 eng
 
Erin Parker Atvidcf V1
Erin Parker Atvidcf V1Erin Parker Atvidcf V1
Erin Parker Atvidcf V1
 
Dcf
DcfDcf
Dcf
 
Caída Publicidad EEUU 2009
Caída Publicidad EEUU 2009Caída Publicidad EEUU 2009
Caída Publicidad EEUU 2009
 
Mk version2
Mk version2Mk version2
Mk version2
 
Big_Lots_AR2003
Big_Lots_AR2003Big_Lots_AR2003
Big_Lots_AR2003
 
Wmt Model Template
Wmt Model TemplateWmt Model Template
Wmt Model Template
 
2012 q1 google_earnings_slides
2012 q1 google_earnings_slides2012 q1 google_earnings_slides
2012 q1 google_earnings_slides
 
2012 q1 google_earnings_slides
2012 q1 google_earnings_slides2012 q1 google_earnings_slides
2012 q1 google_earnings_slides
 
Financial Model Manufacturing And Retail Businesses
Financial Model Manufacturing And Retail BusinessesFinancial Model Manufacturing And Retail Businesses
Financial Model Manufacturing And Retail Businesses
 
Ppp slideshow 8-12-12
Ppp   slideshow 8-12-12Ppp   slideshow 8-12-12
Ppp slideshow 8-12-12
 
Apresentação 2 t11 e 1s11 eng
Apresentação 2 t11 e 1s11 engApresentação 2 t11 e 1s11 eng
Apresentação 2 t11 e 1s11 eng
 

Mehr von Chris Fyvie

Colliers canada national market snapshot 2020 q4
Colliers canada national market snapshot 2020 q4Colliers canada national market snapshot 2020 q4
Colliers canada national market snapshot 2020 q4Chris Fyvie
 
Colliers GTA Office Statistics Q1 2017
Colliers GTA Office Statistics Q1 2017Colliers GTA Office Statistics Q1 2017
Colliers GTA Office Statistics Q1 2017Chris Fyvie
 
Downtown toronto office survey package august 25 2016
Downtown toronto office survey package   august 25 2016Downtown toronto office survey package   august 25 2016
Downtown toronto office survey package august 25 2016Chris Fyvie
 
WTF Properties - Toronto Office Space July availability report
WTF Properties - Toronto Office Space July availability reportWTF Properties - Toronto Office Space July availability report
WTF Properties - Toronto Office Space July availability reportChris Fyvie
 
Plug in to peak productivity - Colliers Spark Report
Plug in to peak productivity - Colliers Spark ReportPlug in to peak productivity - Colliers Spark Report
Plug in to peak productivity - Colliers Spark ReportChris Fyvie
 
Lennard commercial office space downtown toronto
Lennard commercial office space downtown torontoLennard commercial office space downtown toronto
Lennard commercial office space downtown torontoChris Fyvie
 
Q1 2016 cresa market report
Q1 2016 cresa market reportQ1 2016 cresa market report
Q1 2016 cresa market reportChris Fyvie
 
2016 office condo report
2016 office condo report2016 office condo report
2016 office condo reportChris Fyvie
 
Toronto office market report q1 2016
Toronto office market report q1 2016Toronto office market report q1 2016
Toronto office market report q1 2016Chris Fyvie
 
Colliers Gta office market statistics q1 2016
Colliers Gta office market statistics q1 2016Colliers Gta office market statistics q1 2016
Colliers Gta office market statistics q1 2016Chris Fyvie
 
Cadillac Fairview Office Vacancy - May 2016
Cadillac Fairview Office Vacancy - May 2016Cadillac Fairview Office Vacancy - May 2016
Cadillac Fairview Office Vacancy - May 2016Chris Fyvie
 
Security deposit insecurity - Daoust Vukovich LLP
Security deposit insecurity - Daoust Vukovich LLPSecurity deposit insecurity - Daoust Vukovich LLP
Security deposit insecurity - Daoust Vukovich LLPChris Fyvie
 
Costs to Furnish Toronto Office Space
Costs to Furnish Toronto Office SpaceCosts to Furnish Toronto Office Space
Costs to Furnish Toronto Office SpaceChris Fyvie
 
Audio Visual Construction Costs
Audio Visual Construction CostsAudio Visual Construction Costs
Audio Visual Construction CostsChris Fyvie
 
Office Space Construction Costs
Office Space Construction CostsOffice Space Construction Costs
Office Space Construction CostsChris Fyvie
 
Toronto Innovate Office Spaces
Toronto Innovate Office SpacesToronto Innovate Office Spaces
Toronto Innovate Office SpacesChris Fyvie
 
Cadillac fairview gta reports-nov_2015
Cadillac fairview   gta reports-nov_2015Cadillac fairview   gta reports-nov_2015
Cadillac fairview gta reports-nov_2015Chris Fyvie
 
Ashlar november-2015-availability-report
Ashlar november-2015-availability-reportAshlar november-2015-availability-report
Ashlar november-2015-availability-reportChris Fyvie
 
Colliers Toronto office market report 2015 q3
Colliers Toronto office market report 2015 q3Colliers Toronto office market report 2015 q3
Colliers Toronto office market report 2015 q3Chris Fyvie
 
#Toronto Businesses now demanding their offices be close to accessible, rapid...
#Toronto Businesses now demanding their offices be close to accessible, rapid...#Toronto Businesses now demanding their offices be close to accessible, rapid...
#Toronto Businesses now demanding their offices be close to accessible, rapid...Chris Fyvie
 

Mehr von Chris Fyvie (20)

Colliers canada national market snapshot 2020 q4
Colliers canada national market snapshot 2020 q4Colliers canada national market snapshot 2020 q4
Colliers canada national market snapshot 2020 q4
 
Colliers GTA Office Statistics Q1 2017
Colliers GTA Office Statistics Q1 2017Colliers GTA Office Statistics Q1 2017
Colliers GTA Office Statistics Q1 2017
 
Downtown toronto office survey package august 25 2016
Downtown toronto office survey package   august 25 2016Downtown toronto office survey package   august 25 2016
Downtown toronto office survey package august 25 2016
 
WTF Properties - Toronto Office Space July availability report
WTF Properties - Toronto Office Space July availability reportWTF Properties - Toronto Office Space July availability report
WTF Properties - Toronto Office Space July availability report
 
Plug in to peak productivity - Colliers Spark Report
Plug in to peak productivity - Colliers Spark ReportPlug in to peak productivity - Colliers Spark Report
Plug in to peak productivity - Colliers Spark Report
 
Lennard commercial office space downtown toronto
Lennard commercial office space downtown torontoLennard commercial office space downtown toronto
Lennard commercial office space downtown toronto
 
Q1 2016 cresa market report
Q1 2016 cresa market reportQ1 2016 cresa market report
Q1 2016 cresa market report
 
2016 office condo report
2016 office condo report2016 office condo report
2016 office condo report
 
Toronto office market report q1 2016
Toronto office market report q1 2016Toronto office market report q1 2016
Toronto office market report q1 2016
 
Colliers Gta office market statistics q1 2016
Colliers Gta office market statistics q1 2016Colliers Gta office market statistics q1 2016
Colliers Gta office market statistics q1 2016
 
Cadillac Fairview Office Vacancy - May 2016
Cadillac Fairview Office Vacancy - May 2016Cadillac Fairview Office Vacancy - May 2016
Cadillac Fairview Office Vacancy - May 2016
 
Security deposit insecurity - Daoust Vukovich LLP
Security deposit insecurity - Daoust Vukovich LLPSecurity deposit insecurity - Daoust Vukovich LLP
Security deposit insecurity - Daoust Vukovich LLP
 
Costs to Furnish Toronto Office Space
Costs to Furnish Toronto Office SpaceCosts to Furnish Toronto Office Space
Costs to Furnish Toronto Office Space
 
Audio Visual Construction Costs
Audio Visual Construction CostsAudio Visual Construction Costs
Audio Visual Construction Costs
 
Office Space Construction Costs
Office Space Construction CostsOffice Space Construction Costs
Office Space Construction Costs
 
Toronto Innovate Office Spaces
Toronto Innovate Office SpacesToronto Innovate Office Spaces
Toronto Innovate Office Spaces
 
Cadillac fairview gta reports-nov_2015
Cadillac fairview   gta reports-nov_2015Cadillac fairview   gta reports-nov_2015
Cadillac fairview gta reports-nov_2015
 
Ashlar november-2015-availability-report
Ashlar november-2015-availability-reportAshlar november-2015-availability-report
Ashlar november-2015-availability-report
 
Colliers Toronto office market report 2015 q3
Colliers Toronto office market report 2015 q3Colliers Toronto office market report 2015 q3
Colliers Toronto office market report 2015 q3
 
#Toronto Businesses now demanding their offices be close to accessible, rapid...
#Toronto Businesses now demanding their offices be close to accessible, rapid...#Toronto Businesses now demanding their offices be close to accessible, rapid...
#Toronto Businesses now demanding their offices be close to accessible, rapid...
 

Kürzlich hochgeladen

BDSM⚡Call Girls in Sector 55 Noida Escorts >༒8448380779 Escort Service
BDSM⚡Call Girls in Sector 55 Noida Escorts >༒8448380779 Escort ServiceBDSM⚡Call Girls in Sector 55 Noida Escorts >༒8448380779 Escort Service
BDSM⚡Call Girls in Sector 55 Noida Escorts >༒8448380779 Escort ServiceDelhi Call girls
 
Premium Villa Projects in Sarjapur Road Bengaluru
Premium Villa Projects in Sarjapur Road BengaluruPremium Villa Projects in Sarjapur Road Bengaluru
Premium Villa Projects in Sarjapur Road BengaluruShivaSeo3
 
Call Girls in Karkardooma Delhi +91 84487779280}Woman Seeking Man in Delhi NCR
Call Girls in Karkardooma Delhi +91 84487779280}Woman Seeking Man in Delhi NCRCall Girls in Karkardooma Delhi +91 84487779280}Woman Seeking Man in Delhi NCR
Call Girls in Karkardooma Delhi +91 84487779280}Woman Seeking Man in Delhi NCRasmaqueen5
 
Majestique Viman Nagar Pune Brochure.pdf
Majestique Viman Nagar Pune Brochure.pdfMajestique Viman Nagar Pune Brochure.pdf
Majestique Viman Nagar Pune Brochure.pdfBabyrudram
 
9990771857 Call Girls Dwarka Sector 8 Delhi (Call Girls ) Delhi
9990771857 Call Girls  Dwarka Sector 8 Delhi (Call Girls ) Delhi9990771857 Call Girls  Dwarka Sector 8 Delhi (Call Girls ) Delhi
9990771857 Call Girls Dwarka Sector 8 Delhi (Call Girls ) Delhidelhimodel235
 
Kohinoor Hinjewadi Phase 2 Pune E-Brochure.pdf
Kohinoor Hinjewadi Phase 2 Pune  E-Brochure.pdfKohinoor Hinjewadi Phase 2 Pune  E-Brochure.pdf
Kohinoor Hinjewadi Phase 2 Pune E-Brochure.pdfManishSaxena95
 
9990771857 Call Girls in Dwarka Sector 2 Delhi (Call Girls) Delhi
9990771857 Call Girls in Dwarka Sector 2 Delhi (Call Girls) Delhi9990771857 Call Girls in Dwarka Sector 2 Delhi (Call Girls) Delhi
9990771857 Call Girls in Dwarka Sector 2 Delhi (Call Girls) Delhidelhimodel235
 
Enjoy Night ≽ 8448380779 ≼ Call Girls In Iffco Chowk (Gurgaon)
Enjoy Night ≽ 8448380779 ≼ Call Girls In Iffco Chowk (Gurgaon)Enjoy Night ≽ 8448380779 ≼ Call Girls In Iffco Chowk (Gurgaon)
Enjoy Night ≽ 8448380779 ≼ Call Girls In Iffco Chowk (Gurgaon)Delhi Call girls
 
9990771857 Call Girls in Dwarka Sector 08 Delhi (Call Girls) Delhi
9990771857 Call Girls in Dwarka Sector 08 Delhi (Call Girls) Delhi9990771857 Call Girls in Dwarka Sector 08 Delhi (Call Girls) Delhi
9990771857 Call Girls in Dwarka Sector 08 Delhi (Call Girls) Delhidelhimodel235
 
Enjoy Night ≽ 8448380779 ≼ Call Girls In Huda City Centre (Gurgaon)
Enjoy Night ≽ 8448380779 ≼ Call Girls In Huda City Centre (Gurgaon)Enjoy Night ≽ 8448380779 ≼ Call Girls In Huda City Centre (Gurgaon)
Enjoy Night ≽ 8448380779 ≼ Call Girls In Huda City Centre (Gurgaon)Delhi Call girls
 
9990771857 Call Girls in Dwarka Sector 6 Delhi (Call Girls) Delhi
9990771857 Call Girls in Dwarka Sector 6 Delhi (Call Girls) Delhi9990771857 Call Girls in Dwarka Sector 6 Delhi (Call Girls) Delhi
9990771857 Call Girls in Dwarka Sector 6 Delhi (Call Girls) Delhidelhimodel235
 
Parksville 96 Surrey Floor Plans May 2024
Parksville 96 Surrey Floor Plans May 2024Parksville 96 Surrey Floor Plans May 2024
Parksville 96 Surrey Floor Plans May 2024VickyAulakh1
 
2k Shot Call girls Aiims Delhi 9205541914
2k Shot Call girls Aiims Delhi 92055419142k Shot Call girls Aiims Delhi 9205541914
2k Shot Call girls Aiims Delhi 9205541914Delhi Call girls
 
Purva Soukhyam in Guduvancheri Chennai.pdf
Purva Soukhyam in Guduvancheri Chennai.pdfPurva Soukhyam in Guduvancheri Chennai.pdf
Purva Soukhyam in Guduvancheri Chennai.pdfpritika141199
 
BPTP THE AMAARIO For The Royals Of Tomorrow in Sector 37D Gurgaon Dwarka Expr...
BPTP THE AMAARIO For The Royals Of Tomorrow in Sector 37D Gurgaon Dwarka Expr...BPTP THE AMAARIO For The Royals Of Tomorrow in Sector 37D Gurgaon Dwarka Expr...
BPTP THE AMAARIO For The Royals Of Tomorrow in Sector 37D Gurgaon Dwarka Expr...ApartmentWala1
 
2k Shots ≽ 9205541914 ≼ Call Girls In Sainik Farm (Delhi)
2k Shots ≽ 9205541914 ≼ Call Girls In Sainik Farm (Delhi)2k Shots ≽ 9205541914 ≼ Call Girls In Sainik Farm (Delhi)
2k Shots ≽ 9205541914 ≼ Call Girls In Sainik Farm (Delhi)Delhi Call girls
 
Mahindra Happinest Tathawade Pune Brochure.pdf
Mahindra Happinest Tathawade Pune Brochure.pdfMahindra Happinest Tathawade Pune Brochure.pdf
Mahindra Happinest Tathawade Pune Brochure.pdfBabyrudram
 
Call Girls In Krishna Nagar Delhi (Escort)↫8447779280↬@SHOT 1500- NIGHT 5500→...
Call Girls In Krishna Nagar Delhi (Escort)↫8447779280↬@SHOT 1500- NIGHT 5500→...Call Girls In Krishna Nagar Delhi (Escort)↫8447779280↬@SHOT 1500- NIGHT 5500→...
Call Girls In Krishna Nagar Delhi (Escort)↫8447779280↬@SHOT 1500- NIGHT 5500→...asmaqueen5
 
9990771857 Call Girls Dwarka Sector 9 Delhi (Call Girls ) Delhi
9990771857 Call Girls Dwarka Sector 9 Delhi (Call Girls ) Delhi9990771857 Call Girls Dwarka Sector 9 Delhi (Call Girls ) Delhi
9990771857 Call Girls Dwarka Sector 9 Delhi (Call Girls ) Delhidelhimodel235
 
Best Deal Virtual Space in Satya The Hive Tata Zudio 750 Sqft 1.89 Cr All inc...
Best Deal Virtual Space in Satya The Hive Tata Zudio 750 Sqft 1.89 Cr All inc...Best Deal Virtual Space in Satya The Hive Tata Zudio 750 Sqft 1.89 Cr All inc...
Best Deal Virtual Space in Satya The Hive Tata Zudio 750 Sqft 1.89 Cr All inc...ApartmentWala1
 

Kürzlich hochgeladen (20)

BDSM⚡Call Girls in Sector 55 Noida Escorts >༒8448380779 Escort Service
BDSM⚡Call Girls in Sector 55 Noida Escorts >༒8448380779 Escort ServiceBDSM⚡Call Girls in Sector 55 Noida Escorts >༒8448380779 Escort Service
BDSM⚡Call Girls in Sector 55 Noida Escorts >༒8448380779 Escort Service
 
Premium Villa Projects in Sarjapur Road Bengaluru
Premium Villa Projects in Sarjapur Road BengaluruPremium Villa Projects in Sarjapur Road Bengaluru
Premium Villa Projects in Sarjapur Road Bengaluru
 
Call Girls in Karkardooma Delhi +91 84487779280}Woman Seeking Man in Delhi NCR
Call Girls in Karkardooma Delhi +91 84487779280}Woman Seeking Man in Delhi NCRCall Girls in Karkardooma Delhi +91 84487779280}Woman Seeking Man in Delhi NCR
Call Girls in Karkardooma Delhi +91 84487779280}Woman Seeking Man in Delhi NCR
 
Majestique Viman Nagar Pune Brochure.pdf
Majestique Viman Nagar Pune Brochure.pdfMajestique Viman Nagar Pune Brochure.pdf
Majestique Viman Nagar Pune Brochure.pdf
 
9990771857 Call Girls Dwarka Sector 8 Delhi (Call Girls ) Delhi
9990771857 Call Girls  Dwarka Sector 8 Delhi (Call Girls ) Delhi9990771857 Call Girls  Dwarka Sector 8 Delhi (Call Girls ) Delhi
9990771857 Call Girls Dwarka Sector 8 Delhi (Call Girls ) Delhi
 
Kohinoor Hinjewadi Phase 2 Pune E-Brochure.pdf
Kohinoor Hinjewadi Phase 2 Pune  E-Brochure.pdfKohinoor Hinjewadi Phase 2 Pune  E-Brochure.pdf
Kohinoor Hinjewadi Phase 2 Pune E-Brochure.pdf
 
9990771857 Call Girls in Dwarka Sector 2 Delhi (Call Girls) Delhi
9990771857 Call Girls in Dwarka Sector 2 Delhi (Call Girls) Delhi9990771857 Call Girls in Dwarka Sector 2 Delhi (Call Girls) Delhi
9990771857 Call Girls in Dwarka Sector 2 Delhi (Call Girls) Delhi
 
Enjoy Night ≽ 8448380779 ≼ Call Girls In Iffco Chowk (Gurgaon)
Enjoy Night ≽ 8448380779 ≼ Call Girls In Iffco Chowk (Gurgaon)Enjoy Night ≽ 8448380779 ≼ Call Girls In Iffco Chowk (Gurgaon)
Enjoy Night ≽ 8448380779 ≼ Call Girls In Iffco Chowk (Gurgaon)
 
9990771857 Call Girls in Dwarka Sector 08 Delhi (Call Girls) Delhi
9990771857 Call Girls in Dwarka Sector 08 Delhi (Call Girls) Delhi9990771857 Call Girls in Dwarka Sector 08 Delhi (Call Girls) Delhi
9990771857 Call Girls in Dwarka Sector 08 Delhi (Call Girls) Delhi
 
Enjoy Night ≽ 8448380779 ≼ Call Girls In Huda City Centre (Gurgaon)
Enjoy Night ≽ 8448380779 ≼ Call Girls In Huda City Centre (Gurgaon)Enjoy Night ≽ 8448380779 ≼ Call Girls In Huda City Centre (Gurgaon)
Enjoy Night ≽ 8448380779 ≼ Call Girls In Huda City Centre (Gurgaon)
 
9990771857 Call Girls in Dwarka Sector 6 Delhi (Call Girls) Delhi
9990771857 Call Girls in Dwarka Sector 6 Delhi (Call Girls) Delhi9990771857 Call Girls in Dwarka Sector 6 Delhi (Call Girls) Delhi
9990771857 Call Girls in Dwarka Sector 6 Delhi (Call Girls) Delhi
 
Parksville 96 Surrey Floor Plans May 2024
Parksville 96 Surrey Floor Plans May 2024Parksville 96 Surrey Floor Plans May 2024
Parksville 96 Surrey Floor Plans May 2024
 
2k Shot Call girls Aiims Delhi 9205541914
2k Shot Call girls Aiims Delhi 92055419142k Shot Call girls Aiims Delhi 9205541914
2k Shot Call girls Aiims Delhi 9205541914
 
Purva Soukhyam in Guduvancheri Chennai.pdf
Purva Soukhyam in Guduvancheri Chennai.pdfPurva Soukhyam in Guduvancheri Chennai.pdf
Purva Soukhyam in Guduvancheri Chennai.pdf
 
BPTP THE AMAARIO For The Royals Of Tomorrow in Sector 37D Gurgaon Dwarka Expr...
BPTP THE AMAARIO For The Royals Of Tomorrow in Sector 37D Gurgaon Dwarka Expr...BPTP THE AMAARIO For The Royals Of Tomorrow in Sector 37D Gurgaon Dwarka Expr...
BPTP THE AMAARIO For The Royals Of Tomorrow in Sector 37D Gurgaon Dwarka Expr...
 
2k Shots ≽ 9205541914 ≼ Call Girls In Sainik Farm (Delhi)
2k Shots ≽ 9205541914 ≼ Call Girls In Sainik Farm (Delhi)2k Shots ≽ 9205541914 ≼ Call Girls In Sainik Farm (Delhi)
2k Shots ≽ 9205541914 ≼ Call Girls In Sainik Farm (Delhi)
 
Mahindra Happinest Tathawade Pune Brochure.pdf
Mahindra Happinest Tathawade Pune Brochure.pdfMahindra Happinest Tathawade Pune Brochure.pdf
Mahindra Happinest Tathawade Pune Brochure.pdf
 
Call Girls In Krishna Nagar Delhi (Escort)↫8447779280↬@SHOT 1500- NIGHT 5500→...
Call Girls In Krishna Nagar Delhi (Escort)↫8447779280↬@SHOT 1500- NIGHT 5500→...Call Girls In Krishna Nagar Delhi (Escort)↫8447779280↬@SHOT 1500- NIGHT 5500→...
Call Girls In Krishna Nagar Delhi (Escort)↫8447779280↬@SHOT 1500- NIGHT 5500→...
 
9990771857 Call Girls Dwarka Sector 9 Delhi (Call Girls ) Delhi
9990771857 Call Girls Dwarka Sector 9 Delhi (Call Girls ) Delhi9990771857 Call Girls Dwarka Sector 9 Delhi (Call Girls ) Delhi
9990771857 Call Girls Dwarka Sector 9 Delhi (Call Girls ) Delhi
 
Best Deal Virtual Space in Satya The Hive Tata Zudio 750 Sqft 1.89 Cr All inc...
Best Deal Virtual Space in Satya The Hive Tata Zudio 750 Sqft 1.89 Cr All inc...Best Deal Virtual Space in Satya The Hive Tata Zudio 750 Sqft 1.89 Cr All inc...
Best Deal Virtual Space in Satya The Hive Tata Zudio 750 Sqft 1.89 Cr All inc...
 

Gta office market statistics 2011 q2

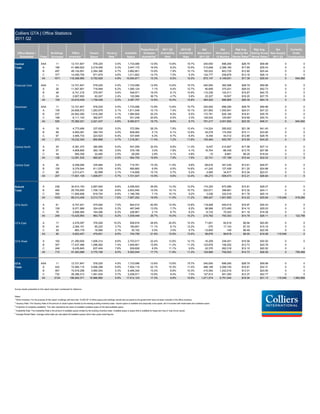
  • 1. Colliers GTA | Office Statistics 2011 Q2 Proportion of 2011 Q2 2010 Q2 Net Net Wgt Avg. Wgt Avg. Net Currently Office Market / Buildings Office Vacant Vacancy Available Sublease Availability Availability Absorption Absorption Asking Net Asking Gross New Supply Under 1 2 3 5 Submarket Class Surveyed Inventory Space Rate Space Availability Rate Rate 2011 Q2 12 Months Rental Rates Rental Rates 2011 Q2 Construction Central AAA 11 12,721,647 578,225 4.5% 1,733,096 12.6% 13.6% 15.7% 240,000 698,290 $28.79 $59.98 0 0 Total: A 186 41,969,922 2,218,458 5.3% 3,447,172 16.5% 8.2% 10.5% 313,848 2,398,160 $17.85 $35.43 0 0 B 497 49,124,691 2,284,366 4.7% 3,862,801 15.6% 7.9% 10.1% 193,522 843,725 $12.80 $25.44 0 0 C 377 14,490,705 671,879 4.6% 1,011,802 14.7% 7.0% 5.3% 124,777 208,876 $13.16 $26.14 0 0 All 1071 118,306,965 5,752,928 4.9% 10,054,871 15.3% 8.5% 10.2% 872,147 4,149,051 $17.39 $35.04 0 644,592 Financial Core AAA 11 12,721,647 578,225 4.5% 1,733,096 12.6% 13.6% 15.7% 240,000 382,596 $28.79 $59.98 0 0 A 26 11,547,851 718,949 6.2% 1,085,124 7.1% 9.4% 12.7% 90,859 370,251 $26.03 $52.73 0 0 B 48 6,741,218 379,007 5.6% 546,971 18.0% 8.1% 10.9% 110,336 124,511 $19.87 $40.75 0 0 C 24 2,607,693 63,247 2.4% 122,566 36.7% 4.7% 5.8% 23,327 19,507 $18.20 $37.75 0 0 All 109 33,618,409 1,739,428 5.2% 3,487,757 12.6% 10.4% 12.8% 464,522 896,865 $26.30 $54.19 0 0 Downtown AAA 11 12,721,647 578,225 4.5% 1,733,096 12.6% 13.6% 15.7% 240,000 698,290 $28.79 $59.98 0 0 A 109 24,606,972 1,263,978 5.1% 1,811,548 10.1% 7.4% 10.1% 251,893 1,550,061 $24.01 $47.23 0 0 B 237 24,942,260 1,016,358 4.1% 1,984,926 25.2% 8.0% 8.5% 172,781 628,184 $18.81 $35.76 0 0 C 168 8,111,142 362,877 4.5% 531,248 20.6% 6.5% 3.3% 126,542 125,067 $16.69 $30.74 0 0 All 525 70,382,021 3,221,437 4.6% 6,060,817 16.7% 8.6% 9.7% 791,217 3,001,602 $23.30 $46.31 0 644,592 Midtown A 18 4,773,486 237,630 5.0% 372,584 26.3% 7.8% 12.4% 114,524 285,922 $21.06 $41.40 0 0 B 98 9,993,081 394,745 4.0% 608,060 5.1% 6.1% 12.8% 45,278 174,554 $15.11 $33.85 0 0 C 97 3,465,733 223,523 6.4% 337,658 6.3% 9.7% 8.4% -6,340 40,312 $12.85 $28.76 0 0 All 213 18,232,300 855,898 4.7% 1,318,301 11.4% 7.2% 11.8% 153,463 500,787 $15.90 $34.25 0 0 Central North A 25 6,381,370 380,955 6.0% 547,259 32.4% 8.6% 11.3% 6,047 214,947 $17.58 $37.12 0 0 B 57 4,809,806 262,185 5.5% 379,156 3.0% 7.9% 4.1% 16,704 -86,439 $13.75 $27.96 0 0 C 44 900,359 22,480 2.5% 28,290 2.9% 3.1% 4.8% -10 8,681 $9.29 $18.04 0 0 All 126 12,091,535 665,621 5.5% 954,705 19.8% 7.9% 7.9% 22,741 137,189 $15.44 $32.03 0 0 Central East A 34 6,208,094 335,894 5.4% 715,781 15.3% 11.5% 9.8% -58,616 347,230 $13.61 $29.57 0 0 B 105 9,379,544 611,078 6.5% 890,660 6.9% 9.5% 14.6% -41,242 127,426 $11.20 $24.86 0 0 C 68 2,013,471 62,999 3.1% 114,606 15.1% 5.7% 9.2% 4,585 34,817 $12.04 $23.51 0 0 All 207 17,601,109 1,009,971 5.7% 1,721,047 10.9% 9.8% 12.4% -95,273 509,473 $12.21 $26.64 0 0 Suburb A 238 30,614,193 2,687,840 8.8% 4,056,943 26.8% 13.3% 12.5% 174,320 870,586 $15.81 $29.27 0 0 Total: B 460 25,793,605 1,706,138 6.6% 2,603,540 15.0% 10.1% 10.7% 222,071 398,891 $13.32 $24.11 0 0 C 355 11,905,608 819,754 6.9% 1,196,769 7.1% 10.1% 9.2% 3,036 332,516 $11.76 $20.14 0 0 All 1053 68,313,406 5,213,733 7.6% 7,857,252 19.9% 11.5% 11.2% 399,427 1,601,993 $14.22 $25.84 115,546 918,266 GTA North A 61 6,747,441 475,000 7.0% 844,510 40.9% 12.5% 12.8% 118,928 449,515 $16.97 $30.43 0 0 B 109 6,071,968 324,435 5.3% 467,948 13.0% 7.7% 8.2% 98,568 273,495 $14.10 $25.03 0 0 C 78 2,606,584 164,266 6.3% 226,991 2.1% 8.7% 8.2% -6,734 70,343 $11.16 $18.38 0 0 All 248 15,425,993 963,702 6.2% 1,539,449 26.7% 10.0% 10.2% 210,762 793,353 $14.79 $26.11 0 122,798 GTA East A 17 2,476,097 376,526 15.2% 508,916 26.8% 20.6% 15.3% 71,651 82,619 $9.94 $20.80 0 0 B 44 2,284,151 85,220 3.7% 185,691 11.1% 8.1% 13.2% -375 17,143 $7.33 $15.16 0 0 C 29 863,179 18,085 2.1% 30,152 0.0% 3.5% 9.7% -12,600 -145 $6.48 $22.59 0 0 All 90 5,623,427 479,831 8.5% 724,759 21.6% 12.9% 13.5% 58,676 99,618 $9.00 $19.26 115,546 0 GTA West A 160 21,390,655 1,836,314 8.6% 2,703,517 22.4% 12.6% 12.1% -16,259 338,451 $16.58 $30.50 0 0 B 307 17,437,486 1,296,482 7.4% 1,949,901 15.8% 11.2% 11.3% 123,878 108,252 $13.73 $24.78 0 C 248 8,435,845 637,404 7.6% 939,626 8.5% 11.1% 9.5% 22,370 262,318 $12.10 $20.52 0 0 All 715 47,263,986 3,770,199 8.0% 5,593,044 17.7% 11.8% 11.3% 129,989 709,022 $14.73 $26.59 0 795,468 GTA AAA 11 12,721,647 578,225 4.5% 1,733,096 12.6% 13.6% 15.7% 240,000 698,290 $28.79 $59.98 0 0 Total: A 424 72,584,115 4,906,298 6.8% 7,504,115 22.1% 10.3% 11.4% 488,168 3,268,745 $16.81 $32.31 0 0 B 957 74,918,296 3,990,504 5.3% 6,466,340 15.4% 8.6% 10.3% 415,594 1,242,616 $13.01 $24.90 0 0 C 732 26,396,313 1,491,634 5.7% 2,208,571 10.6% 8.4% 7.0% 127,813 541,392 $12.37 $22.77 0 0 All 2124 186,620,371 10,966,660 5.9% 17,912,123 17.3% 9.6% 10.6% 1,271,574 5,751,044 $16.04 $31.13 115,546 1,562,858 Survey results presented on this report have been condensed for reference. Notes: 1 Office Inventory: For the purpose of this report, buildings with less than 10,000 SF of office space and buildings owned and occupied by the government have not been included in the office inventory. 2 Vacancy Rate: The Vacancy Rate is the amount of vacant space divided by the existing building inventory base. Vacant space is available and physically unoccupied, and it includes both head lease and sublease space. 3 Proportion of sublease availability: This ratio represents the share of available sublease space of the total available space. 4 Availability Rate: The Availability Rate is the amount of available space divided by the building inventory base. Available space is space that is available for lease and may or may not be vacant. 5 Average Rental Rates: Average rental rates are calculated off available spaces which also quote rental figures.
  • 2. Colliers Downtown | Office Statistics 2011 Q2 Proportion of 2011 Q2 2010 Q2 Net Net Wgt Avg. Wgt Avg. Net Currently Office Market / Buildings Office Vacant Vacancy Available Sublease Availability Availability Absorption Absorption Asking Net Asking Gross New Supply Under 1 2 Submarket Class Surveyed Inventory Space Rate Space Availability3 Rate Rate 2011 Q2 12 Months 5 Rental Rates Rental Rates 2011 Q2 Construction Financial Core AAA 11 12,721,647 578,225 4.5% 1,733,096 12.6% 13.6% 15.7% 240,000 698,290 $28.79 $59.98 0 0 A 26 11,547,851 718,949 6.2% 1,085,124 7.1% 9.4% 12.7% 90,859 423,031 $26.03 $52.73 0 0 B 48 6,741,218 379,007 5.6% 546,971 18.0% 8.1% 10.9% 110,336 383,883 $19.87 $40.75 0 0 C 24 2,607,693 63,247 2.4% 122,566 36.7% 4.7% 5.8% 23,327 55,259 $18.20 $37.75 0 0 All 109 33,618,409 1,739,428 5.2% 3,487,757 12.6% 10.4% 12.8% 464,522 1,560,464 $26.30 $54.19 0 0 Downtown East A 22 1,101,378 46,978 4.3% 55,017 57.9% 5.0% 6.2% -557 37,870 $16.61 $35.53 0 0 B 52 1,907,970 123,983 6.5% 198,749 3.7% 10.4% 12.0% 52,984 88,888 $20.99 $31.82 0 0 C 36 915,464 92,904 10.1% 132,658 3.6% 14.5% 13.7% 46,316 75,508 $15.80 $24.13 0 0 All 110 3,924,812 263,865 6.7% 386,423 11.4% 9.8% 10.7% 98,743 202,265 $18.76 $29.20 0 0 Downtown North A 13 5,641,211 233,573 4.1% 269,685 9.1% 4.8% 6.1% 31,003 150,599 $23.00 $43.02 0 0 B 28 6,481,619 132,605 2.0% 217,186 24.2% 3.4% 3.7% 22,835 21,583 $16.49 $36.16 0 0 C 33 2,595,629 83,631 3.2% 107,135 0.0% 4.1% 5.0% 5,800 -57,068 $16.87 $35.88 0 0 All 74 14,718,459 449,809 3.1% 594,006 13.0% 4.0% 4.8% 59,639 115,114 $19.65 $39.35 0 0 Downtown South A 6 2,270,654 34,581 1.5% 44,192 29.3% 1.9% 5.9% 35,908 722,014 $31.00 $53.90 0 0 B 5 1,271,110 97,966 7.7% 175,289 77.2% 13.8% 12.1% 17,718 -47,644 $15.00 $29.31 0 0 C 7 273,699 56,840 20.8% 56,840 100.0% 20.8% 1.7% 11,900 -56,840 $13.25 $18.82 0 0 All 18 3,815,463 189,387 5.0% 276,321 74.2% 7.2% 7.9% 65,526 617,530 $22.02 $40.09 0 644,952 Downtown West A 42 4,045,878 229,897 5.7% 357,530 10.2% 8.8% 11.3% 94,681 216,547 $18.28 $33.38 0 0 B 104 8,540,343 282,796 3.3% 846,732 24.3% 9.9% 9.2% -31,092 181,474 $18.24 $33.75 0 0 C 68 1,718,657 66,255 3.9% 112,049 2.6% 6.5% 7.1% 39,199 108,208 $16.47 $28.48 0 0 All 214 14,304,878 578,948 4.0% 1,316,310 18.6% 9.2% 9.6% 102,788 506,229 $18.07 $33.10 0 0 Downtown AAA 11 12,721,647 578,225 4.5% 1,733,096 12.6% 13.6% 15.7% 240,000 698,290 $28.79 $59.98 0 0 Total: A 109 24,606,972 1,263,978 5.1% 1,811,548 10.1% 7.4% 10.1% 251,893 1,550,061 $24.01 $47.23 0 0 B 237 24,942,260 1,016,358 4.1% 1,984,926 25.2% 8.0% 8.5% 172,781 628,184 $18.81 $35.76 0 0 C 168 8,111,142 362,877 4.5% 531,248 20.6% 6.5% 6.5% 126,542 125,067 $16.69 $30.74 0 0 All 525 70,382,021 3,221,437 4.6% 6,060,817 16.7% 8.6% 10.1% 791,217 3,001,602 $23.30 $46.31 0 644,952 Survey results presented on this report have been condensed for reference. Notes: 1 Office Inventory: For the purpose of this report, buildings with less than 10,000 SF of office space and buildings owned and occupied by the government have not been included in the office inventory. 2 Vacancy Rate: The Vacancy Rate is the amount of vacant space divided by the existing building inventory base. Vacant space is available and physically unoccupied, and it includes both head lease and sublease space. 3 Proportion of Sublease Availability: This ratio represents the share of available sublease space of the total available space. 4 Availability Rate: The Availability Rate is the amount of available space divided by the building inventory base. Available space is space that is available for lease and may or may not be vacant. 5 Average Rental Rates: Average rental rates are calculated off available spaces which also quote rental figures.
  • 3. Colliers Midtown | Office Statistics 2011 Q2 Proportion of 2011 Q2 2010 Q2 Net Net Wgt Avg. Wgt Avg. Net Currently Office Market / Buildings Office Vacant Vacancy Available Sublease Availability Availability Absorption Absorption Asking Net Asking Gross New Supply Under 1 2 3 5 Submarket Class Surveyed Inventory Space Rate Space Availability Rate Rate 2011 Q2 12 Months Rental Rates Rental Rates 2011 Q2 Construction Yonge-Bloor A 8 2,656,355 157,728 5.9% 230,973 17.7% 8.7% 10.6% 43,245 78,144 $22.83 $42.83 0 0 B 37 5,583,452 114,206 2.0% 166,260 2.4% 3.0% 3.5% 2,174 109,698 $15.56 $36.20 0 0 C 29 1,393,195 110,742 7.9% 198,713 10.7% 14.3% 11.2% -4,450 16,234 $12.97 $30.59 0 0 All 74 9,633,002 382,676 4.0% 595,946 11.1% 6.2% 6.6% 40,969 204,077 $17.51 $36.90 0 0 Yonge-St.Clair A 4 798,771 4,131 0.5% 32,691 35.7% 4.1% 10.0% 27,778 68,443 $19.17 $41.91 0 0 B 19 1,586,172 102,060 6.4% 134,966 1.9% 8.5% 9.4% 22,593 -32,767 $15.68 $33.05 0 0 C 13 234,401 1,523 0.6% 3,843 0.0% 1.6% 1.6% 1,523 1,523 $16.09 $32.74 0 0 All 36 2,619,344 107,714 4.1% 171,500 8.3% 6.5% 7.9% 51,894 37,198 $16.35 $34.73 0 0 Yonge-Eglinton A 6 1,318,360 75,770 5.7% 108,919 41.6% 8.3% 17.0% 43,501 139,334 $16.38 $36.97 0 0 B 28 2,535,072 153,794 6.1% 282,149 8.8% 11.1% 9.3% 9,451 75,837 $14.55 $32.94 0 0 C 24 893,279 78,516 8.8% 98,235 0.0% 11.0% 11.3% -2,557 -4,142 $12.99 $27.36 0 0 All 58 4,746,711 308,080 6.5% 489,304 14.3% 10.3% 12.0% 50,395 211,029 $14.64 $32.72 0 0 Toronto West A 0 0 0 0.0% 0 0.0% 0.0% 0.0% 0 0 $0.00 $0.00 0 0 B 14 288,385 24,685 8.6% 24,685 0.0% 8.6% 243.9% 11,060 21,786 $15.00 $32.09 0 0 C 31 944,858 32,743 3.5% 36,866 0.0% 3.9% 6.1% -855 26,696 $11.54 $23.29 0 0 All 45 1,233,243 57,428 4.7% 61,551 0.0% 5.0% 59.6% 10,205 48,483 $12.93 $26.82 0 0 Midtown A 18 4,773,486 237,629 5.0% 372,584 26.3% 7.8% 12.4% 114,524 285,922 $21.06 $41.40 0 0 Total: B 98 9,993,081 394,745 4.0% 608,060 5.1% 6.1% 12.8% 45,278 174,554 $15.11 $33.85 0 0 C 97 3,465,733 223,523 6.4% 337,658 6.3% 9.7% 8.4% -6,340 40,312 $12.85 $28.76 0 0 All 213 18,232,300 855,898 4.7% 1,318,301 11.4% 7.2% 11.8% 153,463 500,787 $15.90 $34.25 0 0 Survey results presented on this report have been condensed for reference. Notes: 1 Office Inventory: For the purpose of this report, buildings with less than 10,000 SF of office space and buildings owned and occupied by the government have not been included in the office inventory. 2 Vacancy Rate: The Vacancy Rate is the amount of vacant space divided by the existing building inventory base. Vacant space is available and physically unoccupied, and it includes both head lease and sublease space. 3 Proportion of Sublease Availability: This ratio represents the share of available sublease space of the total available space. 4 Availability Rate: The Availability Rate is the amount of available space divided by the building inventory base. Available space is space that is available for lease and may or may not be vacant. 5 Average Rental Rates: Average rental rates are calculated off available spaces which also quote rental figures.
  • 4. Colliers Central East | Office Statistics 2011 Q2 Proportion of 2011 Q2 2010 Q2 Net Net Wgt Avg. Wgt Avg. Net Currently Office Market / Buildings Office Vacant Vacancy Available Sublease Availability Availability Absorption Absorption Asking Net Asking Gross New Supply Under 1 2 3 5 Submarket Class Surveyed Inventory Space Rate Space Availability Rate Rate 2011 Q2 12 Months Rental Rates Rental Rates 2011 Q2 Construction Don Mills - Eglinton A 6 1,082,940 19,959 1.8% 45,717 0.0% 4.2% 2.6% 0 78,605 $12.56 $29.06 0 0 B 38 3,788,141 258,380 6.8% 319,637 2.2% 8.4% 19.2% -33,426 -67,532 $11.32 $26.02 0 0 C 25 558,322 0 0.0% 26,340 0.0% 4.7% 4.7% 5,970 23,623 $11.00 $25.02 0 0 All 69 5,429,403 278,339 5.1% 391,694 1.8% 7.2% 14.6% -27,456 34,696 $11.44 $26.31 0 0 Duncan Mill A 3 528,307 9,917 1.9% 20,504 49.6% 3.9% 7.0% -3,520 245,610 $14.00 $28.46 0 0 B 20 1,405,763 92,187 6.6% 123,386 34.2% 8.8% 4.4% 0 42,143 $8.71 $22.90 0 0 C 15 374,146 1,560 0.4% 26,827 64.4% 7.2% 21.0% -8,860 -413 $11.43 $26.12 0 0 All 38 2,308,216 103,664 4.5% 170,716 40.8% 7.4% 7.2% -12,380 287,340 $9.77 $24.07 0 0 Consumer Road A 6 1,302,553 94,114 7.2% 219,665 7.5% 16.9% 16.8% -15,679 -1,359 $13.96 $31.41 0 0 B 16 1,972,881 183,941 9.3% 325,039 3.6% 16.5% 20.1% -12,541 31,553 $11.91 $26.33 0 0 C 8 473,993 48,789 10.3% 48,789 0.0% 10.3% 12.7% -475 3,657 $13.86 $23.07 0 0 All 30 3,749,427 326,844 8.7% 593,494 4.8% 15.8% 18.1% -28,695 33,851 $12.83 $27.94 0 0 Woodbine Steeles A 16 3,028,644 211,905 7.0% 429,895 19.3% 14.2% 10.8% -39,418 24,374 $13.52 $28.59 0 0 B 19 1,340,827 71,137 5.3% 87,166 0.0% 6.5% 11.6% 4,726 89,600 $10.12 $20.30 0 0 C 15 391,131 5,600 1.4% 5,600 0.0% 1.4% 0.8% 0 0 $8.50 $19.40 0 0 All 50 4,749,602 288,642 6.1% 522,661 15.9% 11.0% 10.3% -34,692 113,974 $12.90 $27.11 0 0 Toronto East A 3 265,650 0 0.0% 0 0.0% 0.0% 0.0% 0 0 $0.00 $0.00 0 0 B 12 871,932 5,433 0.6% 35,433 0.0% 4.1% 3.5% 0 31,662 $12.35 $17.44 0 0 C 5 215,879 7,050 3.3% 7,050 0.0% 3.3% 10.3% 7,950 7,950 $7.00 $20.70 0 0 All 20 1,353,461 12,483 0.9% 42,483 0.0% 3.1% 3.5% 7,950 39,612 $11.46 $17.98 0 0 Central East A 34 6,208,094 335,894 5.4% 715,781 15.3% 11.5% 9.8% -58,616 347,230 $13.61 $29.57 0 0 Area B 105 9,379,544 611,078 6.5% 890,660 6.9% 9.5% 14.6% -41,242 127,426 $11.20 $24.86 0 0 Total: C 68 2,002,471 62,999 3.1% 114,606 15.1% 5.7% 9.2% 4,585 34,817 $12.04 $23.51 0 0 All 207 17,590,109 1,009,971 5.7% 1,721,047 10.9% 9.8% 12.4% -95,273 509,473 $12.21 $26.64 0 0 Survey results presented on this report have been condensed for reference. Notes: 1 Office Inventory: For the purpose of this report, buildings with less than 10,000 SF of office space and buildings owned and occupied by the government have not been included in the office inventory. 2 Vacancy Rate: The Vacancy Rate is the amount of vacant space divided by the existing building inventory base. Vacant space is available and physically unoccupied, and it includes both head lease and sublease space. 3 Proportion of Sublease Availability: This ratio represents the share of available sublease space of the total available space. 4 Availability Rate: The Availability Rate is the amount of available space divided by the building inventory base. Available space is space that is available for lease and may or may not be vacant. 5 Average Rental Rates: Average rental rates are calculated off available spaces which also quote rental figures.
  • 5. Colliers Central North | Office Statistics 2011 Q2 Proportion of 2011 Q2 2010 Q2 Net Net Wgt Avg. Wgt Avg. Net Currently Office Market / Buildings Office Vacant Vacancy Available Sublease Availability Availability Absorption Absorption Asking Net Asking Gross New Supply Under 1 2 3 5 Submarket Class Surveyed Inventory Space Rate Space Availability Rate Rate 2011 Q2 12 Months Rental Rates Rental Rates 2011 Q2 Construction Yorkdale A 2 317,281 0 0.0% 0 0.0% 0.0% 0.5% 0 13,560 $0.00 $0.00 0 0 B 13 1,163,783 9,950 0.9% 20,929 0.0% 1.8% 2.2% 5,200 15,000 $9.00 $25.37 0 0 C 13 306,220 17,800 5.8% 23,610 3.4% 7.7% 13.1% 1,000 20,800 $9.00 $17.08 0 0 All 28 1,787,284 27,750 1.6% 44,539 1.8% 2.5% 3.7% 6,200 49,360 $9.00 $20.98 0 0 Dufferin Finch A 0 0 0 0.0% 0 0.0% 0.0% 0.0% 0 0 $0.00 $0.00 0 0 B 17 1,109,157 192,511 17.4% 208,338 0.0% 18.8% 1.8% 788 -165,552 $12.25 $23.94 0 0 C 15 301,078 3,400 1.1% 3,400 0.0% 1.1% 1.0% -2,200 6,505 $7.95 $18.13 0 0 All 32 1,410,235 195,911 13.9% 211,738 0.0% 15.0% 1.6% -1,412 -159,047 $12.18 $23.85 0 0 North Yonge A 23 6,064,089 380,955 6.3% 547,259 32.4% 9.0% 11.9% 6,047 201,387 $17.58 $37.12 0 0 Corridor B 27 2,536,866 59,725 2.4% 149,888 7.5% 5.9% 5.9% 10,716 64,113 $16.72 $34.40 0 0 C 16 293,061 1,280 0.4% 1,280 0.0% 0.4% 0.0% 1,190 -18,624 $18.00 $35.00 0 0 All 66 8,894,016 441,960 5.0% 698,428 27.0% 7.9% 9.8% 17,953 246,876 $17.40 $36.53 0 0 Central North A 25 6,381,370 380,955 6.0% 547,259 32.4% 8.6% 11.3% 6,047 214947 $17.58 $37.12 0 0 Area B 57 4,809,806 262,185 5.5% 379,156 3.0% 7.9% 4.1% 16,704 -86439 $13.75 $27.96 0 0 Total: C 44 900,359 22,480 2.5% 28,290 2.9% 3.1% 4.8% -10 8681 $9.29 $18.04 0 0 All 126 12,091,535 665,621 5.5% 954,705 19.8% 7.9% 7.9% 22,741 137189 $15.44 $32.03 0 0 Survey results presented on this report have been condensed for reference. Notes: 1 Office Inventory: For the purpose of this report, buildings with less than 10,000 SF of office space and buildings owned and occupied by the government have not been included in the office inventory. 2 Vacancy Rate: The Vacancy Rate is the amount of vacant space divided by the existing building inventory base. Vacant space is available and physically unoccupied, and it includes both head lease and sublease space. 3 Proportion of Sublease Availability: This ratio represents the share of available sublease space of the total available space. 4 Availability Rate: The Availability Rate is the amount of available space divided by the building inventory base. Available space is space that is available for lease and may or may not be vacant. 5 Average Rental Rates: Average rental rates are calculated off available spaces which also quote rental figures.
  • 6. Colliers GTA East | Office Statistics 2011 Q2 Proportion 2011 Q2 2010 Q2 Net Net Wgt Avg. Wgt Avg. Net Currently Office Market / Buildings Office Vacant Vacancy Available of Sublease Availability Availability Absorption Absorption Asking Net Asking Gross New Supply Under 1 2 3 5 Submarket Class Surveyed Inventory Space Rate Space Availability Rate Rate 2011 Q2 12 Months Rental Rates Rental Rates 2011 Q2 Construction Scarborough A 6 1,488,002 278,497 18.7% 409,187 33.3% 27.5% 20.1% 0 20,568 $14.20 $30.73 0 0 Town Centre B 30 1,765,570 81,641 4.6% 158,620 6.9% 9.0% 13.8% -375 9,751 $12.94 $27.35 0 0 C 23 676,559 18,085 2.7% 30,152 0.0% 4.5% 12.1% -12,600 12,455 $6.48 $22.59 0 0 All 59 3,930,131 378,223 9.6% 597,959 24.6% 15.2% 15.8% -12,975 30,175 $13.48 $29.42 0 0 Pickering Oshawa A 11 988,095 98,029 9.9% 99,729 0.0% 10.1% 0.0% 71,651 62,051 $15.54 $29.77 0 0 B 14 518,581 3,580 0.7% 27,071 35.5% 5.2% 0.0% 0 7,392 $14.51 $25.02 0 0 C 6 186,620 0 0.0% 0 0.0% 0.0% 0.0% 0 0 $0.00 $0.00 0 0 All 31 1,693,296 101,609 6.0% 126,800 7.6% 7.5% 7.6% 71,651 69,443 $15.32 $28.75 115,546 0 GTA East A 17 2,476,097 376,526 15.2% 508,916 26.8% 20.6% 15.3% 71,651 82,619 $9.94 $20.80 0 0 Area B 44 2,284,151 85,220 3.7% 185,691 11.1% 8.1% 13.2% -375 17,143 $7.33 $15.16 0 0 Total: C 29 863,179 18,085 2.1% 30,152 0.0% 3.5% 9.7% -12,600 12,455 $6.48 $22.59 0 0 All 90 5,623,427 479,831 8.5% 724,759 21.6% 12.9% 13.5% 58,676 99,618 $9.13 $19.43 115,546 0 Survey results presented on this report have been condensed for reference. Notes: 1 Office Inventory: For the purpose of this report, buildings with less than 10,000 SF of office space and buildings owned and occupied by the government have not been included in the office inventory. 2 Vacancy Rate: The Vacancy Rate is the amount of vacant space divided by the existing building inventory base. Vacant space is available and physically unoccupied, and it includes both head lease and sublease space. 3 Proportion of Sublease Availability: This ratio represents the share of available sublease space of the total available space. 4 Availability Rate: The Availability Rate is the amount of available space divided by the building inventory base. Available space is space that is available for lease and may or may not be vacant. 5 Average Rental Rates: Average rental rates are calculated off available spaces which also quote rental figures.
  • 7. Colliers GTA North | Office Statistics 2011 Q2 Proportion of 2011 Q2 2010 Q2 Net Net Wgt Avg. Wgt Avg. Net Currently Office Market / Buildings Office Vacant Vacancy Available Sublease Availability Availability Absorption Absorption Asking Net Asking Gross New Supply Under 1 2 3 5 Submarket Class Surveyed Inventory Space Rate Space Availability Rate Rate 2011 Q2 12 Months Rental Rates Rental Rates 2011 Q2 Construction Vaughan A 14 778,564 3,969 0.5% 3,969 0.0% 0.5% 0.0% 0 132,861 $18.00 $25.42 0 0 B 31 1,449,195 23,559 1.6% 87,937 21.4% 6.1% 5.0% 44,031 62,136 $14.40 $24.58 0 0 C 15 530,069 11,440 2.2% 30,266 0.0% 5.7% 5.1% 0 -5,200 $15.96 $25.30 0 0 All 60 2,757,828 38,968 1.4% 122,171 15.4% 4.4% 5.9% 44,031 189,797 $14.99 $24.82 0 63,515 Richmond Hill A 3 462,205 0 0.0% 0 0.0% 0.0% 0.0% 0 9,982 $0.00 $0.00 0 0 B 7 235,022 6,852 2.9% 9,036 0.0% 3.8% 0.0% 904 5,407 $12.85 $24.62 0 0 C 2 40,000 0 0.0% 0 0.0% 0.0% 0.0% 0 0 $0.00 $0.00 0 0 All 12 737,227 6,852 0.9% 9,036 0.0% 1.2% 0.6% 904 15,389 $12.85 $24.62 0 59,283 Hwy404-Hwy407 A 33 4,220,288 336,763 8.0% 635,517 39.8% 15.1% 0.0% 119,656 310,341 $17.95 $31.91 0 0 B 47 2,602,315 238,922 9.2% 256,757 0.5% 9.9% 12.8% 33,409 152,320 $14.55 $26.04 0 0 C 46 1,624,301 76,315 4.7% 117,963 4.1% 7.3% 7.0% -9,359 65,763 $10.91 $18.29 0 0 All 126 8,446,904 651,999 7.7% 1,010,237 25.7% 12.0% 13.2% 143,706 528,423 $15.73 $27.86 0 0 Markham A 11 1,286,384 134,269 10.4% 205,025 45.0% 15.9% 11.0% -728 -3,669 $13.59 $25.56 0 0 Town Centre B 24 1,785,436 55,103 3.1% 114,218 35.7% 6.4% 5.2% 20,225 53,633 $12.40 $22.02 0 0 C 15 412,214 76,512 18.6% 78,762 0.0% 19.1% 17.2% 2,625 9,780 $9.67 $15.84 0 0 All 50 3,484,034 265,883 7.6% 398,004 33.4% 11.4% 8.8% 22,122 59,744 $12.09 $21.69 0 0 GTA North A 61 6,747,441 475,000 7.0% 844,510 40.9% 12.5% 12.8% 118,928 449,515 $16.97 $30.43 0 0 Total: B 109 6,071,968 324,435 5.3% 467,948 13.0% 7.7% 8.2% 98,568 273,495 $14.10 $25.03 0 0 C 78 2,606,584 164,266 6.3% 226,991 2.1% 8.7% 8.2% -6,734 70,343 $11.16 $18.38 0 0 All 248 15,425,993 963,702 6.2% 1,539,449 26.7% 10.0% 10.3% 210,762 793,353 $14.79 $26.11 0 122,798 Survey results presented on this report have been condensed for reference. Notes: 1 Office Inventory: For the purpose of this report, buildings with less than 10,000 SF of office space and buildings owned and occupied by the government have not been included in the office inventory. 2 Vacancy Rate: The Vacancy Rate is the amount of vacant space divided by the existing building inventory base. Vacant space is available and physically unoccupied, and it includes both head lease and sublease space. 3 Proportion of Sublease Availability: This ratio represents the share of available sublease space of the total available space. 4 Availability Rate: The Availability Rate is the amount of available space divided by the building inventory base. Available space is space that is available for lease and may or may not be vacant. 5 Average Rental Rates: Average rental rates are calculated off available spaces which also quote rental figures.
  • 8. Colliers GTA West | Office Statistics 2011 Q2 Proportion of 2011 Q2 2010 Q2 Net Net Wgt Avg. Wgt Avg. Net Currently Office Market / Buildings Office Vacant Vacancy Available Sublease Availability Availability Absorption Absorption Asking Net Asking Gross New Supply Under 1 2 3 5 Submarket Class Surveyed Inventory Space Rate Space Availability Rate Rate 2011 Q2 12 Months Rental Rates Rental Rates 2011 Q2 Construction Airport A 21 2,513,567 491,570 19.6% 594,159 23.9% 23.6% 25.8% 103,745 287,880 $18.60 $32.01 0 0 Corporate Centre B 27 1,863,486 191,287 10.3% 293,222 43.5% 15.7% 8.5% 16,617 -66,668 $14.54 $28.10 0 0 C 31 1,383,218 226,860 16.4% 318,462 14.5% 23.0% 2.4% -6,938 -15,520 $14.59 $23.22 0 0 All 79 5,760,271 909,717 15.8% 1,205,843 26.2% 20.9% 14.7% 113,424 205,692 $16.56 $28.74 0 0 Airport East A 8 957,966 123,495 12.9% 266,411 16.1% 27.8% 27.3% 29,230 63,728 $15.08 $29.93 0 0 B 34 2,221,265 363,603 16.4% 534,325 15.2% 24.1% 26.4% 134,068 171,574 $12.45 $24.43 0 0 C 27 985,197 68,748 7.0% 80,839 10.1% 8.2% 12.5% 3,970 35,000 $9.98 $18.57 0 0 All 69 4,164,428 555,845 13.3% 881,575 15.0% 21.2% 23.4% 167,268 270,302 $13.02 $25.56 0 0 Airport West A 21 2,613,606 49,783 1.9% 87,267 15.3% 3.3% 3.3% 0 23,808 $13.07 $24.80 0 0 B 27 1,458,228 30,836 2.1% 54,736 0.0% 3.8% 2.0% 1,170 4,171 $11.93 $21.88 0 0 C 11 339,719 18,624 5.5% 26,964 0.0% 7.9% 16.3% 32,891 98,261 $7.81 $16.38 0 0 All 59 4,411,553 99,243 2.2% 168,968 7.9% 3.8% 4.5% 34,061 126,241 $11.86 $22.51 0 0 Brampton A 13 742,916 73,473 9.9% 107,810 30.1% 14.5% 4.1% 1,831 36,780 $16.92 $28.10 0 0 B 13 1,658,846 32,806 2.0% 92,806 0.0% 5.6% 0.2% 0 0 $12.70 $18.80 0 0 C 5 107,426 13,365 12.4% 13,365 0.0% 12.4% 49.2% 16,214 16,709 $12.00 $23.75 0 0 All 31 2,509,188 119,644 4.8% 213,981 15.1% 8.5% 3.5% 18,045 53,489 $14.78 $23.80 0 0 Burlington A 19 1,754,171 149,400 8.5% 225,814 27.2% 12.9% 16.3% -2,058 47,543 $17.42 $28.55 0 0 B 36 1,499,965 84,509 5.6% 117,584 12.1% 7.8% 8.9% 36,325 11,431 $13.55 $22.01 0 0 C 29 1,048,162 50,735 4.8% 104,556 4.9% 10.0% 8.8% 9,105 31,401 $11.23 $17.00 0 0 All 84 4,302,298 284,644 6.6% 447,954 18.0% 10.4% 12.0% 43,372 90,375 $14.96 $24.14 0 0 Cooksville A 5 664,087 9,356 1.4% 20,156 27.8% 3.0% 3.2% 3,726 7,992 $15.58 $29.31 0 0 B 19 831,027 57,642 6.9% 57,642 6.4% 6.9% 6.2% 0 12,058 $15.48 $26.01 0 0 C 13 323,292 29,652 9.2% 29,652 0.0% 9.2% 10.1% 3,776 10,240 $7.00 $18.00 0 0 All 37 1,818,406 96,650 5.3% 107,450 8.7% 5.9% 5.8% 7,502 30,291 $13.16 $24.42 0 0 Hwy401 A 9 1,763,830 132,265 7.5% 239,696 24.9% 13.6% 15.6% -54,781 -78,583 $13.21 $25.29 0 0 Hurontario B 12 743,944 32,597 4.4% 42,350 0.0% 5.7% 7.3% 4,876 -11,136 $11.62 $22.71 0 0 C 17 756,939 8,320 1.1% 27,036 24.7% 3.6% 4.4% -8,320 12,127 $10.18 $19.87 0 0 All 38 3,264,713 173,182 5.3% 309,082 21.5% 9.5% 11.1% -58,225 -77,592 $12.73 $24.46 0 0 Hwy427 A 14 2,361,188 259,659 11.0% 306,785 10.0% 13.0% 8.1% -155,302 -283,525 $14.58 $30.95 0 0 Bloor-Islington B 34 1,555,926 121,154 7.8% 135,570 0.0% 8.7% 11.8% -127,198 -102,086 $10.72 $23.99 0 0 C 25 638,776 11,867 1.9% 50,905 0.0% 8.0% 3.5% -2,696 46,202 $8.54 $20.91 0 0 All 73 4,555,890 392,680 8.6% 493,260 6.2% 10.8% 8.7% -285,197 -339,409 $12.89 $28.00 0 0 Mississauga A 14 3,002,934 232,663 7.7% 449,339 16.5% 15.0% 10.6% 34,438 95,481 $16.92 $33.02 0 0 City Centre B 9 530,735 7,561 1.4% 13,691 44.8% 2.6% 4.0% 5,302 22,770 $13.50 $23.09 0 0 C 13 225,898 0 0.0% 4,581 0.0% 2.0% 0.0% 1,456 -456 $14.00 $23.49 0 0 All 36 3,759,567 240,224 6.4% 467,611 17.1% 12.4% 9.0% 41,196 117,795 $16.79 $32.63 0 0 Meadowvale A 18 3,221,780 132,352 4.1% 211,352 60.8% 6.6% 5.1% 35,435 78,065 $18.17 $33.06 0 0 B 41 2,433,725 288,065 11.8% 386,009 17.4% 15.9% 16.6% 15,836 -16,697 $15.48 $26.31 0 0 C 41 1,609,387 164,107 10.2% 200,084 6.3% 12.4% 15.2% -13,641 35,133 $11.88 $18.34 0 0 All 100 7,264,892 584,524 8.0% 797,445 26.1% 11.0% 11.4% 37,630 96,501 $15.29 $26.10 0 375,000 Sheridan Winston A 4 347,676 0 0.0% 0 0.0% 0.0% 14.7% 0 73,679 $0.00 $0.00 0 0 B 21 1,254,260 15,180 1.2% 21,480 0.0% 1.7% 7.1% 13,810 18,032 $11.50 $22.06 0 0 C 13 439,916 2,562 0.6% 7,627 0.0% 1.7% 10.7% -6,475 -2562 $11.25 $16.22 0 0 All 38 2,041,852 17,742 0.9% 29,107 0.0% 1.4% 9.1% 7,335 89149 $11.43 $20.53 0 0 Oakville A 14 1,446,934 182,297 12.6% 194,728 7.4% 13.5% 15.5% -12,521 -14,398 $18.96 $30.74 0 0 B 34 1,386,079 71,244 5.1% 200,487 4.0% 14.5% 17.0% 23,072 64,803 $16.59 $26.43 0 0 C 23 577,915 42,563 7.4% 75,554 1.5% 13.1% 8.9% -6,973 -4216 $13.34 $24.80 0 0 All 71 3,410,928 296,104 8.7% 470,769 5.0% 13.8% 15.0% 3,578 46189 $17.05 $27.95 0 420,468 GTA West A 160 21,390,655 1,836,314 8.6% 2,703,517 22.4% 12.6% 12.1% -16,259 338,451 $16.58 $30.50 0 0 Total: B 307 17,437,486 1,296,482 7.4% 1,949,901 15.8% 11.2% 11.3% 123,878 108,252 $13.73 $24.78 0 0 C 248 8,435,845 637,404 7.6% 939,626 8.5% 11.1% 9.5% 22,370 262,318 $12.10 $20.52 0 0 All 715 47,263,986 3,770,199 8.0% 5,593,044 17.7% 11.8% 11.3% 129,989 709,021 $14.73 $26.59 0 795,468 Survey results presented on this report have been condensed for reference. Notes: 1 Office Inventory: For the purpose of this report, buildings with less than 10,000 SF of office space and buildings owned and occupied by the government have not been included in the office inventory. 2 Vacancy Rate: The Vacancy Rate is the amount of vacant space divided by the existing building inventory base. Vacant space is available and physically unoccupied, and it includes both head lease and sublease space. 3 Proportion of Sublease Availability: This ratio represents the share of available sublease space of the total available space. 4 Availability Rate: The Availability Rate is the amount of available space divided by the building inventory base. Available space is space that is available for lease and may or may not be vacant. 5 Average Rental Rates: Average rental rates are calculated off available spaces which also quote rental figures.